
From the 1King’s College London, Department of Palliative Care, Policy and Rehabilitation, Faculty of Life Sciences and Medicine, 2Regional Hyper-acute Rehabilitation Unit, Northwick Park Hospital, London North West Healthcare NHS Trust, London, UK, 3University of Waikato, School of Psychology, and 4Auckland University of Technology, School of Public Health & Psychosocial Studies and School of Clinical Sciences, Auckland, New Zealand
Objective: To determine whether the UK Functional Assessment Measure (UK FIM+FAM) fits the Rasch model in patients with complex disability following traumatic brain injury.
Design: Psychometric evaluation including preliminary exploratory and confirmatory factor analyses followed by Rasch analysis.
Participants: A multicentre UK national cohort of 1,956 patients admitted for specialist rehabilitation following traumatic brain injury.
Results: The suitability of the Partial Credit Model was confirmed by the likelihood-ratio test (χ2 (df86) =7,325.0, p < 0.001). Exploratory and confirmatory factor analyses supported 3 factors (Motor, Communication, Psychosocial). Rasch analysis of the full scale incorporating the 3 factors as super-items resulted in an acceptable overall model fit (χ2 (df24)=36.72, p = 0.05) and strict uni-dimensionality when tested on a sub-sample of n = 320. These results were replicated in a full sample (n = 1,956) showing uni-dimensionality and good reliability with Person Separation Index = 0.81, but item trait interaction was significant due to the large sample size. No significant differential item functioning was observed for any personal factors. Neither uniform re-scoring of items nor exclusion of participants with extreme scores improved the model fit.
Conclusion: The UK FIM+FAM scale satisfies the Rasch model reasonably in traumatic brain injury. A conversion table was produced, but its usefulness in clinical practice requires further exploration and clinical translation.
Key words: Rasch analysis; functional assessment measure; rehabilitation; outcome; traumatic brain injury.
Accepted Jun 14, 2019; Epub ahead of print Jun 27, 2019
J Rehabil Med 2019; 51: 566–574
Correspondence address: Lynne Turner-Stokes, King’s College London, Department of Palliative Care, Policy and Rehabilitation, Faculty of Life Sciences and Medicine, London, UK. E-mail: lynne.turner-stokes@doctors.org.uk
The UK Functional Assessment Measure (UK FIM+FAM) is a scale used to evaluate the outcome of rehabilitation after acquired brain injury as part of the UK Rehabilitation Outcomes Collaborative (UKROC). The FIM+FAM is administered by clinicians and measures how well -people are recovering their independence. It has 30 separate questions concerning a person’s physical (e.g. eating, toileting, bathing) and cognitive (e.g. expression, memory, safety awareness) independence. Data from 1,956 UK patients who had survived a traumatic brain injury were analysed. The main purpose of this study was to establish that the FIM+FAM meets some of the stringent technical standards for clinical and scientific measurement. A statistical method known as Rasch analysis was used to demonstrate that the FIM+FAM produces accurate and reliable scores. The results showed that the FIM+FAM is a practical and useful scale for measuring change in people in rehabilitation after a traumatic brain injury.
Outcome measurement is a key requirement for rehabilitation services to support comparison of programmes, practices and populations. Traumatic brain injury (TBI) poses particular challenges for outcome evaluation in rehabilitation. As well as improvement in independence for activities of daily living, measurement tools need to encompass changes in cognitive, communicative and psychosocial function, which are often the main factors that limit independence following TBI.
The Functional Independence Measure (FIM™) (1, 2) is an 18-item measure of functional independence, which is widely used as a measure of outcome from rehabilitation. Although 5 of the items address elements of communication and cognitive function, its predominant focus is on physical function and it has well recognized ”ceiling” effects (3). The Functional Assessment Measure (FAM) was developed in the 1990s specifically for more ambulant patients with TBI. It adds 12 items to the FIM scale, mainly addressing cognitive and psychosocial function, with the intent of extending the range of difficulty in this group (3, 4). From a scaling perspective, the FAM items as a whole may have little impact on the ceiling effects of the FIM™ in higher functioning patients (5), but from a clinical perspective they may still provide useful information about the less visible aspects of neurological disability for patients at all levels (6). Adapted from the original US version, the UK Functional Assessment Measure (UK FIM+FAM) was first published in 1999 (7). The 30-item scale comprises 16 motor items (including self-care and mobility) and 14 cognitive items (including communication, cognition and psychosocial adjustment).
The UK Rehabilitation Outcomes Collaborative (UKROC) (8) provides the national clinical database for all specialist in-patient rehabilitation services in England. These services cater for a selected population of patients with severe complex neurological disability. The UK FIM+FAM is the principal measure of functional outcome within the dataset and, since 2013, its collection is a mandated requirement for reimbursement within these services. It is therefore pertinent to understand its psychometric properties in this context. In addition, transformation of the scale from ordinal to interval-level data (using techniques such as Rasch analysis (9–11)) confers theoretical advantages for clinical practice, potentially increasing sensitivity by stretching the existing ogive raw score points at both the upper and lower margins, as well as enabling the calculation of valid change scores.
Traditional psychometric evaluations of the UK FIM+FAM in both a general neuro-rehabilitation cohort and in stroke patients (12, 13) have shown the UK FIM+FAM to have 3 distinct subscales: Motor, Communicative, and Psychosocial. Two studies from the 1990s have explored the linear Rasch transformation of the original US FIM+FAM scale following TBI and showed partial conformation to the Rasch model (14, 15). However, approaches to Rasch analysis have changed significantly in the last 20 years (16), and as yet there are no published Rasch analyses of the UK FIM+FAM scale in patients with TBI.
Our recent Rasch analysis of the UK FIM+FAM in patients with complex disability following stroke (17)provided evidence for uni-dimensionality. It showed that the best fit was achieved where responses for the 16-item ”Motor”, 5-item ”Communicative” and 9-item ”Psychosocial” subscales were summarized into 3 super-items, and were split for left and right hemisphere stroke location due to differential item functioning (DIF). This approach satisfied the expectations of the Rasch model without the need for re-scoring of item thresholds or exclusion of extreme scores.
The aim of this study was to determine whether the UK FIM+FAM fits the Rasch model in patients with complex disability following TBI in a similar manner to patients with stroke, and if so, to derive a conversion table of Rasch-transformed scores for potential clinical use.
Setting and participants
In the UK, rehabilitation services are broadly categorized on 3 levels (18). Following TBI, the majority of patients will have relatively simple rehabilitation needs and make a good recovery with the support of their local (Level 3) rehabilitation services. However, a smaller number have more complex disability requiring specialist rehabilitation in either local district (Level 2) or regional (Level 1) rehabilitation services. The UKROC database provides the national clinical database for all Level 1 and 2 rehabilitation services in England. The study sample therefore represents a selected group of adults with complex disability following severe brain injury.
Principles of approach
Where an instrument is already established in clinical use and the content and ordinal scoring system have some meaning for clinicians, a balance may need to be found between maintaining the integrity of the scale and finding the best fit solution for a transformed scale. In addition, patients with complex disability following TBI form a more diverse patient group than stroke patients, with deficits ranging from ambulant patients with highly challenging behaviours to severe physical disability. The diversity of this sample represents a challenge for the psychometric properties of the FIM+FAM. Hence, we expected that this analysis might not fit the Rasch model quite as readily as in more homogeneous conditions.
UK FIM+FAM
The 30 items of UK FIM+FAM are each scored on a 7-point ordinal scale as follows: 1 (Total assistance); 2 (Maximal assistance); 3 (Moderate assistance); 4 (Minimal assistance); 5 (Supervision/set-up); 6 (Independent with device); and 7 (Fully independent). A category of 6 or 7 implies no help from another person, whilst assessment for categories 1 to 4 is often based on frequency of intervention. Like the US version, the FIM components of the UK FIM+FAM are retained in order to maintain comparability for that component of the scale with units that use the FIM only. Amongst the FAM items, 3 are structurally different in the UK version (1999) compared with the original US version (1994): ”Concentration”’ replaces ”Attention”; ”Safety awareness” replaces ”Safety judgement”; and ”’Use of leisure time” replaces ”’Employability”. The rationale for these differences is described in the 1999 source paper for the UK FIM+FAM.
Data source
The data source for this analysis was the UKROC database, which was initially set up by a National Institute for Health Research Programme Grant (19). It is now commissioned directly by NHS England to provide the national clinical and commissioning database for specialist inpatient rehabilitation in England. The dataset comprises socio-demographic and clinical data as well as information on rehabilitation needs, inputs and outcomes on admission and discharge from inpatient rehabilitation. Reporting of UK FIM+FAM data has been a commissioning requirement for Level 1 and 2 rehabilitation services since April 2013. Specialist Level 1 and 2 rehabilitation services have a mean length of stay of approximately 90 days (SD 66) (20). The UK FIM+FAM is usually completed for each patient within 10 days of admission and during the last week before discharge, to evaluate the functional gains made during the episode of care.
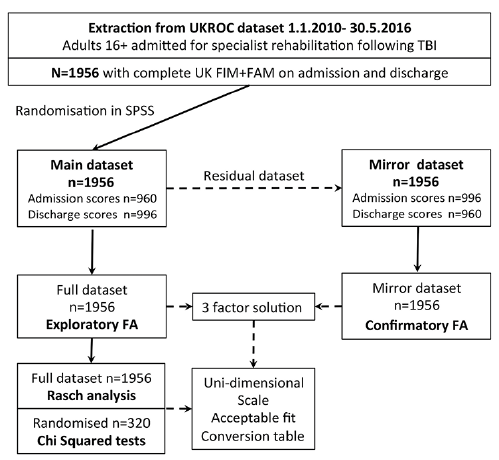
We extracted the cohort of all 1,956 TBI patients consecutively admitted to the 58 Level 1 and 2 specialist neurorehabilitation centres that submitted data to the UKROC database between 1 January 2010 and 30 May 2016, for whom a UK FIM+FAM score was available both at admission and discharge from the rehabilitation programme. A similar process for data extraction and analysis was used to that in the previous publications for stroke (12, 17), as summarized in Fig. 1.
Fig. 1. Summary of data sampling. Of the 1,956 consecutively admitted traumatic brain injury (TBI) patients with complete UK Functional Assessment Measure (UK FIM+FAM) data, admission and discharge scores were randomly selected (using 1 time-point only for each patient) to form the main dataset for exploratory factor analysis (EFA) and Rasch analysis. A mirror dataset was prepared using the remaining scores for confirmatory factor analysis of an independent sample. UKROC: UK Rehabilitation Outcomes Collaborative; SPSS: IBM Statistical Package for Social Sciences; confirmatory FA: confirmatory factor analysis.
The scores are expected to be lower (more dependent) on admission and higher (more independent) on discharge. Therefore, to ensure the full range of the response category necessary to evaluate reliability, and in line with previous analyses (17), we pooled admission and discharge scores from the complete sample of n = 1,956 into a single dataset. In order not to violate the Rasch assumption of local independence between observations, we included only one time-point for each patient, with both time-points equally represented. For the main dataset the random sampling function in SPSS was used to divide the dataset into approximately equal halves, giving 960 admission scores and 996 discharge scores. A mirror dataset was prepared using the remaining scores (996 admission and 960 discharge scores) for confirmatory factor analysis (CFA) of an independent sample.
Overview of analysis
The key steps were as follows:
Rasch analysis
The most suitable type of Rasch model for the analysis was determined by the likelihood-ratio test examining the assumption of the Rating Scale Model acting as a null hypothesis that distribution of item thresholds across individual scale items is the same. If the likelihood-ratio test is significant it rejects the Rating Scale Model. Since we are examining the full scale and not specific groups of items, there is no alternative for the unrestricted Partial Credit Model if the Rating Scale Model is rejected. The summary statistics of the Rasch model were assessed based on mean item and person location, fit residual, item-trait interaction χ2 test/p-value. A scale with the items ideally targeted to the population has the mean person location and the mean item location approximately at zero logits (SD 1), and item and person distributions that mirror one another. The item-trait interaction reflects the fit of the data to the model’s expectations; a significant p-value of < 0.05 indicates inadequate fit to the model. Reliability was estimated using Person Separation Index (PSI). The PSI is a measure of scale ability to discriminate between persons with different trait levels. Its values can be interpreted similar to Cronbach’s alpha used in classical test theory (27); values above 0.7 are required for group use and above 0.8 for individual assessment (although values of over 0.9 are preferred).
The Rasch analysis was carried out in 2 main analytical pathways using the full main dataset, but, as the subjects were found to be well-targeted to the scale (see Results section), item trait and χ2 tests were conducted on the reduced subset (n = 320) to account for the effects of sample size. In the first analysis, all 30 items were fitted to the Rasch Model without adjustment of any kind. The second used a super-item approach based on the method used by Lundgren Nilsson and colleagues (16) to solve local dependency issues between items of distinct domains. Locally dependent items were combined into 3 super-items based on the 3-factor structure identified by steps 1 and 2 above.
In line with our previous analysis in stroke (17), item calibrations and DIF were explored across potential person factors including age group (16–32, 33–49, 50–65, > 65 years), sex, diagnosis subcategory (global/diffuse, frontal, left hemisphere, right hemisphere), and time-point (admission or discharge) and patient dependency level based on The Northwick Park Dependency Score (28). The uni-dimensionality of the scale was assessed using PCA of the residuals (29). This involves comparing person estimates of the 2 groups of items with highest positive and negative loadings on the first principal component of residuals after controlling for the latent Rasch factor using a t-test procedure. Evidence of uni-dimensionality is obtained if the percentage of significant t-tests is below 5% or the lower bound of a binomial confidence interval computed for the number of significant t-tests overlaps the 5% cut-off point (29). A significance value of 0.05 was used throughout.
The socio-demographic and clinical characteristics of the Rasch study sample, and the UKROC population from which it was drawn, are shown in Table I. The full dataset, and the Rasch sub-sample of n = 320 were similar on all parameters.
Table I. The UKROC: trauma brain injury population and the Rasch random sample characteristics
The results of EFA are summarized in Table II. All items loaded strongly onto a single first component (all loadings > 0.58) with Cronbach’s alpha 0.976, accounting for 60% of the variance. Four factors had eigenvalues > 1.0, but the fourth contained only one item (”Community mobility”), which is rarely assessed and so rated 1 (”not assessed”) by scoring convention. The remaining 3 factors (Motor (16 items), Psychosocial (9 items) and Communication (5 items)) together accounted for 73% of the variance. As suggested by a previous factor analysis in TBI patients, a 2-factor model was also explored, which accounted for 70% of the variance.
Table II. Principal component loadings after varimax rotation
CFA for a 3-factor model showed a marginal fit as shown in Figure 2. This model included correlated of error terms for nine pairs of items with the largest modification indices. The fit indices did not meet the criteria for an excellent fit, but were all in the borderline acceptable range (RMSEA 0.094, CFI = 0.926, TLI = 0.918, NFI = 0.922) While the χ2/df ratio was large (18.103), giving a highly significant p-value (0.000), this is more likely to be a reflection of the large sample size than the model fit (30). The fit was only marginally improved by further correlation of error terms and thus we proceeded to Rasch analysis.
Fig. 2. Summary of findings from confirmatory factor analysis. CFA confirmed a 3-factor solution. Correlations between the factors ranged from 0.74 to 0.86.
The suitability of the Partial Credit Model for Rasch analysis was confirmed by the significant likelihood-ratio test (χ2 (df86) = 7,325.0, p < 0.001) Table III includes fit statistics for individual items together with response frequencies for each category within the main dataset (n = 1,956) and for the domain scores presented for both the full dataset and the sub-sample (n = 320). A preponderance of scores at the ends of the range is expected for a dataset that includes both admission and discharge data, and indeed there was a greater preponderance of response category scores at the lowest end of the scale for the admission sample, and upper end in the discharge sample. Table IV summarizes the overall fit statistics from the main stages of the Rasch analysis.
Table III. Frequency distribution of responses and Rasch model fit statistics for the UKFIM+FAM items (n = 320). See Table SI1 for an equivalent table for individual items the full dataset (n = 1,956)
First analytical pathway (all 30 items). The initial analysis of the full 30-item scale is marked by satisfactory reliability (PSI = 0.94). However, the overall model fit was poor with significant item-trait interaction. At the individual item level, 14 out of 30 items showed significant misfit to the Rasch model on the n = 320 sub-sample (Table III).
Second analytical pathway (3 super-items). The second analytical pathway was conducted using 3 super-items created by combining the items within the Motor, Communication and Psychosocial domains identified from the factor analyses. Prior to combining domain items into super-items residual correlation matrix was examined. Residual correlations exceeding the cut-off point of 0.20 above the mean of all residual correlations were found for 59 pairs of items in Motor, 5 pairs in Communication, and 26 pairs in Psychosocial domain. Rasch analysis of 3 super-items resulted in acceptable overall model fit (χ2 (df24) = 36.72, p = 0.05), strict uni-dimensionality and no local dependency when tested on the sub-sample (n = 320) (Table IV, Pathway 2). The proportion of common error-free variance A=0.88 was marginally below 0.90 suggesting that use of transformation table based on this 3 super-item solution may be preferable to the ordinal scale for calculation of change scores. This analysis was replicated with the full dataset (n = 1,956) showing good reliability PSI of 0.81, (Cronbach’s alpha=0.78), strict uni-dimensionality (< 5% t-tests significant at < 0.05), and no local dependency. However, the item-trait interaction was significant (χ2 (df24) =159.1, p < 0.001) confirming the expected inflation of χ2 statistics due to large sample size. As with our previous analysis for stroke (17), neither uniform re-scoring of items nor exclusion of participants with extreme scores improved the fit of the model, so these data are not presented.
Table IV. The UK FIM FAM: Rasch model summary statistics (overall fit of the scale)
Analysis of DIF showed no significant DIF by any of the personal factors. At the individual super-item level there were no signs of local dependency and all showed acceptable fit residual and χ2 values (Table III). Fig. S11 shows the person-item threshold distribution for the final analysis with the full sample and indicates excellent targeting of the sample by the items thresholds with the person mean of –0.04 (SD 0.52). This justifies using a smaller sub-sample (n = 320) to estimate a χ2 statistic sensitive to the sample size. Table V shows the conversion table for the full-scale model. We then correlated the interval scores from Table V with the interval scores obtained for the same FIM+FAM raw score in our previous Rasch analysis with a UKROC stroke dataset to determine whether a single conversion table could suffice. Fig. 3 shows a scatterplot illustrating the relationship between ordinal summed raw scores and Rasch interval scores comparing TBI with left and right strokes. To investigate whether separate conversion tables for TBI and stroke patients were necessary, we pooled our previously reported stroke samples (n = 680 left; nn = 638 right stroke) (17) with a randomly selected TBI sample of comparable size (n = 680) and conducted DIF analysis for 3 super-item solution. Significant DIF was identified between left stroke and TBI for all 3 super-items: Motor (F(1, 1316) = 152.03, p < 0.001), Communication (F(1, 1316) = 59.84, p < 0.001) and Psychosocial (F(1, 1316) = 137.94, p < 0.001). Significant uniform DIF was also identified between right stroke and TBI samples for the Communication (F(1, 1358) = 8.64, p = 0.003) and Psychosocial (F(1, 1358) = 19.40, p < 0.001) super-items. DIF plots (A-F) are included in Fig. S2A–F. These would suggest that separate conversion tables for stroke and TBI are necessary. However, as demonstrated by Fig. 3, the differences lie predominantly in the middle range of the scale and further work is required to determine whether they are sufficiently meaningful at a clinical level to justify separate transformation tables for the different conditions.
Table V. The UK FIM+FAM conversion table based on raw and interval scores
Fig. 3. Scatterplot of interval vs ordinal data. A scatterplot illustrating the relationship between the UK Functional Assessment Measure (UK FIM+FAM) ordinal summed raw scores and Rasch interval scores comparing traumatic brain injury (TBI) with left and right strokes.
This study represents the first Rasch analysis of the UK FIM+FAM scale in patients with TBI. The aim was to determine whether the instrument fits the Rasch model in a similar manner to patients with stroke, and if so, to derive a conversion table of Rasch-transformed scores for potential clinical use.
The best fit model was obtained when items were combined into the 3 super-items, and the scale fitted the Rasch model reasonably without any item deletion, amendment or rescoring. However, as with the stroke patients, at both ends of the scale the relationship between the Rasch measure and the raw scores is extremely steep, while in the middle of the scale the distribution of the scores is notably ”flat”. Table V also confirms that the difference in the summed raw scores between 97 and 197 (100 units on the horizontal axis in Fig. 3) corresponds to a difference in the summed Rasch interval admission scores between 120 and 140 (i.e. just 20 units on the vertical axis). That many raw score points are to be found within a narrow logit range of functioning reflects the fact that the thresholds from different items fall closely together across this functional space and presents a good example of the tension between a Clinimetric and Psychometric perspective (31). The clinical information is important at individual level, as patients are improving on tasks within a clinical framework that is recognisable by clinicians, but the psychometric evidence is that such improvement (i.e. each additional raw score point) is marginal in the overall scale of functioning, and could give a misleading impression of the speed of recovery. The opposite is true for those at the margins of the scale. Linearisation thus confers the potential advantage of greater discrimination in the upper and lower ends, together with more robust statistical properties – for example enabling calculation of valid change scores, which may be important for research, but transformed scores are less recognisable by clinicians, which may explain their limited uptake to date in clinical settings. We suggest that, while the Rasch-transformed scores may be useful for research purposes, their widespread adoption into routine clinical practice will require further work at the translational level.
Because people were expected to have a preponderance of lower scores on admission and higher scores on discharge, our main Rasch analysis was conducted on a mixed admission and discharge sample, to ensure that the full range of the response categories were represented. As illustrated in Table III, this resulted in a preponderance of scores in the lowest and highest response categories in the sample, which effectively creates a U-shaped distribution, as opposed to the more normal distribution that would be expected in a cross-section of a disabled population. This bi-modal distribution reflects the chosen time-points at each end of the programme, rather than being a reflection of the scaling properties of the UK FIM+FAM (i.e. people not being able to endorse answers in the middle range of the scale). However, while the scarcity of mid-range scores affected the PSI by inflating measurement error, it should not have any influence on the Rasch logistic model shape because the Rasch model has no distributional assumptions. Given the extreme (bi-modal) distribution of the TBI scores, the PSI value of 0.81 found in this study may be considered satisfactory for group analyses, but use for individual assessment warrants further clinical testing.
This relationship between study sample distribution and the Rasch model fit is an interesting finding that deserves further exploration with psychometric techniques, including generalizability theory (32). The floor and ceiling effects of the UK FIM+FAM are well recognized for the population as a whole (14, 15). However, as with many scales used for outcome evaluation in rehabilitation, the level descriptors were designed to capture the types of change that may be expected to occur within an inpatient rehabilitation setting, as the patient progresses to the level of independence required for transition to the community. In this context the range is quite suitable for the population of inpatients with complex disabilities requiring specialist rehabilitation following acquired brain injury (which is the setting in which it is used in the UK(20)). But, because the FIM+FAM is rated only on admission and discharge in UK clinical settings, there is limited opportunity to capture progression through the range of scores that may be expected to occur during the rehabilitation journey. Were the instrument to be rated at frequent intervals throughout the programme (as occurs with the FIM in some US rehabilitation programmes) one might expect a more normal distribution of scores. In view of the time commitment, this is not feasible in a busy clinical setting. A more normal-shaped distribution could be also achieved by purposive selection, but this would not reflect normal clinical experience.
Limitations
In addition to the limitations above, the authors recognize that the UKROC population is a selected group of patients with severe TBI and highly complex rehabilitation needs requiring specialist rehabilitation. The findings may not therefore not be generalizable to the overall TBI population. However, they would be relevant to other groups of TBI patients requiring treatment in specialist or tertiary centres, which are probably the main services that are likely to be using the UK FIM+FAM as an outcome measure.
Conclusion
Our results suggest that UK FIM+FAM meets the Rasch model expectations, confirming that it has acceptable properties as an interval scale. Further work is required to determine whether the use of transformed scores confers significant benefit in a clinical setting.
The authors would like to express their thanks to all of the patients and clinicians who contributed to the UKROC dataset. Many thanks to Heather Williams and Keith Sephton for help with data extraction and cleaning.
This manuscript presents independent research funded by the National Institute for Health Research (NIHR) under its Programme Grants for Applied Research Programme (RP-PG-0407-10185). The views expressed in this article are those of the authors and not necessarily those of the NHS, the NIHR, or the Department of Health.
The authors have no conflicts of interest to declare.


 Click to show fullsize
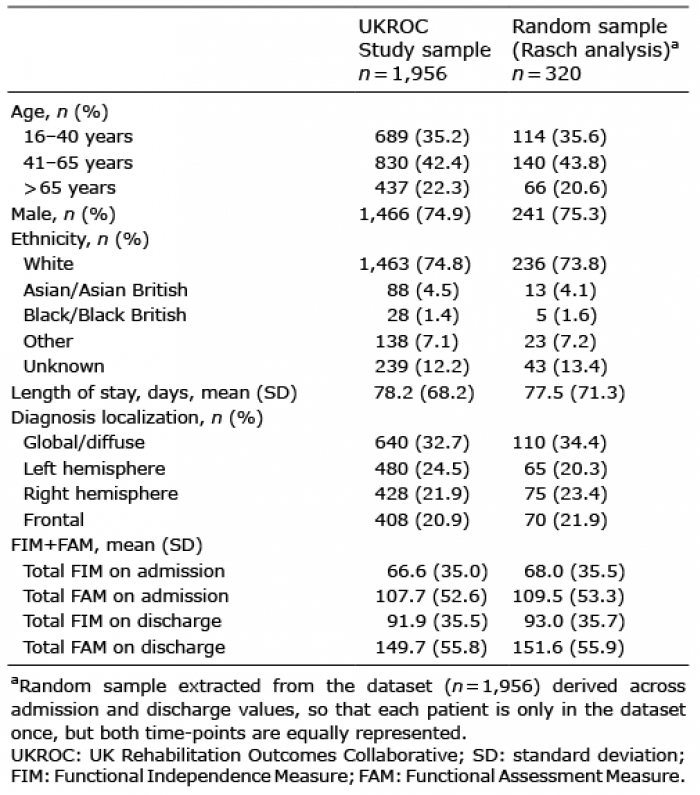 Click to show fullsize
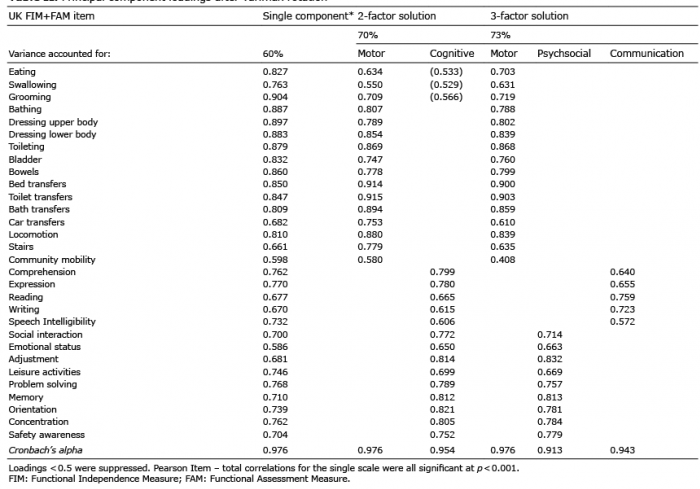 Click to show fullsize
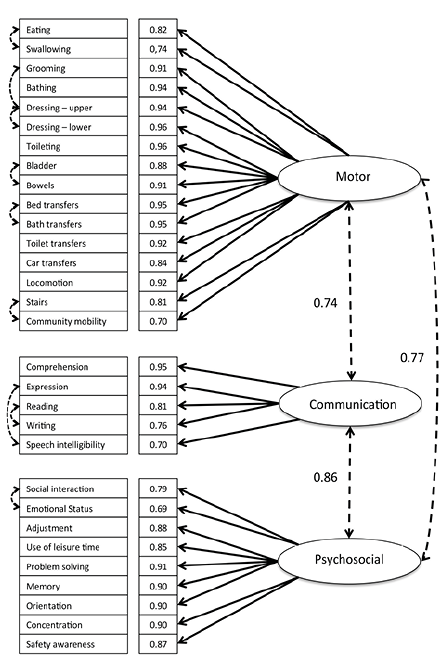 Click to show fullsize
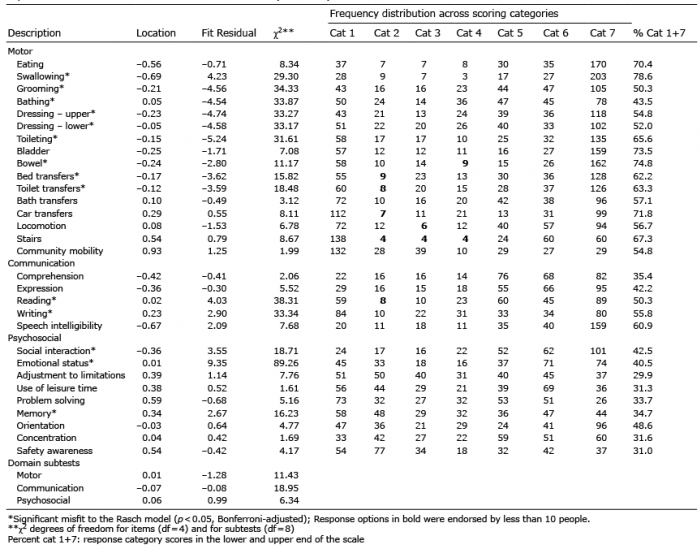 Click to show fullsize
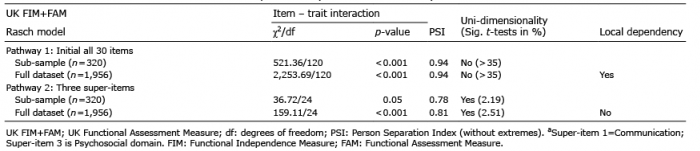 Click to show fullsize
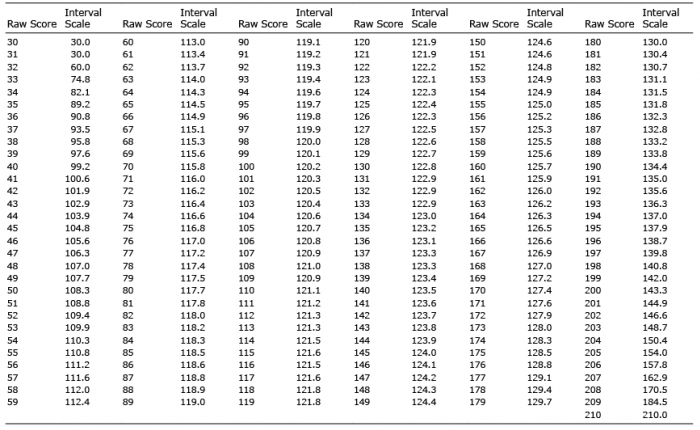 Click to show fullsize
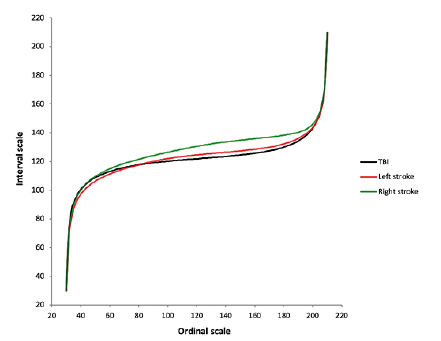 Click to show fullsize