
From the 1University of Auckland, School of Medicine, Centre for Medical and Health Sciences Education, Auckland, New Zealand, 2King’s College London, Cicely Saunders Institute, School of Nursing, Midwifery and Palliative Care, Department of Palliative Care Policy and Rehabilitation, 3Northwick Park Hospital, London North West Healthcare NHS University Trust, London, UK, and 4Auckland University of Technology, School of Public Health & Psychosocial Studies and School of Clinical Sciences, Auckland, New Zealand
Objectives: To determine whether the UK Functional Assessment Measure (UK FIM+FAM) fits the Rasch model in stroke patients with complex disability and, if so, to derive a conversion table of Rasch-transformed interval level scores.
Methods: The sample included a UK multicentre cohort of 1,318 patients admitted for specialist rehabilitation following a stroke. Rasch analysis was conducted for the 30-item scale including 3 domains of items measuring physical, communication and psychosocial functions. The fit of items to the Rasch model was examined using 3 different analytical approaches referred to as ”pathways”.
Results: The best fit was achieved in the pathway where responses from motor, communication and psychosocial domains were summarized into 3 super-items and where some items were split because of differential item functioning (DIF) relative to left and right hemisphere location (χ2 (10) = 14.48, p = 0.15). Re-scoring of items showing disordered thresholds did not significantly improve the overall model fit.
Conclusion: The UK FIM+FAM with domain super-items satisfies expectations of the unidimensional Rasch model without the need for re-scoring. A conversion table was produced to convert the total scale scores into interval-level data based on person estimates of the Rasch model. The clinical benefits of interval-transformed scores require further evaluation.
Key words: patient; physiopathology; psychometrics; Rasch; functional assessment.
Accepted Jan 12, 2018; Epub ahead of print Feb 28, 2018
J Rehabil Med 2018; 50: 00–00
Correspondence address: Oleg Medvedev, Centre for Medical and Health Sciences Education, School of Medicine, University of Auckland, Rm 12.025, Bldg 599, 2 Park Rd, Grafton, Auckland 1142, New Zealand. E-mail: o.medvedev@auckland.ac.nz
The Functional Independence Measure is one of the most widely used outcome measures for rehabilitation worldwide, comprising 13 ”motor” and 5 ”cognitive” items (1, 2). The Functional Assessment Measure was originally developed in the US as an extension of the FIM in the mid-1990s (3, 4), adding a further 12 items to extend its coverage of cognitive and psychosocial function, for use in patients with more complex disabilities following acquired brain injury. Adapted for use in the UK, the UK FIM+FAM was published in 1999 (5). It consists of a 30-item scale encompassing physical, cognitive, communicative and psychosocial function. An optional add-on module addresses extended activities of daily living (6), designed primarily for use in the community. The UK Rehabilitation Outcomes Collaborative (UKROC) provides the national clinical database collating outcomes for all tertiary specialized (Level 1) and local specialist (Level 2) in-patient rehabilitation services in England, and the UK FIM+FAM is now the principal outcome measure within the dataset (7, 8).
The psychometric properties of the 30-item UK FIM+FAM have previously been examined in a general neuro-rehabilitation cohort using exploratory and confirmatory factor analysis (EFA and CFA) and Mokken analysis (a non-parametric technique based on item response theory) (9). These analyses indicated 2 distinct domains: motor (16 items) and cognitive (14 items), the latter dividing into a 5-item communicative and 9-item psychosocial component. This yielded an overall factor structure of 3 subscales (physical, communication and psychosocial), each with a Cronbach’s alpha >0.90 and Cohen’s d effect sizes ranging from 0.86 to 1.29 between admission and discharge. A subsequent EFA and CFA in stroke patients (10) demonstrated the same 3-factor structure accounted for 69% of the total variance and also identified the anticipated score differences related to hemispheric location of the stroke. The scale was considered to be valid, reliable and responsive to changes occurring in this study population, as well as sensitive to differences that resonate with clinical experience. However, psychometric properties of the UK FIM+FAM have not been tested using the Rasch model (11, 12), which is warranted given its distinct advantages over other more traditional psychometric methods (13, 14).
The Rasch model (11 12), is a robust statistical model that has been applied in numerous psychometric studies to examine and enhance the measurement properties of scales at both the group and individual level (13–18). There are more than 50 published studies that explore how well FIM data conform to the Rasch model including the variety of solutions obtained for the FIM scale, which were tested with and without re-ordering of disordered response categories (18). Two previous studies have explored the benefits of Rasch transformation of the original US version of the FIM+FAM in patients following stroke (19) and traumatic brain injury (20). However, as yet there have been no published Rasch analyses of the UK FIM+FAM in any population. The aim of this paper was to assess the psychometric properties of the UK FIM+FAM in stroke patients with complex disability using Rasch methodology and to produce a conversion table to convert ordinal to interval quality data.
Data source. The data source was the UKROC database, which was initially set up by a National Institute for Health Research Programme Grant (7, 8). It is now commissioned by NHS England to provide the national clinical database for specialist inpatient rehabilitation in England. The dataset comprises socio-demographic and clinical data as well as information on rehabilitation needs, inputs and outcomes on admission and discharge from in-patient rehabilitation. Since April 2013, reporting of the full UKROC dataset is a mandated requirement for commissioning of all Level 1 and 2 specialist rehabilitation services. However, reporting was voluntary until that date, so not all services routinely reported UK FIM+FAM data. Within these Level 1/2 services, which have a mean (standard deviation (SD)) length of stay of approximately 80 days (SD 60), the UK FIM+FAM is usually completed for each patient within 10 days of admission and during the last week before discharge to evaluate the functional gains made during the episode of care.
The programme is registered with the NIHR Comprehensive Local Research Network: ID number 6352.
Sampling. We extracted the cohort of all 1318 stroke patients consecutively admitted to the 58 Level 1/2 specialist rehabilitation centres in England that submitted data to the UKROC database between 1 January 2010 and 30 May 2013, for whom a complete UK FIM+FAM score was available at both admission and discharge from the unit.
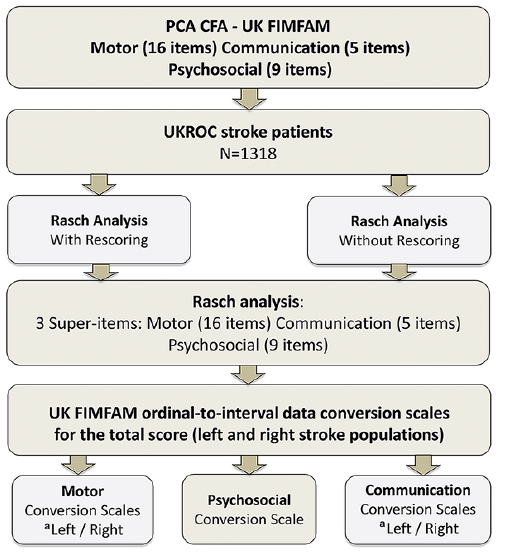
Fig. 1 summarizes the process of extraction and analysis.
Fig. 1. Flow chart of the study extraction and analysis. aLeft/right stroke DIF by stroke location led to different conversion scales for left and right stroke). UKROC: UK Rehabilitation Outcome Collaborative database; UK FIMFAM: UK Functional Independence Measure and Functional Assessment Measure.
Measure. Within the UK FIM+FAM, each of the 30 items is scored on the same 7-point ordinal scale as follows: 1 (Total assistance); 2 (Maximal assistance); 3 (Moderate assistance); 4 (Minimal assistance); 5 (Supervision/set-up); 6 (Independent with device); and 7 (Fully independent). A category of 6 or 7 implies no help from another person, while for categories 1–4 the assessment is based on the amount of help required, e.g. the percentage of task performed by patient. The UKROC software automatically produces a ”FIM+FAM-Splat” or radar chart, presenting a visual impression of change at item level. This may be used to describe change in individual scores, or median scores for a population, in a format that is clinically interpretable by rehabilitation professionals. By way of example, Fig. 2 shows a composite FIM+FAM-Splat for median admission and discharge scores within this dataset.
Summing the item scores gives a total range from 30 to 210, where a maximum score of 210 indicates total independence. The 7-category structure implies, in Rasch terms, that each item has 6 possible thresholds or points between 2 response categories where either response is equally probable (i.e.1–2, 2–3, etc.). The original scores format 1–7 was re-coded into 0–6 format for the purpose of analysis as required by the partial credit Rasch model (18).
Fig. 2. Composite FIM+FAM-splats of the median admission and discharge scores for each item within this dataset. The radar chart (or ”FIM+FAM splat”) provides a graphic representation of the disability profile from the FIM+FAM data. The 30-scale items are arranged as spokes of a wheel. Scoring levels from 1 (total dependence) to 7 (total independence) run from the centre outwards. Thus, a perfect score would be demonstrated as a large circle. These composite radar charts illustrate the median admission and discharge scores within this dataset. The yellow-shaded portion represents the median admission scores and the blue-shaded area represents the difference between median scores on admission and discharge.
There is now an extensive literature providing guidance methodology for Rasch analysis. Lundgren-Nilsson & Tennant (18) have examined specifically the literature applying the Rasch model to the FIMTM describing how the approach has evolved over 2 decades and making recommendations to improve the rigor of future analyses. During this analysis, we followed their suggestions using different analytical strategies referred to as ”pathways” to address issues of local dependence, DIF and disordered thresholds without (if at all possible) removing items to maintain the clinical integrity of the instrument.
Like Lundgren-Nilsson & Tennant and Lundgren-Nilsson et al. (18, 22), we distinguish between local response dependence and local trait dependence (see also in Discussion). Problems due to local response dependence may be dealt with by construction of super-items summarizing item scores from the set of locally dependent items. If the subsequent analysis accepts the distributions of these super-items similar to partial credit items depending on the same latent variable, it may be taken as evidence against local trait dependence, because local trait dependence due to multidimensionality cannot generate super-items (22).
Prior to commencing our analysis we applied item-trait interaction tests (18) in RUMM2030, which indicated that assumptions of the polytomous Rating scale model did not hold and thus supported appropriateness of the unrestricted Partial Credit Model for Rasch analysis (12, 18). Rasch model fit statistics used to determine fit to the Rasch model included the item-trait interaction χ2 (overall and individual items), the DIF test and correlations between response residuals (18). Standard errors of the estimates of person parameters were applied to estimate measurement error. The Person Separation Index (PSI) is a measure of scale reliability and represents a function of the variance of the person parameters and the standard error of measurement. PSI values above 0.7 are required for group use and above 0.8 for individual assessment. A residual correlation above 0.2 with reference to the mean of all residual correlations is considered as an indicator of local dependency (23). The first analytical pathway involved the initial Rasch analysis of all 30 items to assess the overall and individual item fit. The second analytical pathway used ”super-items” to address local dependency issues without re-scoring disordered thresholds. A disordered threshold occurs when people higher in the ability or construct being measured (in this case independence) do not consistently obtain correspondingly higher response options (i.e. 1, 2, 3–7 ) for an item. However, evidence of a disordered threshold can appear for reasons other than the order of the categories. In particular, local response dependence may create evidence of disordered threshold because the dependence distorts the distribution of the separate items. The third analytical pathway involved re-scoring of significantly disordered thresholds for individual items prior to further analysis.
In Rasch analysis, disordered thresholds are corrected by collapsing adjacent response categories. We re-scored items with significantly disordered thresholds by collapsing adjacent categories in a meaningful way (e.g. ”total” and ”maximal assistance”; ”supervision/set-up” and ”modified independence”).
In the subsequent pathways, we tested for item bias across important person factors such as age group (0–44, 45–54, 55–64, 65–74, 75+ years), sex, ethnicity, type of stroke (haemorrhagic, infarct, sub-arachnoid and other), stroke location (left or right hemisphere) and time-point (admission or discharge). Andrich & Hagquist (24) introduced the concept of ”artificial DIF” that may result when real DIF in 1 item favouring 1 group induces artificial DIF favouring the other group in other items. They provided recommendations to deal with DIF issues. We have used these recommendations and, if DIF was found, we resolved it sequentially to differentiate between real and artificial DIF. If uniform DIF for a specific person factor was identified in 1 or more items, the item displaying the strongest DIF effect was split first to allow variation by the corresponding factor and DIF analysis was repeated for other items (24).
As it was desirable to keep the original structure of the UK FIM+FAM scale, item removal was considered only as a last resort to improve the fit. The items at risk of deletion were those exhibiting significant misfit, i.e. excessive item fit-residual values outside ± 2.5 range and a p-value significant at the 0.05 level, with a Bonferroni adjustment for multiple tests.
Unidimensionality was tested using principal components analysis (PCA) of the residuals and the equating t-test. Unidimensionality of the scale is confirmed if significant t-test comparisons do not exceed 5%, or if the lower bound of a binominal confidence interval computed for the number of significant t-tests overlaps the 5% cut-off point (25). We followed the recently published guidelines and recommendations for reporting Rasch analysis (26).
Within our clinical sample of 1,318 cases, the mean age was 58.91 (SD 15.59) years, range 13–100, 29 participants had missing age data. From this sample we extracted a random sample (n = 320) for the purpose of Rasch analysis that displayed comparable demographic characteristics (Table I).
Table I. The UK Rehabilitation Outcomes Collaborative (UKROC): stroke population sample characteristics
Table II presents the overall Rasch model fit statistics for all 3 analytical pathways described above, including the item-trait interaction χ2 and p-values values for the random sample (n =320) and for the full sample (in parentheses). Table III presents the Rasch model results for each individual item, along with the frequency distribution of responses for each of the 7 scoring categories within the 30 items. There are no categories endorsed by less than 20 responses. We identified 15 persons with extreme locations above 4 logits and negative fit residuals below –5 that may significantly affect the estimates (26) and presented data both with and without these 15 extreme scores for comparison.
Table II. The UK Functional Assessment Measure (UK FIM+FAM): Rasch model summary statistics (overall fit of the scale)
Table III. Frequency distribution of responses and Rasch model fit statistics for the UK FIM+FAM items (Pathway 1, Analysis 1B), and domain super-items split by localization without re-scoring (Pathway 2, Analysis 2C), n = 1,318
The initial analysis including all 30 items showed equally good reliability with and without extreme persons (PSI = 0.95–0.96), but misfit at both individual item and the overall level with significant item-trait interaction. Table III shows significant misfit for 18 out of 30 items. At this stage the residual correlation matrix was examined and it displayed local dependencies between 3 groups of items that mirrored our previously reported results of factor analysis (9, 10), i.e. Motor (16 items), Communication (5 items) and Psychosocial (9 items) function). For the next stage of the analysis, the 30 items were combined into 3 super-items representing motor, communication and psychosocial function.
Pathway 2A. Table II shows that super-items analysis without re-scoring produced satisfactory overall model fit with and without extremes in the random sample (n = 320). Even though, χ2 values were relatively small in the full sample, p-values indicated errors that were not observed in the random sample of sufficient size. Unidimensionality was confirmed in the full sample with only 1.21% of t-tests significant (see Table II). However, reliability of analysis 2B with extreme persons was below the acceptable level. DIF analysis indicated significant uniform DIF for the Motor (F(1,1301)=93.05, p < 0.001) and Communication subtests (F(1,1301)=353.25, p < 0.001) by stroke localization without extremes that was then replicated with extremes included in the sample, but no other DIF was identified (Fig. 3).
Fig. 3. Item characteristic curves (ICC) with uniform DIF by localization for the motor super-item (top panel) and communication super-item (bottom panel). Analysis 2A without extremes.
Pathway 2C and D. Communication super-item was split for DIF by localization first because it showed stronger uniform DIF effect. This did not resolve DIF in the motor super-item suggesting real DIF by localization. Therefore, motor super-item was also split for DIF by localization. When the motor and communication subtests were split by localization (left/right) to control for DIF, this produced the best model fit with and an improved PSI of 0.80 (Table II). At this stage, the scale was strictly unidimensional and there were no locally dependent or significantly misfitting super-items identified (Table II and III, Pathway 2, Analysis 2C). This analysis was replicated with extreme persons, resulting in equally good fit but lower reliability (PSI = 0.76).
Pathway 3A and B. Applying the third analytical pathway (with re-scoring), significantly disordered thresholds were identified in 15 out of 30 items. Table III indicates the items with significantly disordered thresholds. Notably, of the 15 items with disordered thresholds only 3 items (number 8 (Bed transfers), number 9 (Toilet transfers), and number 20 (Writing)) are misfitting. All 15 items with disordered thresholds were re-scored before the analysis continued. After re-scoring, the items showed similar patterns of local dependency and were combined into motor, communication and psychosocial subtests. The resultant fit indices were comparable to those achieved without re-scoring in both the analyses with and without extremes, but the reliability was higher in the analysis with extremes when disordered items were re-scored. However, local dependency between the 2 super-items communication and psychosocial that exceeded the accepted cut-off point of 0.2 was identified. An attempt to combine these super-items into 1 single super-item resulted in a decrease in reliability (PSI = 0.71), below that which was desirable for individual assessment.
Fig. 4 presents the item-person threshold distributions of the best solution without re-scoring (Analysis 2C). It can be seen that abilities of the sample are fairly well targeted by item thresholds without any significant ceiling or floor effects, and person distribution is close to a normal distribution. Therefore, the scale version without re-scoring that achieved the best model fit (Analysis 2C) was used to generate ordinal-to-interval conversion tables. Standard errors of measurement for raw scores of 50, 100, 150, and 175 (left stroke) were 4.47, 2.95, 3.21 and 3.39, respectively, and similarly small values were estimated for right hemisphere stroke patients. Table IV contains ordinal-to-interval conversion scores estimated from the analysis without re-scoring disordered thresholds and not including extreme persons.
Fig. 4. Person-item threshold distributions for the final solution without re-scoring (top panel) and with re-scoring (bottom panel) for the left and right stroke populations.
Table IV. The UK FIM+FAM conversion scale: the raw scores and corresponding Rasch interval scores accounting for left and right strokes differential item functioning
The left and right location scales were strongly correlated (r = 0.99, p < 0.001), but paired t-test comparisons demonstrated significant differences between the 2 scales (t(180) = –4.22; p < 0.001). A scatter plot (Fig. 5), however, shows that the differences between left and right scores is actually very small (see discussion).
Fig. 5. Scatter plot of Rasch interval-level scores (y-axis) as a function of ordinal scale scores (x-axis).
The study presented here represents the first Rasch analysis of the UK FIM+FAM, which is the primary outcome measure within the UKROC national clinical dataset for all specialist rehabilitation services in the UK treating patients with complex disabilities.
The best fit to the Rasch measurement model was achieved when 3 groups of locally-dependent items were treated as super-items, which provides strong evidence of unidimensionality for the UK FIM+FAM. Preliminary results of factor analysis (9, 10) indicated that 3 domains Motor, Communication and Psychosocial represent different factors because items of each domain share common variance. However, shared variance may be evident for 2 different reasons: multidimensionality due to ”trait dependence” (i.e. the tool genuinely measures different constructs), or ”response dependence”, where the response to 1 item influences responses to other related items (18). Multidimensional measures representing different traits typically fail to fit the strict criteria of the unidimensional Rasch model, which complies with the principles of fundamental measurement formulated by Thurstone (31), such as unidimensionality, sample invariance and a consistent unit of measurement across the scale continuum. The findings from this analysis indicate that the UK FIM+FAM satisfies the Rasch model without the need to re-score disordered thresholds in a random sample of stroke patients. This allowed for a very simple conversion from raw scores to an interval metric for the whole scale.
Two previous studies have explored Rasch analysis of the original US version (USFIM+FAM), using the WINSTEPS software (19, 20):
These early studies reported the goodness of overall and individual item fit to the Rasch model, but typically went little further. They frequently relied on deleting items to attain satisfactory fit and rarely provided a table to permit the conversion of raw scores to interval level scores in routine clinical practice. A major methodological strength of our study is that we were able to draw upon 21 years of experience in Rasch studies on the FIM, following the methodology described by Lundgren-Nilsson & Tennant and Lundgren-Nilsson et al. (18, 22) to explore how well the UK FIM+FAM fits the Rasch model according to more current analytical techniques. We used a range of steps including the formation of super-items to eliminate local dependency among items to achieve reasonably good fit for the 3 dimensions underpinning the UK FIM+FAM. Importantly, we have recognized the difference between local response dependence and local trait dependence and calculated super-items to address the dependence among items. We were able to do this without deleting any items and also to produce a conversion table for left and right hemisphere strokes, to account for differential item functioning between these 2 groups.
First, it is clinically expected that a left hemisphere stroke is generally less associated with motor impairments compared with right hemisphere strokes, which is consistent with our uniform DIF-findings for the motor super-item. On the other hand, left hemisphere strokes are more frequently linked to impairments in communication compared with the right hemisphere that is again consistent with our results for the Communication super-item. The DIF split does not affect the validity of the measure as evidenced by a strong correlation between conversion interval scores for left and right stroke population and reflected by the scatterplot (Fig. 5), the actual difference is very small and unlikely to be clinically important.
The chief advantage of measures that conform to the Rasch model is that their data can be analysed with parametric statistics rather than relying on non-parametric statistics lending greater statistical power and precision. Whilst the use of interval level scales has some clear advantages for the generation of robust metrics for the purpose of research, further work is necessary to explore the impact and benefits of transformed scores in the clinical setting. We recognize that, despite the many conversion tables that have been produced for the FIM in different contexts (17), the uptake of these by clinicians has been limited because the ordinal scores within each item are interpretable at a clinical level and are widely used as an aid to clinical reporting and decision-making. The FAM splat is particularly valued by UK clinicians in this context, and for this reason we would not necessarily recommend using transformed scores at the individual item level, although they may nevertheless prove valuable when presenting summed items in subscale and total scores, particularly if the transformed data prove to be more sensitive (16). However, Fig. 5 demonstrates that the interval level is markedly ”flat” in the middle part of the scale, changing by just 40 points (100–140) while the ordinal scale changes by 157 points (40–197). As demonstrated by the FAM splat, this is the part of the scale in which the majority of patients are likely to show change. Thus, while the interval scale may provide more reliable measurement at a statistical level, it may not be responsive to clinical change. The benefits of transformed scores therefore require further evaluation in clinical practice.
The authors also recognize a number of methodological limitations to this study.
In conclusion, our analysis suggests that the UK FIM+FAM meets the Rasch model requirements with good reliability, acceptable targeting of each of the 3 domains, and with no item deletion in a population of complex stroke patients. A conversion table that accommodates DIF by stroke location has been produced, but this now requires further evaluation in clinical practice and in research.
The authors would like thank all of the patients and clinicians who contributed to the UKROC dataset. Special thanks to Alan Tennant and Paula Kersten for their advice and guidance in the early stages of this analysis; to Heather Williams and Keith Sephton for their assistance with data extraction and cleaning; and to Roxana Vanderstay for her initial exploration of Rasch analysis in this programme. The authors would also like to thank Professor Svend Kreiner for his constructive review and advice on improving the manuscript.
This study was funded by the National Institute for Health Research (NIHR) under its Programme Grants for Applied Research Programme (RP-PG-0407-10185). Financial support for the preparation of this manuscript was also provided by the Dunhill Medical Trust.
The authors have no conflicts of interest to declare.


 Click to show fullsize
 Click to show fullsize
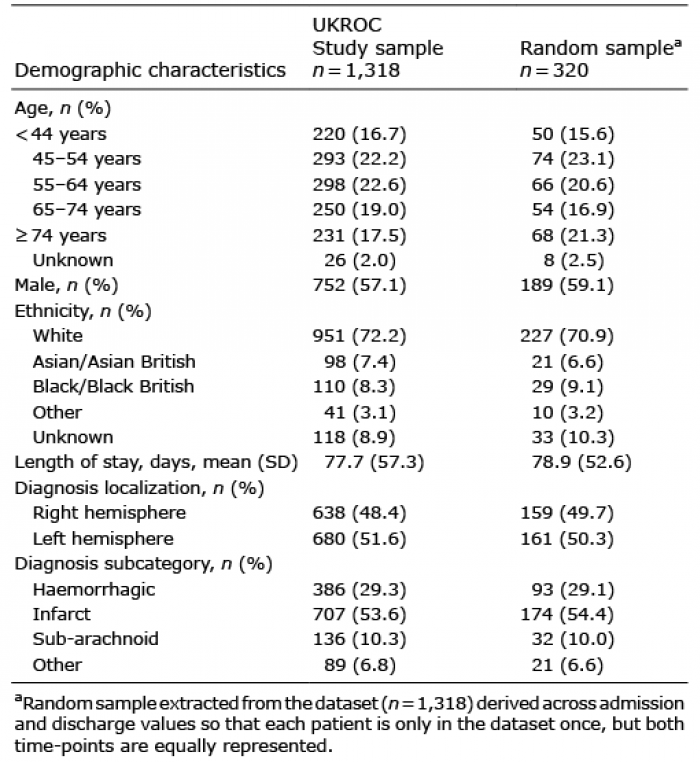 Click to show fullsize
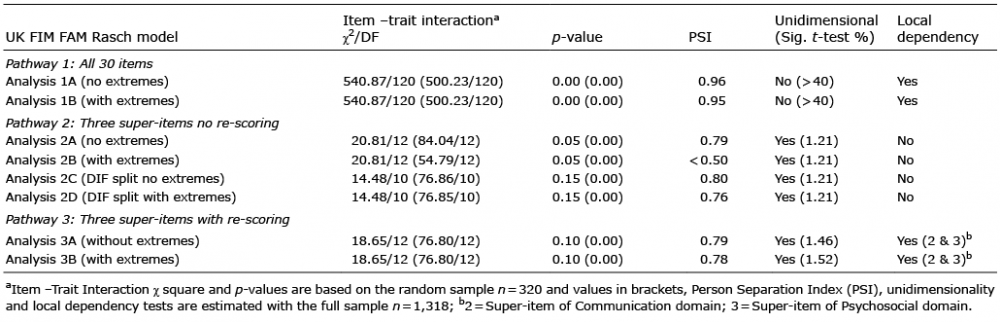 Click to show fullsize
 Click to show fullsize
 Click to show fullsize
 Click to show fullsize
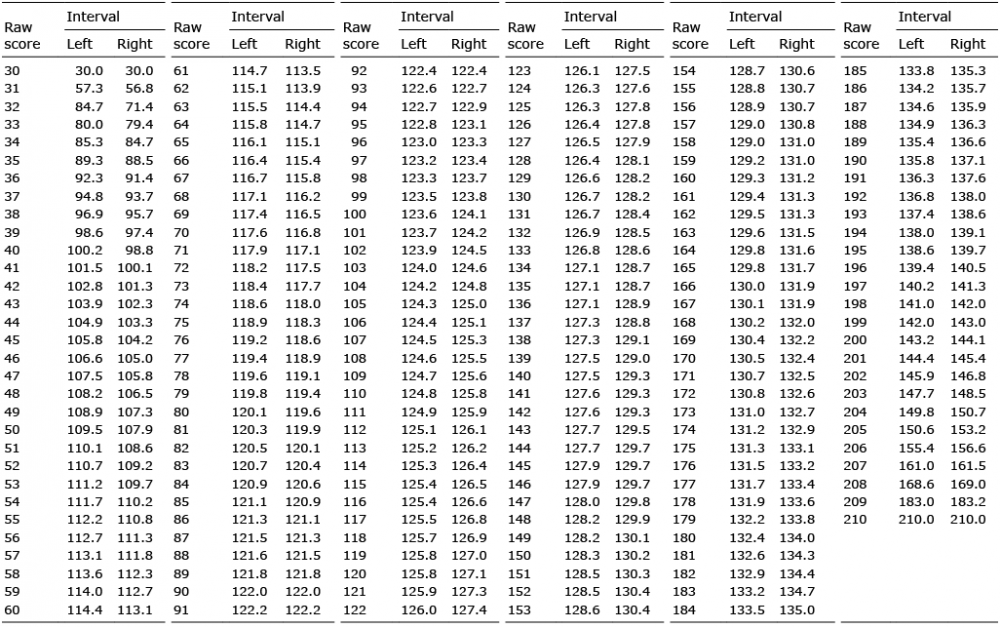 Click to show fullsize
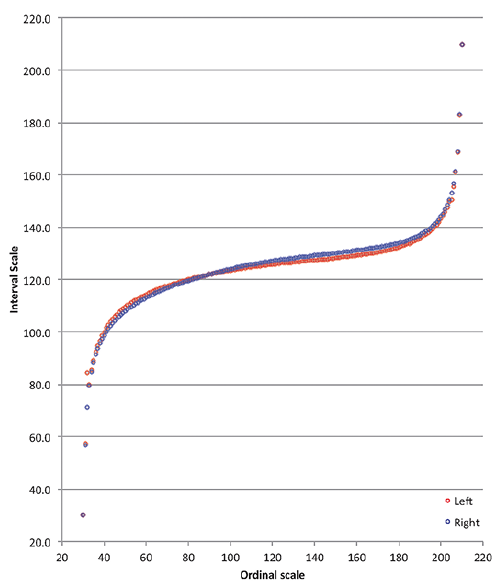 Click to show fullsize