
From the 1Research Group Lifestyle and Health, Utrecht University of Applied Sciences, Utrecht, 2Move Research Institute Amsterdam, Department of Human Movement Sciences, Vrije Universiteit Amsterdam, Amsterdam, The Netherlands, 3Department of Orthopedics, First Affiliated Hospital of Fujian Medical University, Fuzhou, Fujian, China and 4Revant Rehabilitation Center Breda, Breda, The Netherlands
Objective: This exploratory study investigated to what extent gait characteristics and clinical physical therapy assessments predict falls in chronic stroke survivors.
Design: Prospective study.
Subjects: Chronic fall-prone and non-fall-prone stroke survivors.
Methods: Steady-state gait characteristics were collected from 40 participants while walking on a treadmill with motion capture of spatio-temporal, variability, and stability measures. An accelerometer was used to collect daily-life gait characteristics during 7 days. Six physical and psychological assessments were administered. Fall events were determined using a “fall calendar” and monthly phone calls over a 6-month period. After data reduction through principal component analysis, the predictive capacity of each method was determined by logistic regression.
Results: Thirty-eight percent of the participants were classified as fallers. Laboratory-based and daily-life gait characteristics predicted falls acceptably well, with an area under the curve of, 0.73 and 0.72, respectively, while fall predictions from clinical assessments were limited (0.64).
Conclusion: Independent of the type of gait assessment, qualitative gait characteristics are better fall predictors than clinical assessments. Clinicians should therefore consider gait analyses as an alternative for identifying fall-prone stroke survivors.
Key words: prospective falls; cerebrovascular accident; stroke; gait; fall prediction; accelerometry.
Accepted Apr 6, 2017; Epub ahead of print May 5, 2017
J Rehabil Med 2017; 49: 402–409
Correspondence address: Michiel Punt, Bolognalaan 101, NL-3584 JW Utrecht, The Netherlands. E-mail: Michiel.punt@hu.nl
Falls are common among chronic stroke survivors (1, 2) and can lead to injuries (3, 4). Predicting falls may help in assigning stroke survivors to fall prevention interventions, and may aid in the development of tailored fall prevention. Clinically, physical performance tests have been used to assess fall risk in stroke survivors (5–8). While some studies have reported that these tests were associated with falls (7, 8) other studies did not confirm such an association (5, 9). In addition, several studies attempted to predict falls based on psychological factors, such as depression (2, 5). Again, some studies did (2), while others did not (5), find an association between depression and falls in stroke survivors. Since most falls occur during dynamic activities, such as walking or transfers (1, 5), and current fall risk assessments lack consistency, it has been suggested to explore gait characteristics in relation to fall risk in stroke survivors (10).
Interestingly, in healthy older adults several studies were successful in predicting falls by estimating gait characteristics in a laboratory setting (11, 12). In addition, several studies were able to predict falls based on gait characteristics determined from daily-life accelerometry (13, 14). Despite the different approaches in estimating gait characteristics, both methods demonstrated that gait characteristics, such as gait speed (12), variability in gait (11, 13) and local divergence exponents (LDE) (11, 13) of gait kinematics predict falls in healthy older adults.
Gait characteristics in stroke survivors differ from those in healthy older adults. For instance, gait speed is reduced, and gait is more asymmetrical (15) in stroke survivors. Nevertheless, gait characteristics of stroke survivors have also been shown to predict falls (16). Moreover, with regard to gait stability, it has been shown that the local divergence exponent (LDE) was larger in stroke survivors than in age-matched healthy peers (17), indicating less stable gait. Still, stroke survivors had equal margins of stability (MoS) (17) probably accomplished by a larger step width (18). Although there are profound differences in gait between stroke survivors and healthy older adults, a recent study indicated that the same gait characteristics measured in daily-life are related with fall history in stroke survivors (19). However, this study also found that several gait characteristics had different associations with fall history than in healthy older adults (19).
It is currently unknown whether gait characteristics yield better fall predictions than current clinical assessments in stroke survivors. It is also not known which method of gait characteristic estimation, i.e. from daily-life or laboratory measurements, yields the most meaningful information regarding fall predictions, or whether these 2 methods are even complementary in this regard. Therefore, the aim of this exploratory study was 2-fold. Firstly, we examined whether gait characteristics predict fall incidences in chronic stroke survivors better than current clinical assessments. Secondly, we examined how well both gait characteristic estimation methods predict falls and if a combination of both gait characteristic estimations yield better predictions of falls.
Stroke survivors were recruited via flyers in hospitals, general practitioners and physical therapy practices and through various national peer-group meetings in the Netherlands. Inclusion criteria were: patients with self-reported stroke who were at least 6 months post-stroke, were living independently in the community, and were older than 18 years. Exclusion criteria were: stroke survivors who were institutionalized in, for instance, a nursing home, if they had a functional ambulation category (FAC) of 2 or less (20), a Mini-Mental State Examination (MMSE) of 24 or lower (21) and or severe cardiovascular, respiratory, musculoskeletal or neurological disorder other than stroke that affected gait performance. The research protocol (NL49126.028.14) was approved by the medical ethics committees of “Noord Brabant”, The Netherlands. All participants signed informed consent prior to testing, and treatment of the participants was according to Good Clinical Practice.
Twenty-four hours prior to clinical and laboratory testing, participants were asked not to drink any alcoholic beverages and to avoid any other activities that could affect physical and psychological performance during testing. All measurements were performed during a single visit to the rehabilitation centre Revant, Breda, the Netherlands. Depending on the number and length of the breaks that a participant needed, the measurement protocol took from 2 to 3.5 h. Demographic and stroke-specific characteristics were obtained including: sex, age, body length and weight, time since stroke, hemiparetic side, daily use of a walking aid for inside and/or outside use and use of prescribed medication.
Participants were asked to perform several physical performance assessments and questionnaires commonly used in rehabilitation practice. First, over -ground preferred gait speed was assessed with a 10-m walk test (10MWT, performed twice and mean was calculated) (22). Secondly, the ability to make a transfer was measured (in s) by the Timed Up and Go (TUG) test (23), the test was repeated 3 times and mean was calculated. Thirdly, static and dynamic balance was measured with the 14-item Berg Balance Scale (BBS) (24). In addition, the 30-item Yesavage Geriatric Depression Scale (GDS) (25), the Fall Efficacy Scale (FES) (26) and the Longitudinal Aging Study Amsterdam questionnaire (LASA, a questionnaire aimed to identify subgroups with highest fall risk) (27) were administered. See Table II for an overview of all physical and psychological assessments.
Laboratory-based gait analysis was conducted using a Gait Real-time Analysis Interactive Lab (GRAIL; Motekforce Link bv, Amsterdam, the Netherlands). The GRAIL consists of a dual-belt treadmill with 2 embedded force platforms (Motekforce Link b.v.), a motion-capture system (Vicon, Vicon Motion Systems, Oxford, UK) with 10 infrared cameras (Bonita B10, Vicon Motion Systems) and synchronized virtual environments. Time series of ground reaction forces were sampled at 1,000 samples/s and the infrared cameras were sampled, synchronized at a frame rate of 100 samples/s, both using Vicon Nexus Software 1.8.5. The GRAIL was controlled by a custom-designed application in D-flow (Motekforce Link b.v.).
Each participant wore black, tight-fitting, clothes provided by the researcher and any jewellery was removed. Forty-seven reflective passive markers (15 mm) (28) were placed on anatomical points. Markers were placed by the same investigator to maximize consistency between participants.
During treadmill testing, participants wore a safety harness at all times. This harness was attached to the ceiling and prevented falls, while participants were still able to move freely on the treadmill. Participants walked without the use of a walking aid, except for an ankle-foot orthosis or orthopaedic shoes. After familiarization with the treadmill steady state, gait characteristics were obtained at preferred gait speed. Preferred gait speed was determined by slowly increasing the treadmill speed until the participant reported a comfortable gait speed. If necessary, participants were allowed to hold on to the handrail for the first minute. As soon as handrail support was no longer needed and participants were familiarized with the treadmill, data recording started. A minimum of 60 consecutive strides was recorded and used for further analysis.
The gait data were recorded in Vicon Nexus and transferred to Matlab 2013B (The MathWorks Inc., Natick, MA, USA) to extract gait characteristics. The gait events foot contact (FC) and foot off (FO) were determined using the centre of pressure (CoP) (29). Briefly, force-plate data were first converted to centre-of-pressure data, i.e. time series of the point of application of the resultant ground reaction force, which shows a characteristic butterfly pattern over time. FC and FO were then detected from this profile using peak detection. The left and right upper angles of the butterfly corresponded with right and left FO respectively and the left and right lower angles of the butterfly corresponded with the left and right FC.
All steady-state gait characteristics during preferred gait speed were determined over 60 consecutive strides. Spatio-temporal gait characteristics included gait speed, stride time, step width, paretic and non-paretic step length, and step time.
Spatio-temporal gait symmetry index (SI) was determined based on difference in step length and step time between paretic and non-paretic limb using equation 1.
where PL is the step length/time of the paretic limb and NPL is the step length/time of the non-paretic limb, determined and averaged over i till n strides. An SI deviating from 1 reflects a more asymmetrical gait.
Gait smoothness was based on the velocity time series of the 3 averaged sacrum markers. Subsequently, the index of harmonicity (IH) was determined by dividing the power of the spectral analysis of the ground frequency by the power of the sum of the first 6 harmonics (30). Variability of gait was determined by calculating the standard deviation (SD) of stride time and of step time and step length for the paretic and non-paretic limb separately.
Two types of gait stability characteristics were determined. First, local dynamic stability, expressed as the local divergence exponent (LDE) was calculated from the velocity time series of the averaged 3 sacrum markers. Time series were time normalized towards, on average, 100 samples per stride, so that time-normalized time-series had a length of 6,000 samples. Each time-normalized time series was reconstructed in a 5 dimensional state space by using a fixed delay of 10 samples. See for a more detailed explanation Bruijn et al. (31). Finally, the maximum local divergence exponent was determined for the rate of divergence from 0–1 step (31). Second margins of stability (MoS) were estimated by estimating the centre of mass (CoM) using a 14-body segment model (32). In short, CoM location and mass of each segment were estimated based on sex and body segment circumferences as well as length of the segments (32). The extrapolated centre of mass (XCoM) was determined by the CoM plus the velocity of the centre of mass times the Eigenfrequency of a pendulum with limb length as length (33). To determine the MoS in both medio-lateral (ML) and anterior-posterior (AP) directions, the marker position of the lateral malleolus in ML and the toe marker in AP direction at FC were subtracted from the XCoM in ML and AP direction respectively. See Table III for an overview of steady-state gait characteristics.
The day after the laboratory tests, all participants started wearing a tri-axial accelerometer (McRoberts, The Hague, the Netherlands) for a period of 7 consecutive days. The accelerometer was located at the lower back so as to collect information from both limbs. Previous studies have clearly indicated that this location provides valuable information regarding fall risk (13, 14). The accelerometer measured at a sample rate of 100 samples/s and was aligned in the vertical (VT), ML and AP direction. The data were analysed with a gait recognition algorithm (34). The algorithm searched each second for gait activity with a minimum length of 8 s or a multiple of 8 s. Gait characteristics were estimated for each 8-s walking bout, longer walking bouts were subdivided into multiple 8-s parts. Subsequently for each characteristic the median value of all bouts was taken to reduce the influence of outliers, further data analysis was similar to earlier studies by our research group (13). We determined daily life gait characteristics that have been shown to be promising in regard to predicting falls in healthy older adults (13) and or in stroke survivors (19). See Table IV for an overview of the daily-life gait characteristics.
Falls were determined prospectively using a “fall calendar” and monthly telephone calls over a 6-month period, which is sufficiently long to identify recurrent fallers (7). Participants were asked to report any falls and related (medical) consequences and circumstances on the calendar. During the monthly telephone calls the researcher decided whether reported falls matched the following definition: “any unanticipated event that results in participants coming to the ground, floor or lower level” (35). We excluded falls that had a clearly different cause than a loss of balance, such as fainting or an epileptic seizure.
Participants who experienced no falls during the 6-month follow-up were classified as non-fall-prone stroke survivors (NF), the participants who experienced at least one fall were classified as fall-prone stroke survivors (F). For each variable in both groups mean and SDs were determined. We used an independent sample t-test or Mann-Whitney or χ2 test to examine differences in participant demographics.
Fall status (NF/F) was used as independent variable in our logistic regression models, gait characteristics and clinical measures were used as independent variables. To facilitate comparison of the results of univariate logistic regressions between variables, we first z-transformed all continuous variables. Subsequently, to determine the predictive capacity of clinical assessments and gait characteristics, univariate logistic regression was performed for each potential predictor variable. The resulting odds ratio (OR) for each independent variable represents the increased fall risk per unit SD increase. ORs higher than one indicate an increased fall risk.
We created 4 fall-prediction models, which were based on: (i) clinical physical and psychological assessments; (ii) laboratory-derived steady-state gait characteristics; (iii) accelerometry derived daily-life gait characteristics; and (iv) accelerometry and laboratory derived gait characteristics.
To reduce the number of independent variables and avoid the risk of multicollinearity we created new latent variables by performing a principal component analyses (PCA). PCA reduces high dimensional data to new uncorrelated latent variables (PCs) such that variance explained by the PCs is maximized (36). PCs were entered in the logistic regression if the PC discriminated between both groups with a p-value ≤ 0.05 based on an independent sample t-test. All independent variables that were significantly associated with fall risk were per prediction model entered into the PCA and loading factors per independent variable and per model for PC1 are reported. We conducted the PCA and the logistic regression modelling within a 10-fold cross-validation method, thereby taking into account the variability caused by performing the component analysis on different training sets on the robustness of the final model. The loading factor of each independent variable on the first principal component was averaged over the 10 folds. Validated model performances are reflected by the error rate (1- accuracy), sensitivity, specificity and the area under the receiver operating curve (AUC). Prediction models were compared by determining the confidence intervals (CI) off the AUC using a previous described method (37).
All statistical analyses were performed using Matlab 2013B (The MathWorks Inc.). Statistical significance was established a priori at a level of p-value ≤ 0.05. As this is an explorative study aimed at discovering the most promising fall prediction models, we did not correct for multiple comparisons.
A total of 47 stroke survivors participated in the study. After testing 5 participants were excluded due to their inability to walk without the use of the handrail during the laboratory gait assessment. One participant was excluded from the analysis due to a technical failure of the accelerometer and one participant refused to wear the accelerometer. To avoid potential bias of having different participants for different independent variables, only the 40 stroke survivors that performed all tests were included in all further analyses. During 6 months follow-up, 15 (38%) stroke survivors experienced at least one fall and were classified as fall-prone stroke survivors (F). All reported falls were due to a loss of balance, no falls were excluded. The remaining 25 (62%) stroke survivors were classified as not-fall-prone stroke survivors (NF). Between-group demographics and stroke-specific characteristics results are presented in Table I. χ2 test revealed a statistically significant difference in using a walking aid, where a greater percentage of the F used a walking aid.
Table I. Demographic and stroke-specific characteristics
For clinical assessments, laboratory-based steady-state gait characteristics and daily-life gait characteristics means and SDs are reported per group, respectively, in Tables II, III and IV. In addition, predictive capacity of each independent variable, expressed as odds ratio (OR) determined by univariate logistic regression, is reported in Tables II, III and IV.
Table II. Clinical assessments: physical performance and psychological tests
Table III. Laboratory-based steady-state gait characteristics
Table IV. Daily life gait characteristics
Of the clinical assessments, LASA was able to predict falls as indicated by a significant OR (Table II). Of the laboratory-based steady-state gait characteristics, smaller step length for the paretic and non-paretic limb, lower preferred gait speed and lower gait smoothness (IH) in VT and AP direction increased the odds of becoming a faller (Table III). Furthermore, a larger stride time variability and step length variability of the paretic limb increased the odds of becoming a faller. A larger LDE, indicating a lower local dynamic stability, and smaller MoS in AP direction increased the odds of becoming a faller. Several daily-life gait characteristics were significantly associated with falls. A lower gait speed, smaller SD in VT and AP direction of the acceleration signal and lower harmonic ratio (HR) in AP direction increased the odds of becoming a faller. Furthermore, a larger IH in ML direction and a larger amplitude of the power of the dominant peak in the ML direction increased the odds of becoming a faller (Table IV).
Independent sample t-tests revealed that, for all 4 created fall prediction models, only PC1 was significantly different between groups. The explained variance by PC1 ranged from 53.8% for model 4 up to 71.1% explained variance for model 2. The loading factors of all independent variables on PC1 for models 2, 3 and 4 are presented in Fig. 1. Fall predictions ability for all 4 models are presented in Table V. Model 1, based on clinical assessments, yielded a limited ability in predicting falls, with an AUC of 0.64 and a lower CI below 0.5. Prediction models 2, 3 and 4, based on respectively laboratory-based steady-state gait characteristics, daily-life gait characteristics and a combination of both gait assessment methods, were able to predict falls, with AUC ranging between 0.72 and 0.73 and a lower CI above 0.5.
Fig. 1. Loading factors for prediction models 2, 3 and 4. SL: step length; PL: paretic limb; NPL: non-paretic limb; IH: index of harmonicity; ST: stride time; var: variability; LDE: local divergence exponent; MoS FW: forward margin of stability; SD: standard deviation; HR: harmonic ratio; Amp.: amplitude.
Table V. Model performances
The main objective of the current study was to examine whether gait characteristics might improve fall predictions over current clinical assessments. We used 2 common methods of assessing gait characteristics, namely a standardized laboratory gait assessment and a daily-life gait assessment. In addition, we examined whether a combination of both methods yielded better predictions.
Of the clinical assessments tests, neither the physical performance tests nor the questionnaires were able to predict falls. The exception being the LASA questionnaire, which did predict falls (27), which might be explained by the fact that LASA includes retrospective fall history in the final sum score while the other tests did not. Our results for the clinical assessments are in line with several other studies (5, 9) but not all (2, 7, 8).
Our results for model 2 show that laboratory-based steady-state gait characteristics can predict falls, as was expected based on studies in healthy older adults (11). Daily-life gait characteristics (model 3) predicted prospective falls as well as laboratory-based characteristics, which is also in line with earlier results in healthy older adults (13) and stroke survivors (19).
Furthermore, despite a different methodological approach, both gait assessment methods (model 2 and model 3) were equally well able to discriminate between NF and F. Apparently, the disadvantages of daily-life gait assessment, such as more vulnerability to environmental circumstances and walking behaviour, are compensated by a longer assessment time, and/or the more ecologically valid data. A combination of laboratory and daily-life gait assessments (model 4) did not result in a significantly more accurate fall prediction model. Therefore, to identify fall-prone stroke survivors, one can choose between both gait assessment methods. Moreover, both gait assessments methods were able to predict prospective falls (lower CI above 0.5), while prediction performances by the conventional clinical assessments was limited in predicting falls (lower CI below 0.5). Thus, gait assessment can be considered as a better alternative to identify stroke survivors at risk for falling. In addition, to the best of our knowledge, this was the first study comparing clinical assessments and gait characteristics in the same sample of participants, which is the most objective comparison. For practical relevance, it is important to note that the gait characteristics significantly associated with falls are determined with just 4 markers located on the pelvic and one marker on each foot, rather than the 47 markers used in this experiment. Moreover, wearing the accelerometer was considered as a relatively easy task by the participants, making both methods applicable for practical use. Furthermore, considering the increasing availability of sensors in, for instance, smart-phones and thereby relatively low costs of applying such analysis it is worth further investigation.
While we expected to find gait characteristics that were associated with falls (11, 14), at present it was unknown to what extent the margins of stability (MoS) in the ML direction were associated with falls in stroke survivors. Although maintaining MoS in ML direction is critical with respect to maintaining gait stability (33) and is therefore essential in fall prevention during gait, no differences were found between groups. This supports the finding that stroke survivors are able to maintain MoS in ML direction (17, 38), probably accomplished by increasing the step width (18, 38). While MoS may not be an interesting gait characteristic for identifying F during steady-state gait, perhaps this may be different when gait is perturbed and an adequate reaction is required in order to maintain the MoS.
The inclusion and exclusion criteria were aimed at including all ambulatory walkers who had had a stroke. Of the participants that met our inclusion criteria, 5 participants were not able to perform the steady-state gait assessment without the use of the handrail and were excluded from our analysis. Therefore, our sample of stroke survivors is, to some extent, biased towards the higher functioning stroke survivors and will not reflect all ambulatory walking stroke survivors.
Fall incidences were captured over a 6-month period. Although 6 months appear to be sufficient to identify recurrent fallers (7), the extent to which seasonal influences have affected fall incidences is unknown, and could have affected our classification of groups.
Our sample of stroke survivors was relatively small, which may have affected the stability of our PCA, especially for model 4, containing 16 gait characteristics. On the other hand, PCA was part of our cross-validation procedure and error rates between models 2, 3 and 4 are similar, indicating similar stable PC determinations in model 4 as in models 2 and 3. Nevertheless, the present findings need replication in larger cohorts. Also, due to the explorative nature of the study, we did not apply a correction for multiple comparison, which increases the chance of a type 1 error.
We explored the value of gait characteristics relative to clinical assessments with respect to fall predictions. Our method covered a range of different commonly used (39) assessments; however, not all commonly used clinical assessments were explored and thus our conclusion is restricted to the examined assessments. Several other assessments, such as: the Barthel Index, the Postural Assessment Scale for Stroke Patients, Functional Reach Test and the balance subscale of Fugl-Meyer Assessment are highly correlated with the BBS that we used (39) and as such probably have limited added value over the BBS in regard to fall prediction. Finally, it should be noted that LASA was developed with a general older population, not specifically for stroke survivors, although having a stroke was not an exclusion criteria of LASA.
This explorative study indicates that both laboratory-based, as well as daily-life gait characteristics, showed some ability to predict prospective falls in higher functioning chronic stroke survivors, whereas clinical assessments, such as physical and psychological assessments, were more limited in predicting falls. Therefore, further investigation of gait assessment over clinical tests is justifiable, as clinicians might enhance currently used fall prediction assessments in ambulatory chronic stroke survivors by applying one of both tested gait assessments.
The authors would like to thank Sanne Roeles and Johannes Gijsbers from Motekforce Link b.v. Amsterdam, the Netherlands for their technical support and application development.
Financial support: Michiel Punt was supported by a grant from the Netherlands organization for Scientific Research (NWO #023-003-141). Sjoerd M. Bruijn was supported by a grant from the Netherlands Organization for Scientific Research (NWO #451-12-041).
The authors declare no conflicts of interest.


 Click to show fullsize
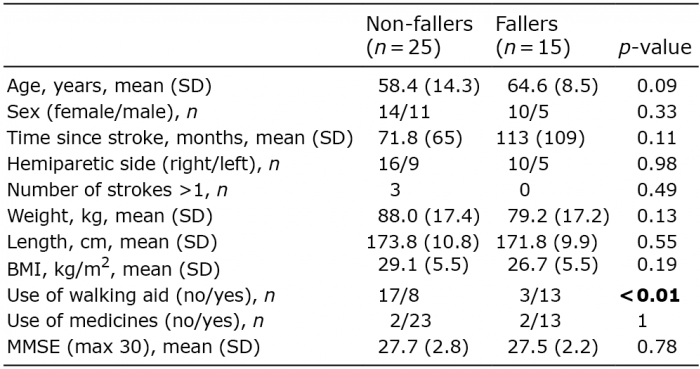 Click to show fullsize
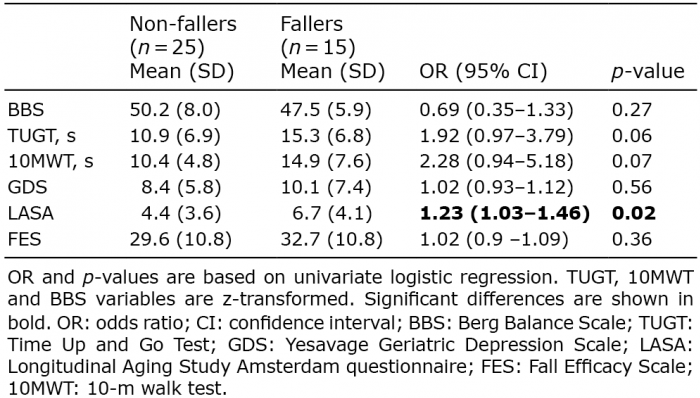 Click to show fullsize
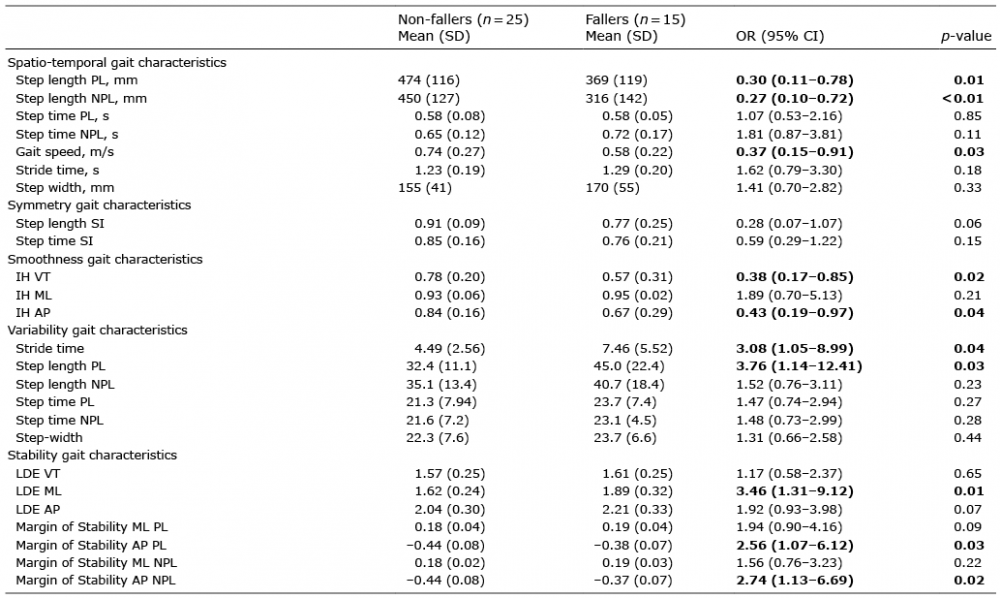 Click to show fullsize
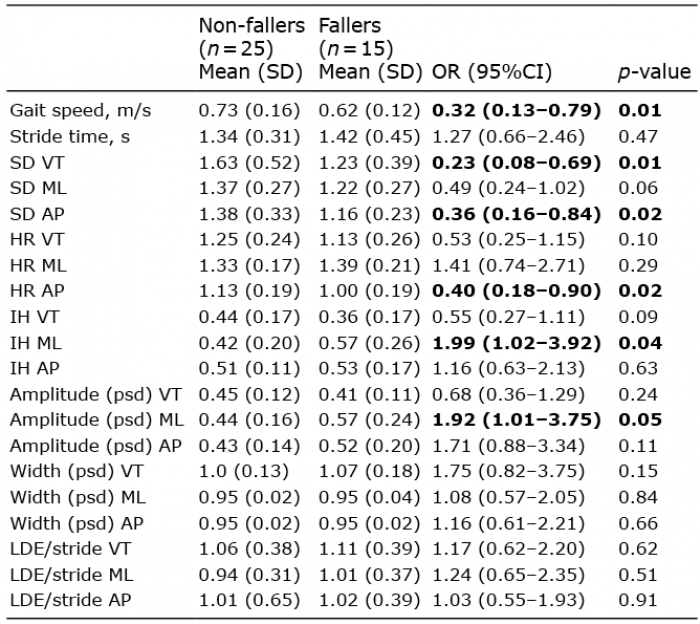 Click to show fullsize
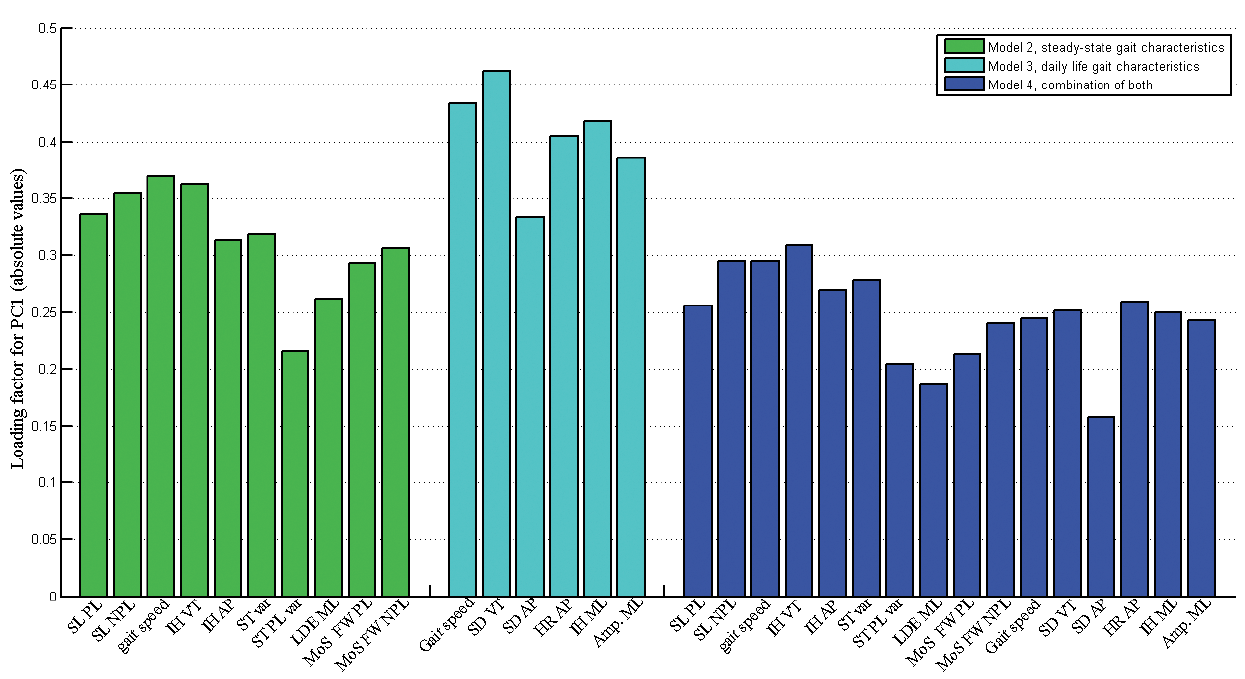 Click to show fullsize
 Click to show fullsize