
From the 1Swiss Paraplegic Research, Nottwil, 2Department of Health Sciences and Policy, University of Lucerne, Lucerne, 3ICF Research Branch, a cooperation partner within the WHO Collaborating Centre for the Family of International Classifications in Germany (at DIMDI), Nottwil, Switzerland and 4Academic Department of Rehabilitation Medicine, University of Leeds, Leeds, UK
Introduction: Two widely used outcome measures to assess functioning in neurological rehabilitation are the Functional Independence Measure (FIM™) and the Barthel Index. The current study aims to establish the equivalence of the total score of the FIM™ motor scale and the Barthel Index through the application of the International Classification of Functioning, Disability and Health, and Rasch measurement theory.
Methods: Secondary analysis of a large sample of patients with stroke, spinal cord injury, and multiple sclerosis, undergoing rehabilitation was conducted. All patients were assessed at the same time on both the FIM™ and the Barthel Index. The International Classification of Functioning, Disability and Health Linking Rules were used to establish conceptual equivalence between the 2 scales, and the Rasch measurement model to establish an exchange of the total scores.
Results: Items from both scales were linked to the International Classification of Functioning, Disability and Health d4 Mobility or d5 Self-care chapters. Their co-calibration satisfied the assumptions of the Rasch model for each of 3 diagnostic groups. A ceiling effect was observed for the Barthel Index when contrasted against the FIM™ motor scale.
Conclusion: Having a Rasch interval metric to transform scores between the FIM™ motor scale and Barthel Index is valuable for monitoring functioning, meta-analysis, quality audits and hospital benchmarking.
Key words: International Classification of Functioning, Disability and Health; ICF; Outcome measures; patient outcome assessment; comparability; functional status; Barthel Index; Functional Independence Measure.
Accepted Mar 8, 2017; Epub ahead of print Apr 28, 2017
J Rehabil Med 2017; 49: 416–422
Correspondence address: Birgit Prodinger, Guido A. Zäch Str. 4, CH-6207 Nottwil, Switzerland. E-mail: birgit.prodinger@paraplegie.ch
The presence of chronic diseases, together with the ageing of the world’s population, is leading to a substantial increase in the numbers of individuals living with the sequelae of disease and injury (1). Following an initial acute episode, or in long-term management, rehabilitation is the strategy to reduce the burden upon the individual, their families and the health and social care support systems. Consequently, measurement of the sequelae becomes crucial for clinical management, evaluating the effectiveness of rehabilitation programmes, and the long-term impact on people’s functioning (2, 3). For service provision, information on functioning is also crucial in order to optimize allocation of resources (4, 5). On the level of policy and programmes, such information is fundamental to be able to respond most accurately to the needs of people experiencing limitations in their functioning (6).
In a study of a population aged 65 years and over in the UK, 39% of 2,273 people reported problems with mobility, and 9% with self-care. Neurological disorders, along with osteoarthritis and depression, were shown to have a significant impact on functioning (7). In the context of the rehabilitation of neurological disorders, 2 of the most widely used outcome measures to assess functioning are the Functional Independence Measure (FIM™) and the Barthel Index (BI) (8–11). Both scales measure the level of independence in activities of daily living and are used to inform decision-making at all levels of the health system. Research has compared the psychometric properties of each scale in order to identify the similarities, strengths and limitations of both measures (9, 12–15). Occasionally a ceiling effect has been reported for the BI upon admission to rehabilitation (10, 16). Comparable results were revealed regarding the responsiveness of the scales (17). For both scales, issues with local dependency of items have been identified, based on the Rasch measurement model (18, 19). Current patterns of using either the FIM™ or BI indicate that the former is more likely to be used in North America, whereas the latter is more likely to be used in Europe (20).
This existing knowledge is informative for deciding which measure to use in a given setting. However, unless the scores of these 2 scales are directly comparable, comparability across people, research studies, and settings, locally, nationally and internationally, becomes challenging in practice and research. Only 3 studies have been conducted so far that have attempted to establish comparability of the 2 scales (21–23). Nyein et al. (21), using expert opinion to establish conversion criteria and validate those with correlations and kappa statistics, and Gosman-Hedström & Svensson (22), using the rank-invariant method for parallel reliability, provided algorithms to transform the score of 1 scale into a score of the other scale based on item-specific scores rather than on the total score of the scale. Such an algorithm requires having the detailed item-specific scores on hand. Challenges have been identified with respect to this item-to-item transformation, namely that the BI contained 10 items and required extending to a 13-item version for comparability. Not only may such transformation introduce bias, the algorithm also limits comparability, since on the individual level (e.g. discharge report) and population level (e.g. clinical trials and hospital statistics) often only the total score of a scale is reported, rather than an item-by-item specification. Hong et al. (23) used a common person equating design based on the Rasch model. Their study resulted in transformation tables between FIM™ motor scale and BI for 3 respective constructs, self-care, mobility and involuntary movement. The transformation tables provided by Hong et al. (23) do not require an item-to-item transformation; however, they deconstructed the original total score scaling structure of the FIM™ motor scale and BI into 3 constructs, each with its distinct transformation table. Since most studies report only the FIM™ motor scale and BI total score, such a transformation table is of limited use. Thus, the aim of the current study is to establish the equivalence of the total score of the FIM™ motor scale and the BI through the application of the International Classification of Functioning, Disability and Health (ICF) as a universal reference system for functioning, and Rasch measurement theory.
A psychometric study was conducted using secondary analysis of data collected for routine healthcare purposes in a large rehabilitation service in the north of England.
Data were collected from patients discharged from an inpatient regional rehabilitation unit in a UK National Health Service (NHS) hospital. All patients had an acquired neurological condition and were over 16 years old. All patients were participating in an inpatient, goal-orientated, multidisciplinary rehabilitation programme.
The FIM™ contains 13 items on motor tasks, all rated on a 7-point ordinal scale with higher scores indicating more independence (24). The BI encompasses 10 items on motor tasks rated on a weighted ordinal scale with lower scores indicating more need for assistance to complete each activity (25). Various versions of the BI exist with different rating scales. In this study, the original Barthel Index scored 0–20 has been used (26). Both scales have been used mainly in neurological rehabilitation, including patients with stroke and brain injury, as well as geriatric rehabilitation (11).
Data were extracted from a database of outcome measures recorded prospectively during patients’ stays on the unit. The FIM™ and the BI were each scored by members of the multidisciplinary rehabilitation team within 3 days of admission to the unit and in the 2 days prior to the patients’ discharge from the unit. This form of data collection enabled a common person equating design for the analysis below. That is, each person was assessed on both scales over a relatively short period of time, such that, from a clinical perspective, they can be considered equivalent for time of assessment.
This project was reviewed by the Local NHS Research Ethics Committee and deemed not to require ethical approval.
To establish the comparability of existing scales, 2 factors are important (27). First, the existing scales need to be linked to a universal reference system to examine their conceptual equivalence. For this purpose, we used the ICF, which is the standard recommended by the World Health Organization (WHO) to describe health and disability of individuals and populations, and therefore provides an internationally agreed upon language and structure (28). The ICF Linking Rules (29), an established method to link existing scales to the ICF, were applied. The linking is conducted by 2 researchers independently. They then contrast and compare the results and consult a third researcher in case of ambiguity. The evidence that scales measure the same trait is fundamental for scale equating (30), whereby the evidence of conceptual equivalence is a necessary first step in the process.
Secondly, to achieve an exchange between scores, a measurement framework needs to be applied that fulfils the requirements of fundamental measurement such that the raw score is a sufficient statistic, meaning that the raw score has all the information needed to identify the ability of a person on a given attribute, and numbers can be conjoint (31). The Rasch measurement model meets these requirements constituting a probabilistic form of fundamental measurement. Thus, the Rasch model allows transforming ordinal level data, which results from any questionnaires with a rating scale, into an interval level estimate. A specific analytical design was employed using the Rasch framework with 2 notably features: the single group design giving rise to a common person equating process (32); and a testlet design whereby the total scores of the scales are equated directly, rather than the scores of their constituting items. Given that the FIMTM and the BI share nearly identical items, albeit in a different response format, the approach has the advantage of taking into account any local dependency within item sets (30). Local independency is an important assumption underpinning to the Rasch model, but applies to any instance where items are summed up, and implies that given the latent trait, there are no residual correlations between any 2 items. Previous research on, for example, the FIMTM motor scale has indicated that it violates the assumption of local dependency; however, once this issue is accounted for, the scale fits the assumptions of the Rasch model (33).
Thus the Rasch model was applied to 2 testlets, one for each scale, for items showing conceptual equivalence based on the results of the ICF linkings, in an iterative process to test the model’s assumptions of invariance and unidimensionality. Invariance indicates that 2 persons with the same ability yet different personal characteristics, e.g. male and female or stroke and multiple sclerosis, have the same probability of achieving a given score on the scale, thus, the scale is not biased towards one group. A scale is unidimensional if all items measure the same underlying construct. RUMM2030 software was used in this study (34). With this software there is the additional advantage to the design through providing a conditional χ2 test of fit for the testlets, interpreted in the normal way (i.e. a non-significant χ2 indicates fit of the data to the model expectations) (30). Full details of the iterative approach applied are given elsewhere, and ideal indicators for each assumption are given at the bottom of the fit table (35). Tests for differential item functioning (DIF) were made for gender, age, and health condition (36).
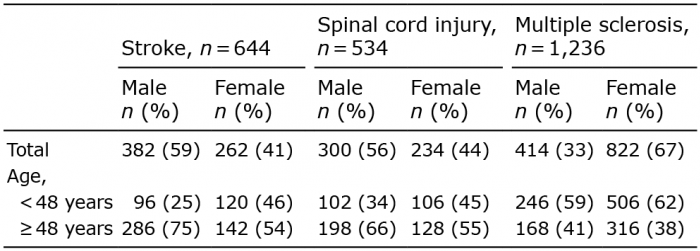
A total of 2,414 anonymous assessments were available across 3 diagnostic groups; stroke (n = 644), spinal cord injury (SCI; n = 534) and multiple sclerosis (MS; n = 1,236). The age and gender distribution by diagnostic group is shown in Table I.
Table I. Age and gender distribution by health condition
The content comparison of the FIM™ and BI revealed that the motor tasks of both scales capture domains related to d4 Mobility and d5 Self-care, as shown in Table II. Thus, we examined total score equivalence for the FIM™ motor tasks and the BI.
Table II. Linking of FIM™ motor scale and Barthel Index to the International Classification of Functioning, Disability and Health (ICF)
Fit of the data to the Rasch model (i.e. presented as 2 total scores) was good for all 3 diagnostic groups (Table III). No DIF was observed for age and gender, and the combined scales formed a strictly unidimensional data set within each diagnostic group. When diagnostic groups were merged, no DIF was observed, but a slight variation in the threshold patterns across diagnostic groups suggested the need for diagnostic-specific transformations of raw score to interval scale metric.
Table III. Fit of data (in 2-testlet form) to the polytomous Rasch model
The latent estimates so derived from the analysis accounted for virtually all the non-error variance in the data. The graphical fit to the model for the total sample is shown in Fig. 1.
Fig. 1. Graphical fit of total sample data to the Rasch model for each scale. The mean score within class interval (i.e. 10 groups of patients with increasing levels of independence) are presented by dots and the model expectation by the curve. It can be seen that for each scale (Barthel Index (BI) range 0–20; FIM™ motor scale range 0–78 [or 13–91]) the mean scores within the total sample sit perfectly on the expected curve. The units of the scale are presented in logits (x-axis; each logit increases the odds of achieving a particular score by 2.716). This figure, including its formatting and layout, is taken directly from RUMM2030. ST01: FIM™ motor scale; ST02: Barthel Index (BI).
The equating process allows for making the exchange between the scales, and the diagnostic-specific transformation table, as presented in Table IV. The FIM™ motor scale raw score is presented in its usual 13–91 format. There is a slight floor effect and a more substantial ceiling effect evident, as the BI does not have the same operational range as the FIM™ motor scale. With the FIM™ motor scale to BI, patients will begin to gain points before any movement is registered on the BI (rounded), although only marginally so. However, at higher levels of independence, the FIM™ motor scale will continue to gain points within each diagnostic group well beyond the ceiling of the BI.
Table IV. Transformation between Functional Independence Measure (FIM™) motor scale and Barthel Index (BI)
This study examined conceptual equivalence and metric equivalence between the FIM™ motor scale and the BI in order to derive a transformation table between the total scores of the 2 scales. Conceptual equivalence was confirmed by indexing the respective items to the ICF, showing that each scale constituted items from the ICF Mobility and Self-care chapters. The analytical approach adopted, using a common person equating design and requiring the raw score as a sufficient statistic, was to present the total scale score of each scale as an “item” to assess fit to the Rasch measurement model (30). Data from each diagnostic group was shown to have good fit to model expectations, and was free of DIF for age and gender. The equating of the 2 scales showed that the FIM™ motor scale had a wider operational range than the BI; the latter showed a distinct ceiling effect when contrasted with the former.
Given the widespread use of these scales across all levels of the health system, having a valid and useable (i.e. with just the total scores) exchange will facilitate comparison of clinical outcomes and research results, previously constrained due to the use of different scales. Furthermore, information collected with either the FIM™ motor scale and BI can be aggregated for secondary purposes, such as quality audits, hospital benchmarking, or clinical research including meta-analyses. Using the ICF as a common conceptual framework for establishing comparability between the FIM™ motor scale and BI also enables users to be compliant with international standards for quality management in healthcare (EN ISO 9001: 2008) (37) and eHealth architectures (PD ISO/TR 14639-2: 2014) (38) in the future, since these standards suggest explicitly the use of the ICF as conceptual framework and common terminology.
While both methods, the ICF Linking Rules and the Rasch measurement model, have been used respectively, this study shows that these methods are complementary and enable harmonization of existing scales when using them in such a manner. The results of the ICF linking enables content comparison of any scales compared and thus, provides a valuable conceptual foundation for deciding which (sub-)scales are meaningful to be co-calibrated. The Rasch measurement model specifies a priori requirements, which are consistent with fundamental measurement (39); thus, once the data satisfies the model’s expectations, an interval-scale metric results which can be used for providing the basis of exchange scores, as well as monitoring functioning of individuals and populations over time (40).
It is worth mentioning that previous researchers have linked the items of the FIM™ and BI related to Bladder and Bowel management to the ICF categories b620 Urination functions and b525 Defecation functions (8). We decided to link the items to d530 Toileting, which refers to Activities & Participation (d component) in the ICF, and indicates a limitation in performing the activity irrespective of whether there is an impairment of function. The linking to body functions (b component) would imply that the items are assessing an impairment of body functions, but since the items are then summed up with other items into a score of (in-) dependency, we considered the linking to limitations in activities most appropriate. The strict unidimensionality observed when the 2 scales were co-calibrated suggested that this approach was appropriate.
The transformation table (Table III) indicates that the FIM™ motor scale has a broader operational range, particularly at the upper end of independence. Thus, when applying the transformation table, one gets to a certain point on the FIM™ motor scale where every point thereafter remains a 20 on the BI. This finding could be reflective of the previously reported ceiling effect of the BI (10, 13, 18). Previous studies to derive a transformation between the FIM™ motor scale and BI on the item-to-item analysis (21, 22) or sub-scale scores (23) rather than the total scores, would not have addressed this issue. However, based on the results of this study, it becomes obvious that if, on admission, a patient is at the ceiling of the BI, there would be relatively little room for improvement on the FIM™ motor scale either. However, the FIM™ motor scale does reach higher levels of independence, and the choice of scale needs to be made with this in mind.
The limitations of this study are consistent with the use of secondary analysis of existing data sets where no control is possible over the initial data collected. Thus, DIF factors were restricted to just age, gender, and health condition. No knowledge was available about when assessments were made, e.g. admission or discharge, throughout the rehabilitation process; thus we were unable to address any issues related to the comparative responsiveness to change. It is also worth mentioning that, beyond the differences found in this study, for the FIMTM a formal training across countries on how to use the scale is in place, unlike the BI. Nevertheless, also for the BI, scoring guidelines exist that stress that it should be recorded what a person does rather than what a person can do and that the frame of reference is the past 24–48 h, and occasionally longer periods (41).
This study provides evidence that the scores from the FIM™ motor scale and the BI can be reliably transformed from one scale to another. The integration of the ICF Linking Rules and the Rasch measurement model serves as the methodological foundation for this purpose. Being able to compare scores derived from different scales directly and consistently is most valuable for clinical practice and research, including meta-analysis.


 Click to show fullsize
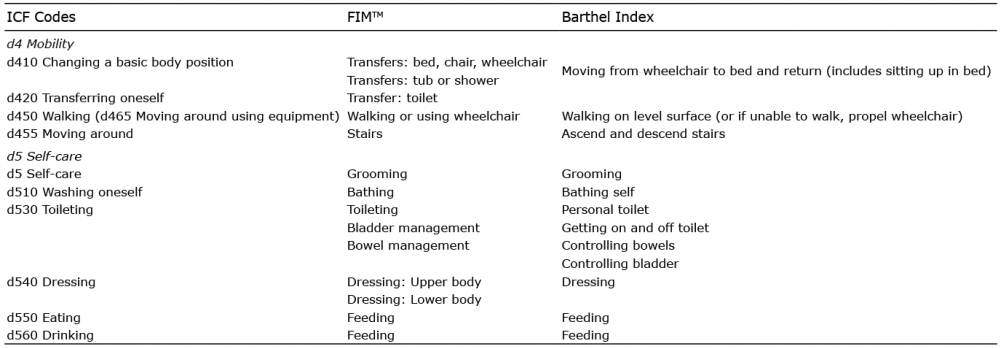 Click to show fullsize
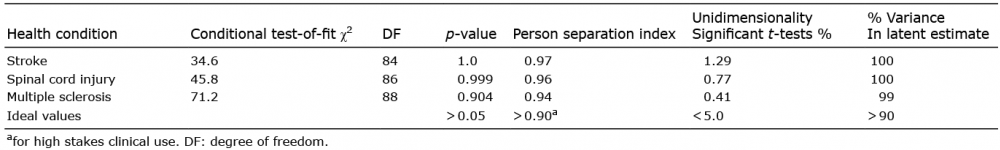 Click to show fullsize
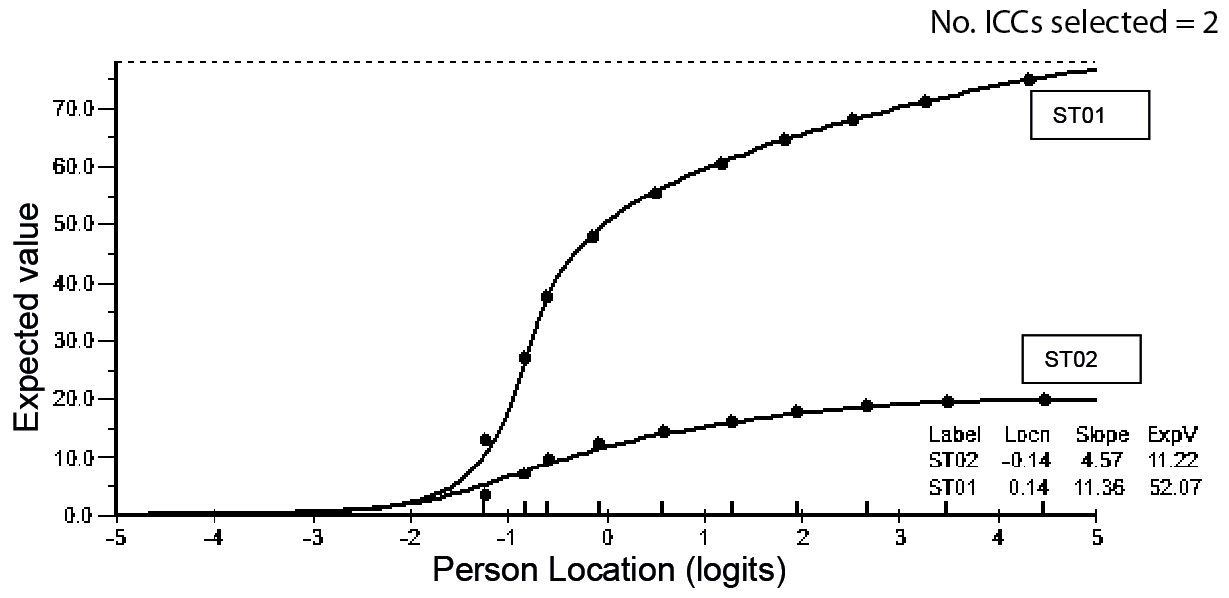 Click to show fullsize
 Click to show fullsize