
From the 1Graduate School of Health Sciences, Kio University, Kitakatsuragi-gun 2Department of Rehabilitation, Nara Prefecture General Rehabilitation Center, Shiki-gun, and 3Neuro Rehabilitation Research Center, Kio University, Kitakatsuragi-gun, Japan
Objectives: To investigate the effects of wheelchair propulsion on neuropathic pain and to examine resting electroencephalography pre- and post-wheelchair propulsion after spinal cord injury.
Design: Cross-sectional study.
Participants: Eleven individuals with spinal cord injury and pain and 10 healthy controls.
Methods: Single-session 15-min wheelchair propulsion and measurement of resting electroence-phalography. Effects of wheelchair propulsion were investigated using numerical rating scale (NRS) for neuropathic pain and short-form Profile of Mood States-Brief for mood. Peak alpha frequency on electroencephalography was calculated in 4 regions of interest; frontal, central, parietal and occipital areas. These outcomes were compared between pre- and post-wheelchair propulsion.
Results: Ten participants with spinal cord injury and all healthy controls completed the wheelchair propulsion exercise. NRS scores and negative mood were significantly improved following the wheelchair propulsion exercise. Pre-wheelchair propulsion, parietal and occipital peak alpha frequencies were significantly lower in the spinal cord injury
group compared with the healthy controls group. Post-wheelchair propulsion, central peak alpha frequency increased in the spinal cord injury group.
Conclusion: Wheelchair propulsion exercise temporarily decreased neuropathic pain intensity, improved negative mood, and modified alpha activity in spinal cord injury.
Key words: spinal cord injury; neuropathic pain; wheelchair; exercise; thalamocortical dysrhythmia; EEG.
Accepted Oct 26, 2016; Epub ahead of print Jan 18, 2017
J Rehabil Med 2017; 49: 136–143
Correspondence address: Gosuke Sato, Graduate School of Health Sciences, Kio University, 4-2-2 Umaminaka, Koryo-cho, Kitakatsuragi-gun, Nara, 635-0832, Japan. E-mail: gpamjl@live.jp
Spinal cord injury (SCI) impairs motor, sensory and autonomic functions, leading to secondary impairments, such as neuropathic pain (NP) (1). The prevalence rate of pain after SCI is approximately 80–90% (2, 3). Pain affects global indicators of health by interfering with activities of daily living, increasing depressive mood, chronic fatigue, and lowering health-related quality of life (4–6). Moreover, depressive mood related to chronic fatigue and may exacerbate chronic pain (7). In particular, NP associated with SCI is of importance to clinicians because NP is difficult to treat. Therefore, studies regarding interventions for pain after SCI are crucial.
Several studies have reported that greater physical activity is associated with fewer secondary complications, such as pain, fatigue and depression, in individuals with SCI (8, 9). It has been reported recently that gait or aerobic exercises improve NP, such as that after SCI (10–12). Moreover, this has led to a renewal of interest in exercises that can decrease pain after SCI. Aerobic exercise increases pain-pressure thresholds (13) and pain tolerance (14), improves negative mood, and increases vigour (15) in able-bodied individuals. However, the mechanism underlying these effects remains unclear.
Electroencephalography (EEG) has been used to examine the mechanism of central nervous system-associated deafferentation and pain after SCI. Brain-wave activity on EEG after SCI has shown a decrease in alpha waves (16). Tran et al. (17) reported that an SCI group had consistently lower frequencies compared with able-bodied controls, and deafferentation changes in brain-wave activity following SCI. Several studies examined the effects of alternating peak alpha frequency (PAF) in individuals with SCI experiencing NP. The alpha wave is an EEG oscillation at 8–13 Hz that processes sensory, motor, cognition, and thalamocortical feedback loops of excitatory and inhibitory neurones, which are thought to be the primary generators of alpha oscillations (18). PAF in individuals with SCI experiencing NP had a tendency to exhibit a lower frequency than in healthy participants (19, 20). Furthermore, PAF in patients with chronic pancreatitis and those with NP shifted toward lower frequencies, suggesting that PAF is a biomarker of NP (21, 22). This alternation of slowed dominant peaks is explained by concepts of thalamocortical dysrhythmia (TCD) (19–22). TCD is a phenomenon associated with the shift of dominant peaks to lower frequencies, with a significant enhancement of activity in the theta frequency range and is brought about by diminished excitatory or increased inhibitory input of neurones in the thalamus after deafferentation (23). We assume that if TCD-induced abnormal activity in the thalamus can be modified, NP can be decreased.
PAF increases following exercise (24), thus we hypothesize that exercise could modify thalamocortical loop activity. Although PAF usually decreases during the experience of pain (19–22), the relationship between PAF increase following exercise and NP in individuals with SCI is unclear. The aim of this study was to test the following hypotheses: acute effects of a single session of wheelchair propulsion (WP) exercise can: (i) decrease NP and improve negative mood; and (ii) increase PAF.
Eleven wheelchair-users with cervical, thoracic, or lumbar SCI (3 cervical, 5 thoracic, and 3 lumbar SCI) living in the Nara Prefecture, Japan, were recruited. There were 10 males and 1 female and the mean age (standard deviation (SD)) was 46 (12.7) years. Their injuries ranged from C6 to L2. Inclusion criteria were as follows: (i) tetraplegia or paraplegia for > 1 year; (ii) using a wheelchair in daily life; (iii) experiencing NP for longer than 1 year; and (4) no evidence of orthopaedics/head injury/neurological disease preventing WP. An age-matched and convenience sampling gender-matched healthy control (HC) group included 9 males and 1 female with a mean age of 43 (11.1) years. In the HC group, the inclusion criteria were as follows: (i) absence of disease or injury under treatment and (ii) no evidence of orthopaedic/head injury/neurological disease preventing WP.
This study was approved by the ethics committee of Kio University, Japan, and informed consent was obtained from all participants. All applicable institutional and governmental regulations concerning the ethical use of human volunteers were followed during the course of this research.
All participants performed WP on bicycle training rollers (MoZ-Roller, MINOURA, Japan). In the SCI group, the participant’s own custom-made wheelchairs were used because the posture during WP differed among the participants. For individuals with SCI who had trunk dysfunction, the wheelchairs had high backrests. In the HC group, the participants used standard wheelchairs and, for familiarization, attempted to perform a single 15-min session of WP prior to the experiment. All participants performed WP at the maximum possible speed for 15 min after a warm-up of approximately 5 min. All participants used gloves to avoid pain caused by friction between the hand rim and palmar-contact surface.
Exercise intensity. Exercise intensity was examined by measuring the rate of perceived exertion (RPE) on the Borg Scale (6–20 points) (25). RPE was measured at 5-min WP (WP5), 10-min WP (WP10) and 15-min WP (WP15).
Wheelchair propulsion speed. Mean WP speed was measured. A speed sensor (Polar CS 500 and Polar CS speed sensor W.I.N.D, Polar Electro OY, Finland) and magnet, which were attached to the wheelchair frame and wheel spoke, were installed to pass each other. Sampling was carried out every 5 s, and the WP speed was recorded for 5 min at pre-WP to WP5, WP5 to WP10, and WP10 to WP15. Mean WP speed was calculated in each group.
Pain and mood. Pain assessment was conducted using a classification for pain related to SCI (adapted from the International Association for the Study of Pain (IASP) Taskforce on SCI Pain) (26). The spontaneous at or below level NP intensity present was measured using a 0–10 numerical rating scale; 0 “no pain sensation” to 10 “highest imaginable intensity of pain sensation”. The short-form McGill Pain Questionnaire (SF-MPQ) (27) was used to evaluate multiple dimensions of pain and the Neuropathic Pain Symptom Inventory (NPSI) (28) to examine severity of NP before WP. NP intensity was measured at pre-WP, WP5, WP10, WP15, post-WP5 and post-WP10.
Psychological mood was assessed using the Profile of Mood States-Brief (POMS-B) (29), which is a shortened version of the original 65-item POMS. All participants rated a series of 30 mood-related adjectives on a 5-point scale (0–4). Scores were grouped into 6 subscales: “Tension–Anxiety,” “Anger–Hostility,” “Fatigue,” “Depression–Dejection,” “Vigor” and “Confusion” (29). Mood was measured pre-WP and post-WP10.
Resting-state EEG with eyes closed was recorded by a trained examiner for 3 min at pre-WP, WP15 and post-WP10. The experiments were performed in a quiet, air-conditioned laboratory in the afternoon. During EEG recording, all participants were asked to assume a sitting position in the wheelchair and avoid any movement. A high-resolution 32-channel portable EEG system (Active Two; BioSemi BV, Amsterdam, The Netherlands) was used for data collection. All participants wore the EEG cap (BioSemi BV) before performing the WP task. EEG activity was recorded in the following positions according to the international 10–20 system: Fp1, Fp2, AF3, AF4, F7, F3, Fz, F4, F8, FC5, FC1, FC2, FC6, T7, C3, Cz, C4, T8, CP5, CP1, CP2, CP6, P7, P3, Pz, P4, P8, PO3, PO4, O1, Oz and O2. Each electrode was filled with SignalGel® Electrode Gel (Parker Laboratories, Inc., Firfield, NJ, USA) for signal transduction. Electrodes were excluded from further analysis if the impedance >10 K. ActiView software (BioSemi BV) was used for data collection, and the EEG data were sampled at 512 Hz and digitally band-pass filtered (high-pass 0.5 Hz, low-pass 70 Hz). EEG data were analysed with the multimodal EEG analysis program EMSE Suite 5.4 (Source Signal Imaging Inc., La Mesa, CA, USA). Amplitudes exceeding 80 µV were rejected as artefacts.
Determination of individual alpha sub-bands and peak alpha frequency. The EEG data were divided into 2-s segments and a 50% overlap was accepted. Segmented data were analysed using power spectral analysis, performed using the Hanning window (50 % overlap). Individual alpha frequency (IAF) was determined using Kilmesh et al.’s method (30). EEG data were also subdivided into alpha bands (7–14 Hz), which were pooled over all 32 channels, and then exported as a crude sum of the activity values (µV2) in the specific band. For analysis, 4 horizontally arranged regions of interest (ROIs) were selected: frontal (Fp1, Fp2, F3, Fz, F4), central (FC1, FC2, C3, Cz, C4), parietal (CP1, CP2, P3, P4, Pz) and occipital (O1, O2, Oz) ROIs. IAF was determined at the point of peak power in the alpha band and was the anchor point to calculate the alpha sub-band. Alpha sub-bands of interest were as follows: low-frequency alpha band IAF – 2 Hz to IAF and high-frequency alpha band IAF to IAF + 2 Hz.
PAF was defined as the frequency with the highest mean power within the alpha band obtained from the mean values of the power values. The centre of gravity method was used rather than the peak method. The gravity method has been used as a different, and possibly more stable, measure of spectral distribution than the peak method (22, 30). Alpha wave shows that the wave form is bell-shaped, but the gravity method is suitable for the calculation of PAF when peak power in the alpha band shows multiple peaks power (30). PAF was calculated with the following equation (31). PAF was calculated in grand mean power and each ROI in both groups.
PAF = Σ(af × f)/Σaf
af = amplitude of frequency f
f = frequencies within alpha sub-band range (per 0.5 Hz)
All statistical analysis was performed using SPSS 19.0 for Windows (SPSS Inc., Chicago, IL, USA). Because of the small sample size in this study, statistical analysis was performed using non-parametric testing. For RPE, the Friedman test was applied to identify the time difference in each group, and post hoc testing was performed using the Wilcoxon signed-rank test and Bonferroni correction. In addition, group difference was compared using the Mann–Whitney U test. For WP speed, group difference was compared using the Mann–Whitney U test at WP5, WP10 and WP15. For pain, pre-WP, WP (at 5, 10 and 15 min), and post-WP (at 5 and 10 min) NRS scores were compared using the Friedman test, and post hoc testing was performed using the Wilcoxon signed-rank test and Bonferroni correction. For psychological mood, pre- and 10-min post-WP POMS-B scores were compared using the Wilcoxon signed-rank test in each group, and the Mann–Whitney U test was performed for differences between the 2 groups. PAF in pre-WP in grand mean power was compared between the 2 groups using the Mann–Whitney U test. PAF in pre-WP in each ROI was compared between the 2 groups using the Mann–Whitney U test and Bonferroni correction. PAF in pre-WP was compared between ROIs in each group using the Friedman test, and post hoc testing was performed using the Wilcoxon signed-rank test and Bonferroni correction. PAF in pre-WP, WP15 and post-WP10 were compared in each group using the Friedman test, and post-hoc testing was performed using the Wilcoxon signed-rank test and Bonferroni correction. Effect sizes were determined using η2 or r according to Cohen’s criteria (32). The level of statistical significance was set at 5%.
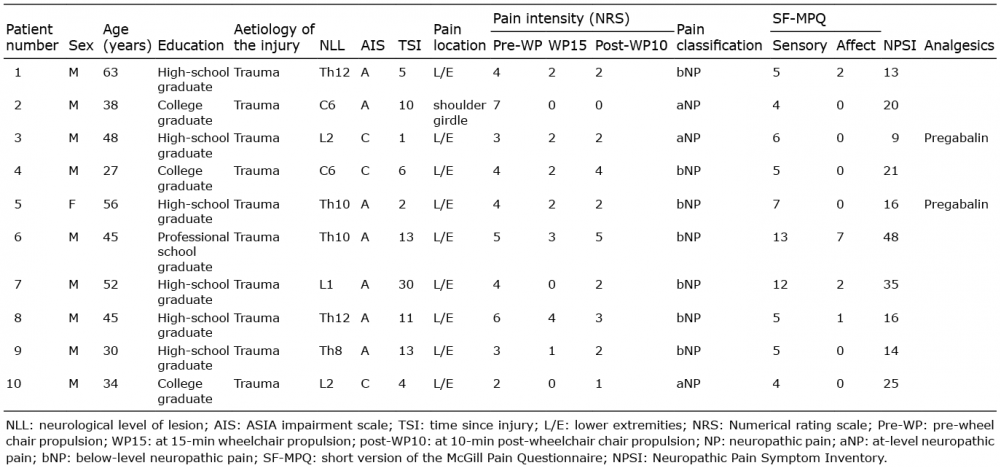
Ten participants (9 males, 1 female) out of the 11 enrolled subjects completed the 15-min WP task (Table I).
Table I. Demographics and data on pain occurrence with spinal cord injury participants
One individual with cervical SCI discontinued midway because of increased pain in the upper extremity. Of the 10 participants who completed the WP task, 2 had cervical, 5 had thoracic, and 3 had lumbar SCI. Mean (SD) age was 44 (11.6) years, and injuries ranged from C6 to L2. The mean (SD) time since injury was 10 (8.4) years. Two participants reported using analgesic medicines.
The results of exercise intensity are shown in Table II. Significant differences were observed on the Borg Scale in the 2 groups between the WP 5-, 10-, and 15-min time-points (SCI group: Friedman test, p < 0.001, η2 = 0.53; HC group: Friedman test, p < 0.001, η2 = 0.78). The post-hoc test showed that the Borg Scale at WP5 was significantly lower than at WP15 in both groups (SCI group: p = 0.04, r = 0.78; HC group: p = 0.02, r = 0.85). There were no significant differences between the 2 groups in the Borg Scale.
Table II. Summary of exercise intensity and wheelchair propulsion speed
The results of the WP speed are shown in Table II. There were no significant differences between the 2 groups in propulsion speed.
The pain locations were the lower extremity (n = 9) and shoulder girdle (n = 1). All participants experienced NP, 3 at-level NP and 7 below-level NP (Table I).
Significant differences were observed in NRS between pre-WP, WP (at 5, 10, and 15 min) and post-WP (at 5 and 10 min) time-points (Friedman test, p < 0.001, η2 = 0.51). The post hoc test showed that NRS at WP15 was significantly lower than at pre-WP (pre-WP: median (interquartile range; IQR) = 4 (3.25–4.75), WP15: 2 (0.25–2), p = 0.02, r = −0.92) (Fig. 1).
Fig. 1. Pain intensity rating. Alternation of neuropathic pain (NP) intensity following the wheelchair propulsion (WP) task. Significant differences were observed between conditions. Post hoc analysis showed that NP intensity at the WP 15 min condition was significantly lower than in the pre-WP condition. The horizontal bar reflects the median. WP5, WP10 and WP15: at 5, 10 and 15 min after WP, respectively. Post-WP5 and Post-WP10: at 5 and 10 min post-WP, respectively. †Friedman test. ‡Wilcoxon signed-rank test. *p < 0.05; **p < 0.01.
In the SCI group, when comparing POMS-B, there was a significant decrease in “Depression–Dejection” (pre-WP: median (IQR): 0.5 (0–1) and post-WP 10 min: 0 (IQR, 0–0), p = 0.04, r = –0.65) and “Anger–Hostility” (pre: median (IQR): 0.5 (0–1.75) and post-WP 10 min: 0 (IQR, 0–0), p = 0.04, r = –0.65). In the HC group, there was a significant decrease in “Tension–Anxiety” (pre: median (IQR): 7 (1–7.5) and post-WP 10 min: 0 (IQR, 0–1.5), p = 0.01, r = –0.8) and “Depression–Dejection” (pre: median (IQR): 3 (0.5–5.5) and post–WP 10 min: 0 (IQR, 0–1), p = 0.03, r = –0.72) and “Anger–Hostility” (pre: median (IQR): 1 (0–2) and post-WP 10 min: 0 (IQR, 0–0), p = 0.04, r = –0.66) and “Confusion” (pre: median (IQR): 5 (4.25–5.75) and post-WP 10 min: 4 (IQR, 3.25–4), p = 0.02, r = –0.71). Comparison between the 2 groups showed no significant differences for each subscale.
The rate of change of NRS and SF-MPQ or NPSI showed no significant correlation.
Comparison of both groups for grand mean frequency power (Table III, Fig. 2), PAF of the SCI group in pre-WP was lower than of the HC group (p < 0.01, r = 0.59).
Table III. Summary of peak alpha frequency (PAF) in pre-wheelchair propulsion (WP) in subjects with spinal cord injury (SCI) and healthy controls (HC)
Fig. 2. Peak alpha frequency (PAF) of grand mean power in pre-wheelchair propulsion (WP) in both groups. The PAF of grand mean power in subjects with spinal cord injury (SCI) (black line) was significantly lower than in healthy controls (HC) (grey line).
When comparing PAF in pre-WP on each ROI (Table III, Fig. 3 and 4A), parietal and occipital ROIs in the SCI group were lower than for the HC group (parietal, p < 0.01, r = 0.76; occipital ROIs, p = 0.02, r = 0.63). Within-ROI testing in each group revealed a statistically significant difference in the SCI group (Friedman test, p < 0.001, η2 = 0.40). Post hoc testing showed that central ROI was lower than parietal ROI in the SCI group (p = 0.03, r = 0.86) (Fig. 4B). There were no significant differences in the HC group.
Fig. 3. Peak alpha frequency (PAF) in pre-condition in each regions of interest (ROIs). The PAFs in all ROIs in individuals with spinal cord injury (SCI) (black line) were lower than in healthy controls (HC) (grey line). Pre-WP; pre-wheelchair propulsion; HC: healthy control; SCI; spinal cord injury.
Fig. 4. Comparison of peak alpha frequency (PAF) in pre-wheelchair propulsion (WP) between 2 groups and in each group. (A) Comparison of peak alpha frequency (PAF) in pre-WP between the 2 groups. PAF in the parietal and occipital regions of interest (ROIs) was significantly lower in the spinal cord injury (SCI) group than in the healthy control (HC) group. Wilcoxon signed-rank test. *p < 0.05, **p < 0.01. (B) For within-group PAF comparison, central ROI was lower than parietal ROI in the SCI group; however, there were no significant differences in the HC group. †Friedman test. ‡Wilcoxon signed-rank test. *p < 0.05, **p < 0.01.
When comparing PAF following WP exercise within each group (Table IV), there was significant difference in only central ROI in the SCI group (Friedman test, p = 0.03, η2 = 0.48). Post hoc testing showed that PAF post-WP10 was higher than PAF pre-WP in the central ROI (p = 0.04, r = 0.79) (Fig. 5). There were no significant differences in the HC group.
Table IV. Summary of peak alpha frequency (PAF) following wheelchair propulsion (WP) exercise in spinal cord injury (SCI) and healthy control (HC)
Fig. 5. Comparison of peak alpha frequency (PAF) following wheelchair propulsion (WP) exercise. The results of peak alpha frequency (PAF) following WP (above); in the spinal cord injury (SCI) group, the Friedman test demonstrated a significant difference. On post hoc testing, the PAF in post-WP10 was higher than that in pre-WP in the central regions of interest. (below); in the healthy control (HC) group, there were no significant differences. Pre-WP: pre-wheelchair propulsion; WP15: at 15 min wheelchair propulsion; post-WP10, at 10-min post-wheelchair propulsion. †Friedman test. ‡Wilcoxon signed-rank test. *p < 0.05.
The rate of change of NRS and all bands power in all ROIs showed no significant correlation.
This study investigated whether acute effects of WP exercise, such as aerobics, could decrease pain and improve negative mood, and examined resting EEG before and after a single WP session. The main findings of this study are as follows. Aerobic exercise, such as WP, decreased spontaneous NP intensity and improved negative mood. Moreover, PAF in the SCI group was lower than in the HC group before exercise. PAF in the central ROI following WP showed an increase in the SCI group.
First, we will discuss pain reduction observed in this study. NRS showed a tendency to decrease at WP 5 min and WP 10 min compared with pre-WP, and it was lowest at WP 15 min. However, there was a tendency of NRS to return to pre-WP values at post-WP 5 min and post-WP 10 min. Of these, only WP at 15 min was seen to significantly decrease compared with pre-WP. Vaegter et al. (13) showed that higher intensity of bicycling exercise resulted in greater exercise-induced hypoalgesia in healthy volunteers. In the present study, pain decreased at WP 15 min simply because this time-point had a higher intensity of exercise than other time-points. Moreover, previous studies have reported that exercise-induced hypoalgesia persisted for 5 (33) or 15 min (34) after exercise, similarly pain reduction persisted for 10 min in our study. Therefore, the results in the present investigation suggest that aerobic exercise, such as WP, can decrease NP intensity after SCI, similar to the results of studies conducted on able-bodied individuals (13, 33, 34).
With regard to the effects of exercise on pain after SCI, Norrbrink et al. (12) used a seated double-poling ergometer for 10 weeks and reported that NP intensity after SCI was decreased by aerobic exercise. In addition, Kressler et al. (10) showed that pain after SCI was decreased by overground bionic ambulation training for 6 weeks, and Cruciger et al. (11) observed that gait training with a robot suit decreased pain after SCI in 12 weeks. Similarly, in our study, NP intensity was seen to decrease significantly after a single WP session. Although the intervention periods were 6–12 weeks in previous studies, we found that NP intensity was decreased by WP within 15 min in the present study. The results of our study suggest that shorter periods of intervention significantly decrease the intensity of NP. Moreover, there is a tendency for this reduction to persist up to 10 min after exercise. However, 1 individual with cervical SCI discontinued the WP task because of increased NP in the distal upper extremities extending from both elbows. It should be kept in mind that, depending on its location, pain may be increased by exercise.
With respect to the effects of exercise on pain after SCI, the results of our study also show that WP improved negative mood (“Depression–Dejection” and “Anger–Hostility” in individuals with SCI and “Tension–Anxiety” and “Depression–Dejection,” “Anger–Hostility,” and “Confusion” in HC). Our results are consistent with those of Ohmatsu et al. (15) and Fumoto et al. (35), indicating that negative mood was improved after pedalling exercise.
No significant correlation was observed between the rate of change of NRS and SF-MPQ or NPSI. We suggest that reduction in spontaneous NP intensity occurred regardless of scores in the SF-MPQ or severity of NP in the NPSI. Thus, WP as aerobic exercise may affect any type of NP after SCI.
PAF in the parietal and occipital ROIs in the SCI group was lower than in the HC group. Therefore, PAF shifted to lower frequencies after SCI in the subjects who were experiencing pain. These results correspond to de Vries’s (22) findings that PAF in parietal and occipital ROI in chronic pain patients were lower than PAF in the HC group. The shift of PAF to lower frequency is reflected in TCD induced by abnormal functioning of the thalamus after deafferentation (23). The assumption that slower PAF is a biomarker of NP is now widely accepted (21, 22). Moreover, exercise increased PAF (24). Therefore, our hypothesis was that WP exercise including aerobic increases PAF simultaneously with the decrease in NP.
PAF in the central ROI following WP exercise was significantly increased in the SCI group, but not in the HC group. We believe that “hard” exercise intensity had the potential to increase PAF following WP exercise. Although both groups did not have significant differences in exercise intensity and WP speed, there were different PAF reactions following WP exercise for both groups. A prior study showed that brain activity in SCI individuals was different from healthy controls because of deafferentation (16, 17), resulting in the imbalance of excitation and inhibition (36). Consequently, brain wave activity and functional changes in the motor cortex after SCI resulted in a different PAF reaction to WP exercise compared with the HC group.
Thus, the modulation of EEG activity by exercise could be associated with the reduction in NP intensity. The effect of exercise is mediated by changes in neural activity in the ascending reticular-activating system, and neurones of the reticular formation stimulate cortical activation by exciting the widespread projecting neurones of the non-specific thalamocortical projection system (24). We believe that decreased pain intensity and increased PAF were reflected in effect of WP exercise. In addition, Ngernyam et al. (37) reported that transcranial current stimulation to the motor area reduced pain intensity and increased PAF in the motor area. Similarly, our study showed that increased central ROI corresponded to the motor area and reduced NP intensity. Therefore, our results suggest that WP exercise had an effect on pain and PAF similar to that of transcranial current stimulation (37). Thus, the present study suggests that the modification of EEG activity was associated with the reduction in NP intensity.
The study limitations include a small sample size and a large number of statistical comparisons without adjustment for multiplicity, with an impact on the probability of type 1 and 2 errors. Furthermore, our protocol did not control exercise intensity on the Borg Scale, and consequently, exercise intensity was not consistent among all participants. Thus, the exercise intensity necessary to reduce NP remains unclear. Future studies are needed to examine pain and modulate PAF by controlled exercise intensity in larger sample sizes. Our study was a single-session WP exercise, and thus lacked longitudinal data for reducing NP. In addition, although only 1 participant exhibited increased NP intensity, we were unable to find a reason for increasing NP. Therefore, WP as aerobic exercise decreased spontaneous NP, but its effects on pain reduction are still unclear. Because there are various mechanisms for induction of pain after SCI, it is necessary to assess reduction in pain by additional analysis. Furthermore, although individuals with SCI did not show upper extremity muscular pain in our study, WP exercise may induce muscular pain through the overuse of the upper extremity. Moreover, our results showed no statistically significant correlation between rate of change of NRS and PAF and no direct relation between pain intensity and EEG date. When modification of PAF following exercise was related to reduction in NP intensity, there is a possibility that secretion of neurochemicals (for example beta-endorphin (38) or serotonin (15)) brought about by the aerobic exercise mediates a change in pain intensity and EEG activity. This should be measured in future studies. Despite these limitations, the study contributes evidence regarding modification of pain after SCI.
This study is the first to investigate the effects of WP on pain after SCI and HC, and to measure resting EEG pre- and post-WP. The main findings were: WP as aerobic exercise temporarily decreased NP intensity and improved negative mood after SCI, and this was brought about by modified alpha activity following a single session of exercise. This suggests that using wheelchairs for activities of daily living in individuals with SCI with pain may decrease pain intensity and improve negative mood. Future studies should investigate the effects of the controlled intensity of exercise on pain intensity using a large sample size.
The authors declare no conflicts of interest.


 Click to show fullsize
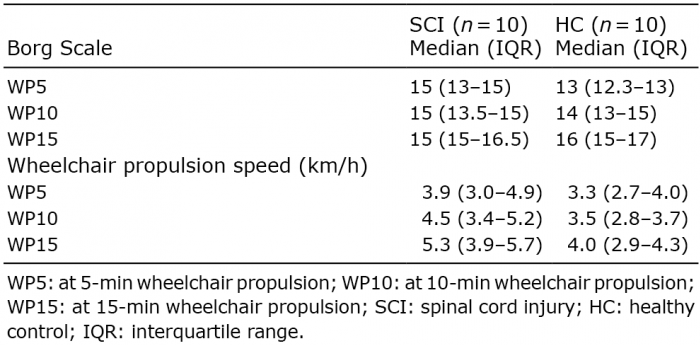 Click to show fullsize
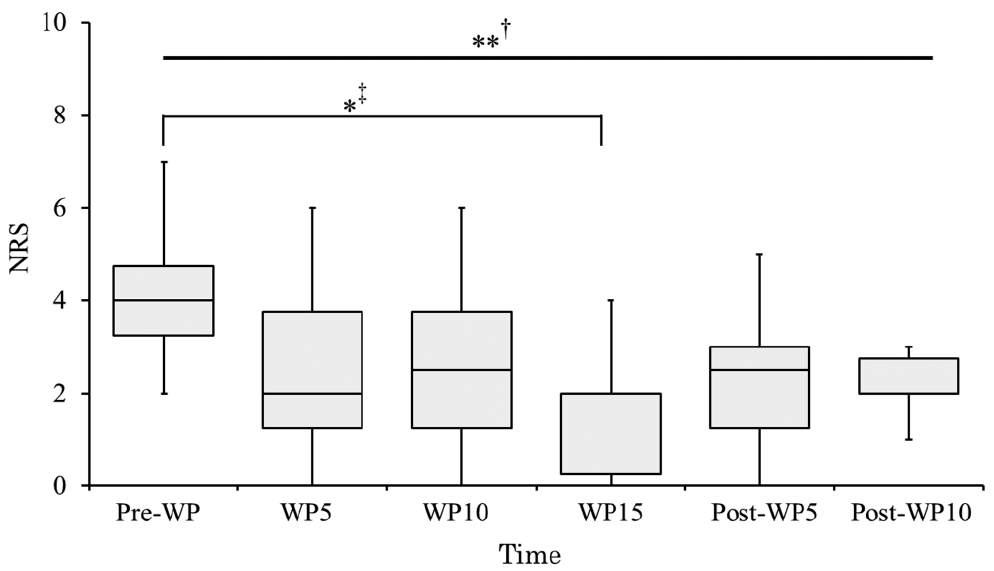 Click to show fullsize
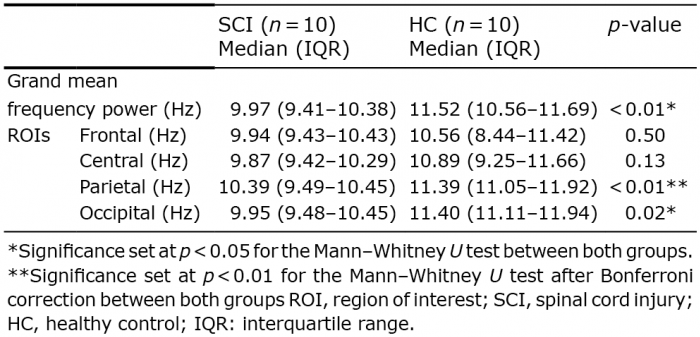 Click to show fullsize
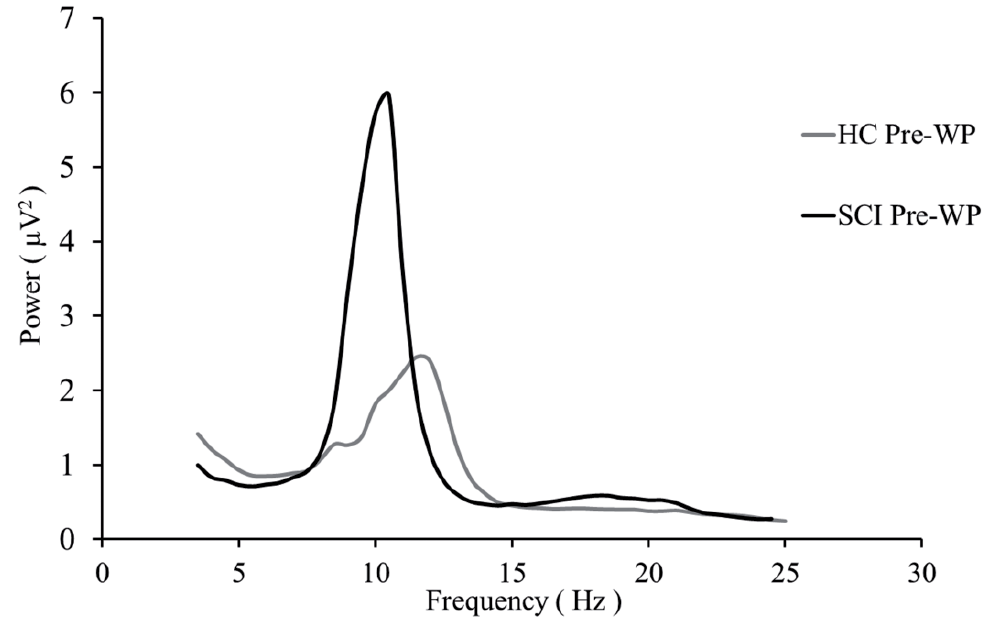 Click to show fullsize
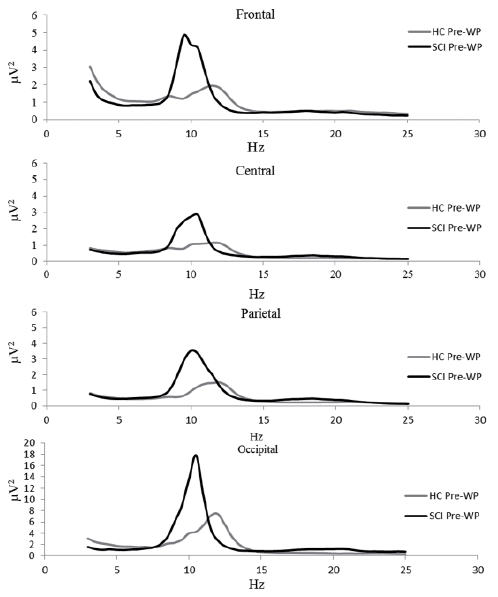 Click to show fullsize
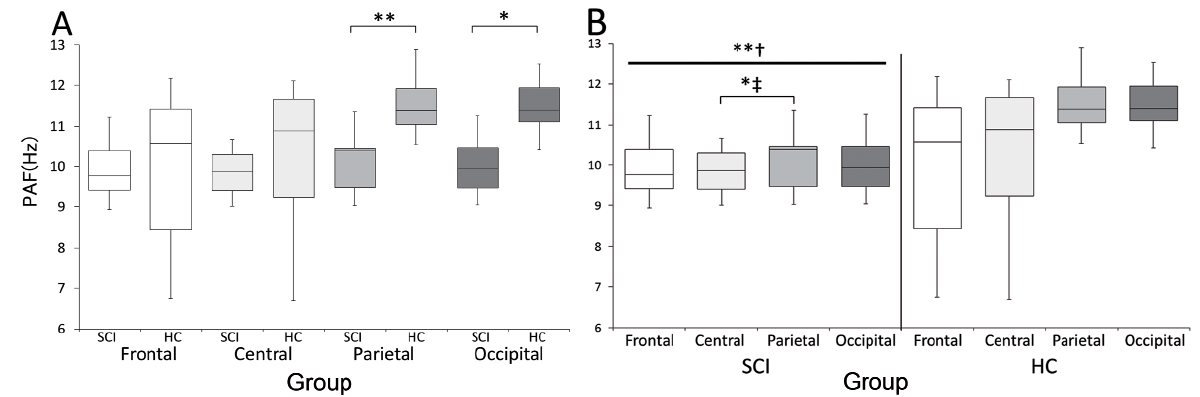 Click to show fullsize
 Click to show fullsize
 Click to show fullsize