
From the 1Karolinska Institutet, Department of Clinical Sciences, Danderyd Hospital, Division of Rehabilitation Medicine, 2Karolinska Institutet, Department of Neurobiology, Care Sciences and Society (NVS), Stockholm, and 3Department of Management and Engineering, IEI, Linköping University, Linköping, Sweden
Background: Progress in early cognitive recovery after acquired brain injury is uneven and unpredictable, and thus the evaluation of rehabilitation is complex. The use of time-series measurements is susceptible to statistical change due to process variation.
Objective: To evaluate the feasibility of using a time-series method, statistical process control, in early cognitive rehabilitation.
Method: Participants were 27 patients with acquired brain injury undergoing interdisciplinary rehabilitation of attention within 4 months post-injury. The outcome measure, the Paced Auditory Serial Addition Test, was analysed using statistical process control.
Results: Statistical process control identifies if and when change occurs in the process according to 3 patterns: rapid, steady or stationary performers. The statistical process control method was adjusted, in terms of constructing the baseline and the total number of measurement points, in order to measure a process in change.
Conclusion: Statistical process control methodology is feasible for use in early cognitive rehabilitation, since it provides information about change in a process, thus enabling adjustment of the individual treatment response. Together with the results indicating discernible subgroups that respond differently to rehabilitation, statistical process control could be a valid tool in clinical decision-making. This study is a starting-point in understanding the rehabilitation process using a real-time-measurements approach.
Key words: acquired brain injury; statistical process control; cognitive rehabilitation; early intervention; recovery process; time-series analysis.
Accepted Sep 21, 2016; Epub ahead of print Nov 30, 2016
J Rehabil Med 2017; 49: 128–135
Correspondence address: Gabriela Markovic, Karolinska Institutet, Department of Clinical Sciences, Division of Rehabilitation Medicine, Danderyd Hospital, SE-182 88 Stockholm, Sweden. E-mail: gabriela.markovic@sll.se
A key component in intervention research is the assessment of clinical outcome and processes, ensuring a reliable estimate of change and of the effect of a selected intervention. Outcome in brain injury rehabilitation is traditionally evaluated pre- and post-intervention with imaging measures such as functional magnetic resonance imaging (fMRI), magnetic resonance imaging (MRI) and positron electronic tomography (PET) scan; or behavioural measures, such as psychometric testing or evaluation of activity and participation according to standardized procedures. The value of outcome evaluation depends on the characteristics of the selected measure concerning sensitivity, specificity and error variances within the measure (1). Furthermore, understanding the recovery process after acquired brain injury (ABI) at a behavioural level is demanding, as both the variations in spontaneous recovery and the possible effect of an intervention need to be considered. Demonstrating that an improvement has taken place is thus a complex matter, particularly so in early cognitive rehabilitation where change in performance is both highly individual and expected in the natural recovery process. These methodological challenges, along with accounting for test-retest effect and daily biological predisposition of performance, risk uncertainty in end-point measures. This might be solved with repeated time-series measurements in control charts and detailed analysis of a specific behavioural variable.
In rehabilitation research, detailed analyses have been used in single-case studies (2, 3) as a valuable tool for monitoring the process of recovery in individuals or in developing rehabilitation techniques. Data for single-cases is expressed in control charts, but allows no reliable estimate at group level nor reliable identification of change (4).
A candidate method for process analysis at individual and group levels is statistical process control (SPC). SPC is a technique for time-series analysis with the underlying assumption that processes always show some variation. By establishing a baseline, the technique takes into account both the variability and the stability of a specific process by applying statistical control limits. The method was developed in the 1920s by Walter Shewart for improving processes in industrial manufacturing (5). It has been increasingly applied in healthcare for quality monitoring (6–9) and as an alternative analytic approach to test intervention effects in a medical setting (2, 10). Only one study has, to our knowledge, been published on intervention in rehabilitation medicine; more specifically on pain rehabilitation (11). Process analyses with SPC have not yet been used to describe patterns of recovery in early brain-injury rehabilitation, according to a 2007 review (7). This was confirmed by a recent literature search in connection with the present study.
The present explorative study focuses on the feasibility of SPC methodology for detecting change in terms of improvement in cognitive functioning during early cognitive rehabilitation. More specifically, it explores how SPC could describe the rehabilitation process during the first 4 months after ABI, including qualitative differences and potential patterns of improvement, at both individual and group levels.
The key technique of SPC is the use of control charts visually displaying time-ordered measurement of a variable. The purpose of the control chart is to monitor variations and detect significant changes in a process. Depending on the distribution of the data and on the underlying framework, different control charts may be applied (4, 12, 13). SPC uses statistically-derived interpretation rules to disentangle variation by distinguishing between 2 types of variation: common-cause variation and special-cause variation (8–10, 14). Common-cause variation is considered to derive from the inherent nature of the process influenced by random factors in rehabilitation, such as time of day or biological factors contributing to treatment response. A process exhibiting only common-cause variation is considered stable and predictable. Special-cause variation represents variation over time due to unusual or unexpected disruptions in the process, such as an improvement or deterioration in performance reflecting a statistically significant change in the process (9). Specification of 4 parameters is required when applying a control chart (10, 12, 15): sample size (number of data-points at each measurement), number of measurements to plot; control limits (number of standard deviations (SD) above or below the centre line) and a baseline defining a process in control.
The components of a control chart are graphic, with time represented on the horizontal (x) axis and outcome measurement values on the vertical (y) axis. The graph displays a centreline representing the mean of measurements and an upper (UCL) and lower (LCL) control limit, calculated from the variation in data, thus representing the limits of random variability. The limits are set to 3 SD from the mean, establishing margins where data will be found approximately 99.7% of the time. Control limits are based on the underlying probability distribution. For instance, the normally-distributed Xbar chart shows variation between measurements over time, thus relaying information about the central tendency of the data collected.
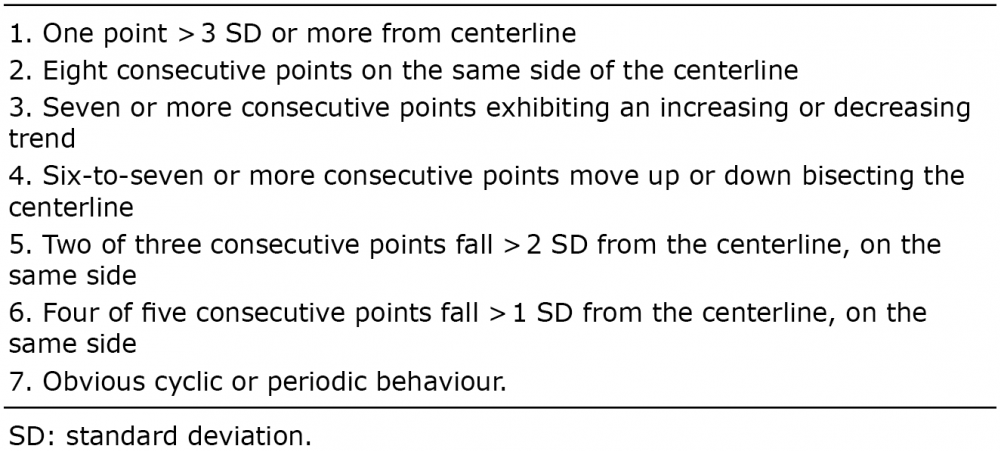
To examine the data more rigorously for systematic variations, SPC considers statistically-derived interpretation rules depending on the process being measured (8, 10, 13, 16). The most fundamental rule for special-cause variation, thus a defined change in the process, is 1 point falling outside the control limits of 3-sigma (2, 17). By using supplementary rules of interpretation, although increasing the risk of Type I error, the SPC improves the sensitivity to detect special causes of variation, changes that would not occur by natural variability in a process. A typical set of rules is listed in Table I.
Table I. Primary and supplementary rules for statistical control
Patients with mild-to-moderate stroke or traumatic brain injury (TBI) within 4 months after injury (mean 100 days (SD 34) and participating in an interdisciplinary rehabilitation programme were included in a larger randomized controlled trial (RCT) research programme on cognitive rehabilitation after ABI (18). Data are reported in the present study on 27 patients in the “control condition” (interdisciplinary brain injury rehabilitation including 20 h of activity-based attention training). All patients were admitted to either inpatient (n = 18) or outpatient care (n = 9). Inclusion criteria were: deficits in attention as defined by the Attention Process Test (19) (< 70% correct answers on at least 2 of 5 subtests), standard scores 7 and above on reasoning skill (20), age range (18–60 years) and a good understanding of the Swedish language. Exclusion criteria were: moderate-to-severe aphasia, ongoing psychiatric illness, ongoing substance abuse, severe somatic disorder causing anoxic periods and severe pain. Of the 27 patients, 75% had had stroke and 25% TBI. There was a predominance of male patients (75%). A majority lived in a relationship (82%) and had a higher educational degree (71%). Mean age was 45 years (SD 10). The patients were enlisted in the study within 12 weeks after injury (mean 8 weeks post-injury (SD 4)) and completed the intervention programme within 20 weeks after injury (mean 14 weeks (SD 5)). The overall performance level on attention, as defined by the Attention Process Test (19) was between 27% and 61% (minimum 6%, maximum 64%) of an expected 80–100% in a healthy population.
The Paced Auditory Serial Addition Test (PASAT) (20) was used as outcome measure of attention improvement (21). The procedure takes 15–20 min. In this study we present results for the slow-paced interval condition (2.4 s). Scoring is based on the number of correct answers produced within the time-frame; higher scores indicate better performance (22).
The patients received interdisciplinary brain injury rehabilitation, also including 20 h of activity-based rehabilitation of attention, during a period of 5–6 weeks (mean 39 days (SD 12)). The intervention effect was monitored using the PASAT outcome measure, pre- and post-intervention and after every third hour of intervention. The exception was the last measurement point, which was registered after 2 h of intervention; a total of 8 measuring points (18).
Statistical control limits and variability within the process of recovery were explored with the SPC method (23). At group level the Xbar chart (the mean) and S control chart (measurement of variation within a sub-group over time) were used. For measuring individual data over time, SPC recommends plotted I-diagrams based on individual data points. The examination of each individual chart was based on a centreline, 3-sigma control limits and tests for special-cause variation. The control charts were created using the ststistical software MINITAB 17 (www.minitab.com). The software labels relevant plot points with the test number, signalling the evidence of a special-cause variation (24). Improvement in terms of end-point measures was explored with a paired-samples t-test, level of significance at 0.05.
Other statistical software used was: IBM SPSS Statistics v. 22 and MS Excel.
The study protocol was approved by the Karolinska Institutet Ethical Committee. Participants received oral and written information regarding their participation in the study, and they all gave written consent. The study is registered at clinicaltrials.gov, trial registration: NCT02091453, 19 March 2014.
At the early rehabilitation stage and due to the natural recovery of the patient group (ABI), one cannot usefully establish a stable baseline upon which to test improvement after an intervention. A variable degree of spontaneous recovery was expected for all of the present patients. As our starting point, we assumed that changes would occur from the mean and that the SD would be constant. The mean must therefore consist of the starting values from which to detect changes. Early measures of PASAT when entering rehabilitation would thus inform us about the starting level of performance. This is also discussed in previous research on the PASAT measure (25). For the control charts at group level we created a mean value based on the first and second PASAT trials. These 2 measures provided the initial values from which we wished to detect significant improvements. Assuming a constant SD means that no changes are expected in the SD over the 8 consecutive measurements. As a consequence, all the available observations for this parameter could be used, providing us with a theoretical value of the SD applicable for all patients and potentially for subsequent control charts. When calculating control limits, estimation of the SD was used through a pooled SD measure based on the first 2 first trials from PASAT. For further information about the calculations, see Appendix I. When constructing the I-diagrams we used a similar approach. A baseline for I-diagrams was based on the mean of the first 2 trials for each patient (26). The SD was estimated by calculating the mean of the moving range between the 2 first trials (n = 27) (12) (see Appendix I).
Appendix I
To summarize, the control chart was built up with: (i) estimations of the mean through the first 2 observations for the particular group/individual, and (ii) an overall estimate of the SD.
Mean values and SDs for PASAT with control limits at 3-sigma for statistical control are presented in Fig. 1.
Fig. 1. Xbar S chart at group level with 3-sigma control limits. Improvement in terms of end-point measures is expressed in mean and standard deviation (SD). PASAT: Paced Auditory Serial Addition Test; UCL: upper control limit; LCL: lower control limit.
The plots on the Xbar chart showed an upward slope beyond control limits; a clear signal of special-cause variation. This is demonstrated both by the SPC method and by paired-samples t-test (t = –6.54; df = 26; p = 0.000) using end-point measures at initial level of performance (mean 35.2 (SD = 13.43)) and at final level of performance (mean 47.6 (SD 12)). The Xbar chart fulfilled the requirements of the primary rule for special-cause variation, 1 point falling outside the control limit, allowing the conclusion that an improvement in the process had occurred at group level. A more rigorous interpretation of special cause-variation was confirmed by 2 supplementary rules: 7 or more consecutive points exhibiting an increasing trend, and 6–7 or more consecutive points moving up bisecting the centreline (Table I). The S chart, representing group variation, indicated no special cause of variation within the group; variation over time during the sampling period was thus considered stable.
Following the group-level analysis, we examined with I-diagrams whether special-cause variation in the process could be identified at individual level (Fig. 2).
Fig. 2. I-diagrams (n = 27) for Paced Auditory Serial Addition Test (PASAT) during attention training (20 h) at 8 measurement points. PASAT raw scores range from 10–60 points.
We identified special-cause variation and thus change in the individual processes in 15 out of 27 I-diagrams. Processes exhibiting special-cause variation fulfilled the requirements of 1 or more rules for statistical control (Table I) according to the primary rule of 1 point outside the 3-sigma control limit (n = 4), and/or the supplementary rules of 2 of 3 consecutive points falling outside the 2-sigma control limit on the same side (n = 10), plus 4 of 5 consecutive points falling outside the 1-sigma control limit on the same side (n = 9).
Following a qualitative inspection of the I-diagrams, data was interpreted for time of change by examining the time-point for special-cause variation. Fig. 3 displays when in time change in the process was detected. The individual patients are distributed according to initial raw scores on PASAT. The analysis resulted in 3 sub-groups according to pattern of performance: rapid improvers, steady improvers, and stationary performers. Rapid improvers were defined as fulfilling the criteria for special-cause variation within 5 measurement points. Steady performers were defined as fulfilling the criteria for special-cause variation between 6 and 8 measurement points. The pattern of a stationary performer fulfilled no criteria of special-cause variation, thus displaying only random variation. Three I-diagrams were selected to illustrate the identified patterns of improvement (Fig. 4) as exemplified by patients 6 (rapid performer), 9 (steady performer) and 16 (stationary performer). Although illustrating 3 different patterns, where 2 of the patterns signal special cause variation, they expressed little difference in terms of end-point measures.
Fig. 3. Distribution of patients according to initial raw scores on Paced Auditory Serial Addition Test (PASAT) (y-axis) and plotted measurement points when first special-cause variation occurred (x-axis). The symbols represent 3 identified subgroups in order of improvement pattern. Stationary performers exhibit only common cause variation and are plotted on the x-axis outside the measurement points.
Fig. 4. Three I-diagrams illustrating the different patterns of improvement identified by the criteria for special-cause variation.
The present study found that, using the SPC method, both extent and timing of changes in performance can be approached at both group and individual levels.
To be applicable in early cognitive rehabilitation after brain injury, the SPC method had to be adjusted in order to estimate the baseline and as to number of measurement points. Process analysis identified 3 different patterns in performance changes: rapid, steady and stationary performers.
In systems for classifying levels of evidence, single-case experimental design studies were often classified as low-level evidence (26).The recently developed single-case reporting guideline in behavioural interventions (SCRIBE) (27) is an important step towards a strict reporting for increased evidence level. In our study we identified a different way to evaluate single case data, i.e. SPC. SPC allowed us to group together individual processes based on statistically sound rules for change at group level. The analysis revealed a steady group-level improvement in performance, and the within-group variability was stable over time. However, the I-diagrams described considerable differences in patterns of change. The finding of 3 different patterns of performance change has not been described earlier within the context of brain injury recovery. We based our definition of patterns on the ideas presented in previous research concerning quality control and healthcare (16). The identification of specific patterns of recovery is of high importance for rehabilitation planning and for prognosis. The present findings are, however, based on a limited group with a limited number of participants. Further studies are needed to explore what factors might be contributing to these findings.
The primary rule in SPC for special-cause variation is 1 point outside a 3-sigma control limit. This is set as a cautionary measure to prevent erroneous conclusions in industrial settings (28). However, the choice of sigma-level in clinical research needs to rely on a proper balance between specificity and sensitivity of the measure. The application of some of the additional rules for special-cause variation appears to be more suitable in a clinical context, in line with findings in the review of Tennant et al. (29). An intervention study aims to influence a process in order to improve outcome, and the task is to decide whether the change in the process is spontaneous or a result of the intervention. In the present study 2 supplementary rules were useful, i.e. 2 of 3 consecutive points falling more than 2-sigma from the centreline on the same side, and 4 out of 5 consecutive points falling more than 1-sigma from the centreline on the same side. Even if recommended, the 3-sigma criterion level might be a too harsh a limit for clinical research in which intervention effects are influenced by numerous variables that are out of the range of control. However, as stated above, the choice and combination of rules for detecting special-cause variation might be more sensitive to detect lasting change, than adjusting the control limits per se.
Furthermore, process analysis also provided data concerning when special-cause variation occurred by identifying time-points for significant variations in the process. This real-time feedback would enable a closer examination of the underlying factors for variation, as well as providing a powerful tool for clinical rehabilitation management. Differences in line with timing of special-cause variation were what enabled the identification of 3 patterns of change. The findings of stationary performers at this early stage in cognitive rehabilitation, where improvement is expected, raise questions about the natural recovery process. Identifying these patients as early as possible is of utmost clinical importance. Our patients were selected from a relatively well-defined homogeneous group with moderate-to-mild cognitive impairments in the early stage after ABI. The results indicate that, even within this group, there were discernible subgroups responding differently to rehabilitation. Future studies are needed to explore what factors might be contributing to these findings.
Some specific challenges and critical assumptions need to be taken into account when applying SPC to intervention processes in cognitive rehabilitation. They include choice of outcome variable, sample size, number of measurement points and establishment of baseline.
The selection of the outcome variable is crucial. As the participants were given attention dysfunction rehabilitation, the selected outcome variable needed to be an objective neuropsychological attention test independent of the material in the rehabilitation intervention. Although regarded as a difficult test, the PASAT is psychometrically sound, with a possibility of an unlimited number of parallel versions. It has a documented test–retest effect for 2 administrations (25) leading to an expected initial improvement of results. An interesting observation was the lack of test–retest effect for some patients.
The number of subjects could be a concern when applying SPC at group level in a clinical setting as the recommendations proposes at least 10 subjects/observations per subgroup (10, 13). Our sample size of 27 patients fulfilled the requirements for using Xbar and S charts at group level (n ≥ 10).
A possible critical issue is the number of measurement points in the sample period (15). In designing SPC studies it is recommended to include a relatively large number of measurement points, approximately 20–25, to assure stability (8, 10). Fewer than 20 measurement points could lead to an unacceptably high risk of Type II error; but using more than 30 could augment the risk of Type 1 error (10, 28, 30). For shorter processes 12–15 measurement points are considered sufficient (31). For clinical reasons the number of measurement points in this study was 8. The mean length of stay for early brain injury rehabilitation at our study site is approximately 50 days. Administration of the primary outcome measure PASAT after every third of 20 training sessions seemed a feasible alternative from the patients’ perspective. This implied a need to develop control limits and centrelines within the available 8 measurement points following principles other than traditional rules. Establishing the control limits and centre line was a particular challenge since our concern in the first place was individual and not group-based improvements. How was this solved? The design of a control chart requires calculating the mean and SD from data. In our approach, the mean was based on the first 2 consecutive measuring points as baseline. The meaningful patterns in our data indicate the usefulness of this approach despite the number of measurement points being considerably lower than recommended. Although it increased the probability of erroneous conclusions, it is a tentative development in SPC methodology. The reason for this approach is that these 2 first PASAT measurements are clinically viewed as a starting point (25) from which to compare the subsequent 6 measurements. It is the baseline from which we would like to detect significant changes. In other words, a signal in our control chart means that a patient has significantly improved or lowered her performance from the first 2 measurements. Furthermore, the calculations for the SD were based on all the 8 measurements using standard procedures in SPC. This is further described in Appendix I.
In conclusion, the results of this study support the feasibility of process measures, as proven earlier by single-case studies in cognitive rehabilitation (32–34). We found that SPC more closely followed the processes occurring during early rehabilitation after ABI. To fit the needs of early cognitive rehabilitation, the SPC method was adjusted to the limited number of measurement points, where redefined baseline estimation was more suitable for an evolving process.
Control charts with defined control limits together with rules for detecting special-cause variation are promising for following an intervention process in rehabilitation in a real-time setting. Significant events, such as rate and magnitude of change during an improvement, or the lack thereof, can be recognized. In the present study we compared results both with end-point measures (t-test) and SPC and we found significant changes at group level with both methods. However, the use of SPC charts provided additional important information on an individual level while offering the same probability level of significance. Compared with traditional single-case studies, where decision-making is based on visual inspection, the use of SPC control charts provides statistically-based feedback on the process at hand, supporting clinical decision-making (10) and adjustments of the intervention process. Recognizing true special-cause variation permits effective management of the process (2).
The authors would like to thank the patients for their participation in the study, and the clinical staff for assisting in recruitment, assessment and training of patients. The authors acknowledge the support of the following funding agencies: the Promobilia Foundation, the Swedish Stroke Association (Strokeförbundet) and the regional agreement on medical training and clinical research between Stockholm County Council and Karolinska Institutet, ALF.
The authors declare no conflict of interest.


 Click to show fullsize
 Click to show fullsize
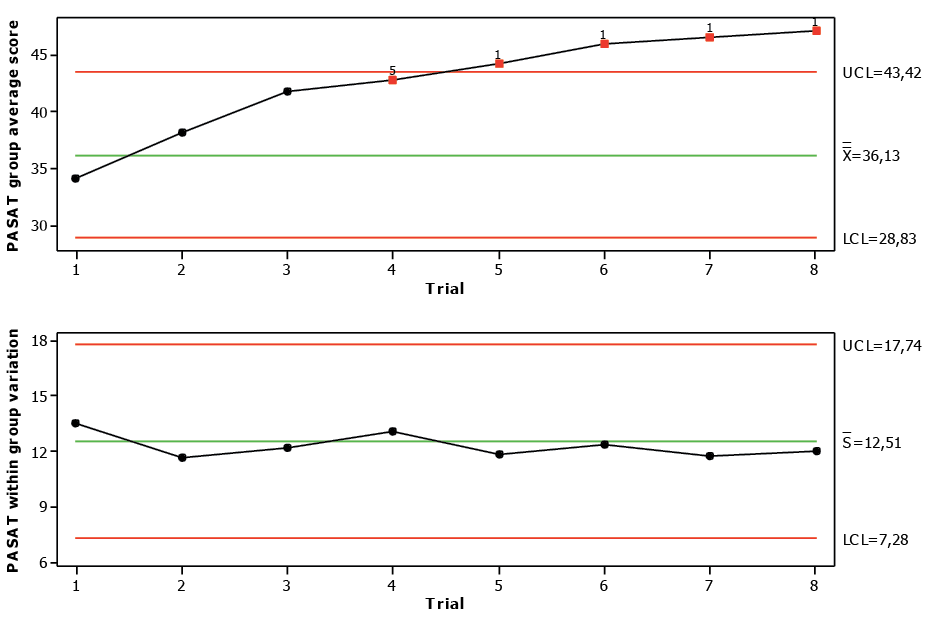 Click to show fullsize
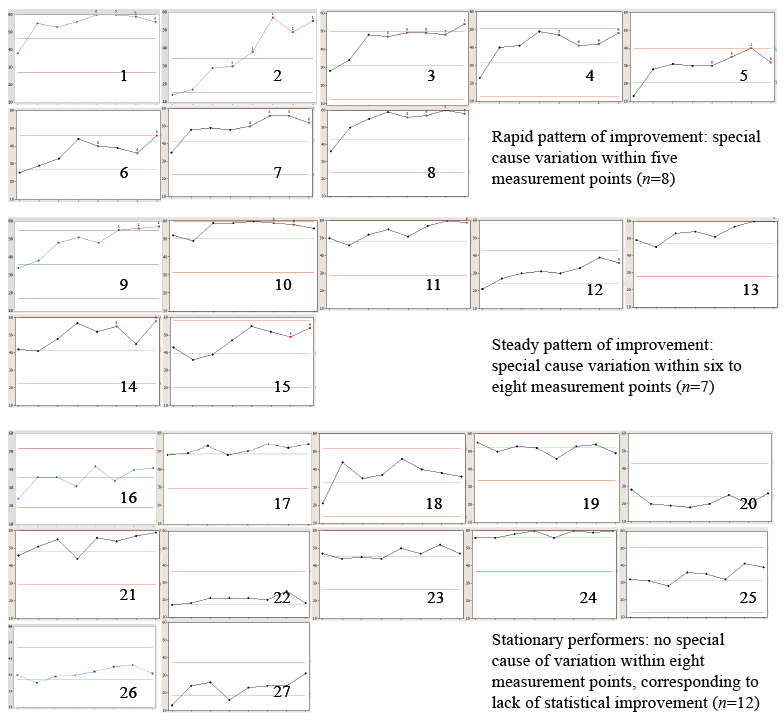 Click to show fullsize
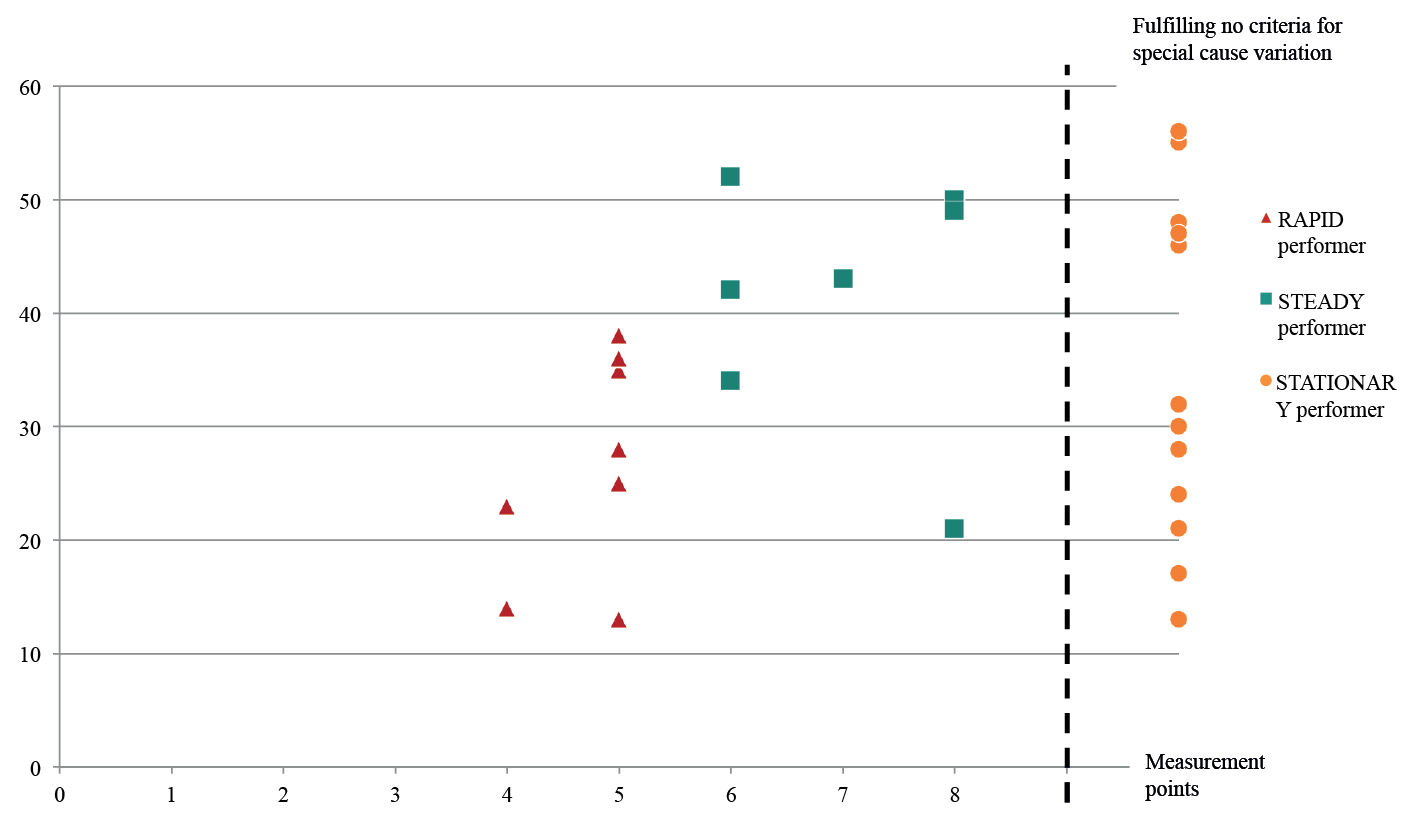 Click to show fullsize
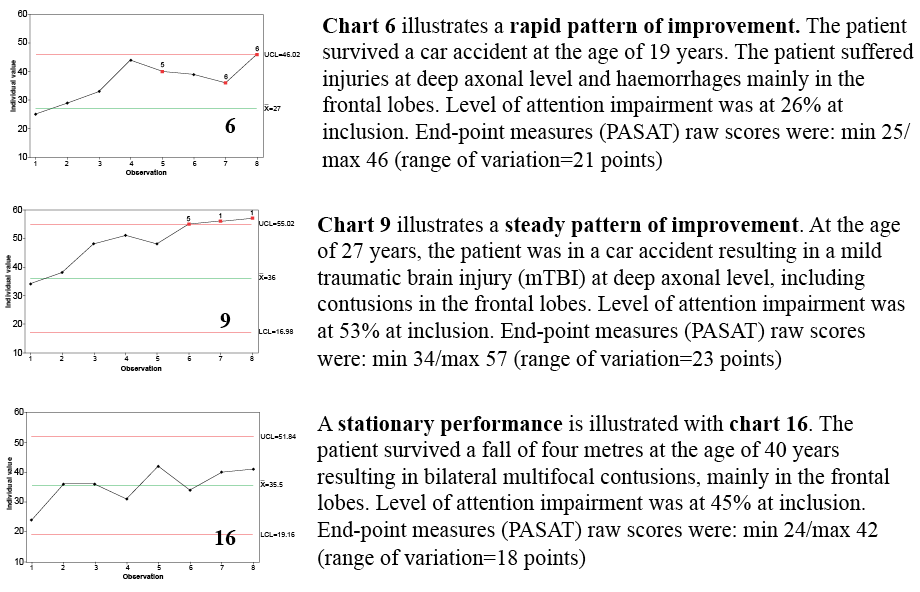 Click to show fullsize