Martin W. G. Brinkhof, PhD1,2, Christine Fekete, PhD1, Jonviea D. Chamberlain, Msc1,2, Marcel W. M. Post, PhD1,3,4 and Armin Gemperli, PhD1,2, for the SwiSCI Study Group
From the 1Swiss Paraplegic Research (SPF), Nottwil, 2Department of Health Sciences and Health Policy, University of Lucerne, Lucerne, Switzerland, 3University of Groningen, University Medical Center Groningen, Haren and 4Brain Center Rudolf Magnus and Center of Excellence in Rehabilitation Medicine, University Medical Center Utrecht and De Hoogstraat, Utrecht, The Netherlands
OBJECTIVE: To detail the protocol, recruitment, study population, response, and data quality of the first population-based community survey of the Swiss Spinal Cord Injury (SwiSCI) Cohort Study.
DESIGN: The survey consisted of 3 successive modules administered between September 2011 and March 2013. The first two modules queried demographics, lesion characteristics and key domains of functioning. The third module collected information on psychological personal factors and health behaviour; work integration; or health services and aging.
PARTICIPANTS: Community-dwelling persons with chronic spinal cord injury in Switzerland.
METHODS: Descriptive analyses of the recruitment process, participant characteristics, and correspondence between self-reported and clinical data. Determinants for participation and the impact of non-response on survey results were assessed.
RESULTS: Out of 3,144 eligible persons 1,549 participated in the first two modules (cumulative response rate 49.3%). Approximately three-quarters of participants were male, with a median age of 53 years, and 78% had traumatic spinal cord injury. Record-linkage with medical records demonstrated substantial agreement with self-reported demographic and lesion characteristics. A minimal non-response bias was found.
CONCLUSIONS: The community survey was effective in recruiting an unbiased sample, thus providing valuable information to study functioning, health maintenance, and quality of life in the Swiss SCI community.
Key words: spinal cord injury; community survey; study protocol; study participation; response bias; non-response, patient characteristics, data quality.
J Rehabil Med 2016; 48: 120–130
Correspondence address: Martin Brinkhof, Swiss Paraplegic Research, Guido A. Zäch Strasse 4, CH-6207 Nottwil, Switzerland. E-mail: martin.brinkhof@paranet.ch
Accepted Nov 18, 2015; Epub ahead of print Feb 1, 2016
INTRODUCTION
The focus of rehabilitation management, health services provisioning and social policy for people with spinal cord injury (SCI) is increasingly on improving functioning and participation in community life (1). This shift in emphasis from acute care and first rehabilitation to community life is partly due to improvements in the clinical and rehabilitation management of individuals with SCI, which has resulted in a significant increase in life expectancy, particularly in high-income settings (2). There is also increasing awareness, as documented by the United Nations Convention on the Rights of Persons with Disabilities, that people living with a disabling condition have the right to the highest attainable physical and mental health, to live independently, and to be fully integrated in community life (3). Accordingly, the Convention requires States parties to collect statistical data that can enable them to formulate evidence-based policies that implement human rights.
The International Classification of Functioning, Disability and Health (ICF) (4), which depicts functioning and disability as a complex interaction between an individual‘s health condition and contextual factors (4, 5), is an acknowledged reference model and classification for comprehensive data collection using ICF categories relevant for SCI (6, 7). The guided selection of measurement instruments may ensure the collection of appropriate and valid data on relevant aspects of people‘s lived experience (8). However, representative data collection requires generalized access to registries on persons with SCI and unbiased data collection on functioning from the community-dwelling population with SCI. With the exception of Canada (9), systems to assure the representative collection of data on functioning and community participation of individuals with SCI are currently lacking in most countries. Although the Canadian community survey provides a noteworthy model of a comprehensive approach that aligns with the ICF (10), the opportunistic strategy of recruitment that was primarily based on a national consumer awareness campaign may result in substantial response bias resulting from self-selection (9).
We report here on the first community survey of the Swiss Spinal Cord Injury Cohort Study (SwiSCI) (11), conducted from September 2011 until March 2013. The overall goal of SwiSCI is to gain a better understanding of how to support functioning, health maintenance, and quality of life of people living with SCI in Switzerland along the continuum of care, in the community, and over their lifespan. SwiSCI uses relevant ICF Core Sets as reference sources for data collection (6, 7) and makes use of different pathways to identify and recruit participants, including a retrospective study of medical records, a periodic community survey, and an inception cohort study of newly injured persons (11).
The aim of this paper is to detail the data collection protocol of the first SwiSCI community survey. We specifically report on: (i) the survey protocol, including information on study design, target population and sampling frame (section A, Methods); (ii) overall survey participation and characteristics of the study population; (iii) consistency of self-reported demographic and lesion characteristics with medical record data; (iv) determinants of study participation; and (v) the impact of response bias on selected survey results.
METHODS
A) Survey protocol
Rationale, content and study design. The first SwiSCI community survey (community survey 2012) was conducted between September 2011 and March 2013. The overall rationale and SwiSCI study design is presented in detail elsewhere (11). In brief, the community survey 2012, which it is foreseen will be repeated every 5 years, is instrumental to the establishment of an epidemiological database for SCI that provides reliable data for the comprehensive study of functioning, disability and health; a platform for the evaluation of rehabilitation or policy interventions; as well as an evidence-base to inform Swiss social and health policy with regards to SCI.
The survey collects relevant demographic and lesion characteristics. Domains of functioning are captured with reference to the ICF Core Sets (4), which list ICF categories that are considered key for specified health conditions, or given health conditions in specific healthcare settings (http://www.icf-core-sets.org/). In addition to the Generic Set, which includes basic “must have” information for all disabling conditions (www.icf-research-branch.org), all ICF categories defined in the Brief ICF Core Sets for SCI were assessed. Brief ICF Core Sets include as few categories as possible to be practical, but as many as necessary to be comprehensive in describing the typical spectrum of functional problems in persons with SCI (6, 7). Additional information on psychological-personal factors, health behaviors, work integraton, the care situation and health service utilization was collected (11).
The extensive data collection for the SwiSCI community survey 2012 was operationalized through the use of 3 successive modules in order to keep the questionnaire length manageable for participants and to minimize the risk of non-response bias (12). The 3 modules were sent out with an interval of approximately 3 months: (i) a 19-item questionnaire covering basic socio-demographics, lesion characteristics and the care situation (Starter module); (ii) a 124-item questionnaire covering functioning, health conditions, environmental and personal factors (Basic module); and, finally, (iii) 1 out of 3 thematically specific modules including the 186-item Psychological Personal Factors and Health Behavior Module (PPF-HB module), the 79-item Work Integration module (Work module), and the 202-item Health Services Research module (HSR module) (11). To meet projected minimal sample size requirements for the respective modules, a weighted random generation algorithm was used that apportioned participants in the Basic module in a relative proportion of 0.38:0.31:0.31 to the PPF-HB module, Work module and HSR module. Since the Work module was relevant only to persons of employable age (16–65 years in men; 16–64 years in women), participants beyond employable age, and initially assigned to the Work module, were reallocated to the HSR module, thereby strengthening inference regarding issues of ageing.
To ensure greater response rates and improved coverage of the target population, we applied a mixed-mode data collection design (13, 14). Self-administered response modes included paper-pencil or online questionnaires. Persons with limited hand function or other restriction could also opt for telephone interviews. Postal mailings of successive modules always included an instructive invitation letter in addition to a paper version of the questionnaire with a coversheet containing an individual study ID, personal password for online completion, and contact details of the study centre. Reminder management for the potential participants who did not respond used up to 3 reminders every 4–6 weeks (2 written reminders followed by a telephone reminder). Individuals who explicitly refused participation did not receive reminders. A more detailed account of recruitment procedures is given by Fekete et al. (15).
Target population and sampling frame. SwiSCI includes persons aged 16 years or older, diagnosed with a traumatic or non-traumatic SCI, permanently residing in Switzerland. Exclusion criteria were: congenital conditions leading to SCI, predominantly spina bifida, new SCI in the context of palliative care; neurodegenerative disorders, including multiple sclerosis and amyotrophic lateral sclerosis, and Guillain-Barré syndrome (11).
The SwiSCI community survey 2012 used a broad sampling frame to reach and survey a large and representative sample of the target population. In the absence of a national registry for SCI, a contact database was created by combining the membership records of the organization representing people living with SCI in Switzerland (Swiss Paraplegic Association (SPV)) with available patient records of SCI-specific home care institutions (ParaHelp) as well as 3 out of the 4 specialized SCI-rehabilitation centres (Swiss Paraplegic Center (SPZ), Nottwil; REHAB Basel, Basel; and Clinique Romande de Réadaptation (CCR), Sion) (11). The SPA is the only disabled people’s organization in Switzerland that is specific to SCI. The sampling frame did not include persons with SCI who received first rehabilitation in the fourth specialized centre, the Balgrist clinic in Zürich, although some individuals were recruited through the SPA. In addition, persons with newly acquired SCI who were not eligible for rehabilitation (e.g. end of life care), who incurred lesser or transitory physical impairment from SCI (e.g. patients with American Spinal Injury Association (ASIA) E), or persons with a limited rehabilitation potential (e.g. very elderly individuals) may not have been referred to a specialized rehabilitation centre and therefore could have been missed if not a member of the SPA. Person names and contact details from the contact databases of all recruitment sources were cross-verified to avoid double contacting. The initial invitation to participate to the survey was sent to persons identified through one of the collaborating organizations, prioritizing contact through the SPA over others. For all persons in the contact database, we collected accessible demographic and lesion characteristics for the evaluation of potential response bias to the survey (see Section B below).
Ethics. The SwiSCI study was formally approved by the principal ethics committee on research involving humans of the Canton of Lucerne (for SPC and ParaHelp) and subsequently endorsed by the cantonal ethics committees of Cantons Basel-Stadt (for REHAB Basel) and Valais (CCR). Informed consent to participation in the study was obtained from all subjects prior to data collection and has been documented with a signed consent form.
Data management and data access. All survey data are securely stored on protected data servers at Swiss Paraplegic Research in Nottwil, with data management supervised by the data manager of the SwiSCI Study Center. Personal data of participants are stored separately from the research data using a unique identifier (SwiSCI ID number), allowing linkage of the 2 datasets if required. Personal data are stored to enable individual follow-up or future linkage to other data sources (e.g. medical record data). Data entry and transfer was secured by use of personal ID and password that allowed access to a remote database, while denying access to the central database server.
Questionnaire data received by mail or collected during telephone interviews were entered quickly, facilitating a near real-time monitoring of subject participation and timely management of reminders and mailing of successive questionnaires. At the closure of the survey, a general data check was performed to ensure that all subjects had provided informed consent and met eligibility criteria. Non-eligible subjects and duplicate records of eligible participants were removed from the database. In addition, data were checked for and cleaned of nonsensical responses, which particularly involved incoherent responses by subjects using the paper-pencil questionnaire to connected items with conditional response options. The online form and telephone interview did not allow for such inconsistent responses by conditionally adjusting response options. Obvious mistakes in personal data were generally resolved through cross-checking against medical record data, if not available by requesting explanatory information from the participant. Analytical datasets that are used for specific research purposes are provided with missing data and authors of resultant publications are responsible for the appropriate account for item non-response in statistical analysis (e.g. by using multiple imputation or missForest imputation techniques (16)).
Researchers intending to use survey data for research purposes are obliged to submit a formal research proposal to the SwiSCI Study Center. If judged comprehensive and congruent with the current research agenda, 1 or 2 expert reviewers appraise the research proposal. In their response, authors have to address all comments and revise the research proposal prior to submission to the SwiSCI Steering Committee. Following approval, the data manager governs the access to pseudonymized data. Personal data has been generalized (year of birth, year of SCI, survey year).
B) Data analyses
Statistical analyses were performed using the packages Stata version 13.1 (StataCorp, Texas, USA) and R version 3.1.3 (The R Foundation for Statistical Computing). Reporting of methodology and results follows STROBE guidelines (17).
Descriptive analyses. Basic graphical and statistical methods were used to describe the flow of the recruitment process and characteristics of participants in the successive modules. Participant characteristics included the following: gender; current age (derived using birth date and survey date); years of education; current employment (employed vs not employed); partner status (single vs with partner); time since injury (derived using SCI date and survey date); aetiology (traumatic vs non-traumatic SCI; TSCI vs NTSCI); lesion level (paraplegia vs tetraplegia); and lesion completeness (incomplete vs complete). Additional parameters included documented membership to the SPA (member vs non-member) as well as preferred language of communication (German, French or Italian) and response mode to a given module (online, paper-pencil, telephone interview). Age at survey and time since injury were further classified in line with International Spinal Cord Society (ISCoS) recommendations (18, 19). The number of age classes was mitigated by collapsing the optional ones into 4 classes: less than 5 years, 6–15 years, 16–25 years, and 26 or more years. Lesion severity was indexed as paraplegia incomplete, paraplegia complete, tetraplegia incomplete and tetraplegia complete. Descriptive statistics for the sample distribution included proportions with 95% binomial confidence intervals (CI), and the median with interquartile range for continuous variables. To compare the TSCI and NTSCI populations, we further provided stratified descriptive estimates for key demographics and lesion characteristics and evaluated comparative statistics using unpaired t-tests (continuous variables) and χ2 tests (categorical variables).
Consistency of self-reported demographic and lesion characteristics with medical record data. Record linkage was used for evaluation of the correspondence between self-report and clinical documentation in the participants‘ centre of first rehabilitation for the variables gender, current age (in years), aetiology (traumatic vs non-traumatic), lesion level (paraplegia vs tetraplegia), lesion completeness (incomplete vs complete), and time since injury (in years). We established a dependable link for all persons participating in the Starter module. Clinical information was previously collected as part of the SwiSCI medical record study (11) and information regarding key dates was usually at least available on the annual level (e.g. birth year, year of SCI). We did not consider the medical record information as faultless or the gold standard in analyses, but rather used overall consistency as an index for data quality. Internal consistency was described using cross-tabulation of self-reported and clinical information, ignoring cases where either self-reported or medical record data were not available. The Kappa statistic is also calculated as a measure of reliability, judging values of 0.61–0.80 as “substantial agreement” and 0.81–1.00 as “almost perfect agreement” (20).
Determinants of study participation and impact of response bias on survey results. For all persons in the contact database, we collected existing information for the evaluation of survey non-response. Accessible data from collaborating institutions (clinics and SCI associations) for all invited subjects included age, gender, preferred language (German, French, Italian), membership of SPA, lesion level (paraplegia vs tetraplegia), and time since injury. Mean differences in non-response predictors between participants of respective modules and the source population were calculated with a 95% CI that was based on the pooled variance. In order to evaluate response bias, we used an intention to survey approach and used logistic regression analysis to assess the propensity of response (or participation) to a given module with reference to the original source population (i.e. all eligible persons in the contact database of the Starter module). In order to appropriately account for missing data, a random forest imputation (16, 21) was performed using imputed data for analysis. The response analysis used a multivariable approach, testing the significance of each of the predictors globally using a likelihood ratio test and deriving adjusted odd ratios for response in relation to person characteristics. In case of test significance for parameters with more than 2 levels (i.e. age class, preferred language and time since injury) meaningful differences across levels were evaluated using pairwise comparisons with Bonferroni-adjustment to account for multiple comparisons. For each module, we used multivariable logistic regression to derive propensity scores and corresponding inverse probability weights (IPWs), which serve as sampling weights, in order to correct for unit non-response bias in future data analyses of the 2012 survey data (22–24).
To determine the potential impact of the response bias, we analysed the effect of including IPWs on the overall point estimates of a representative selection of parameters and measurements for each of the survey modules. Differences between the “corrected” (using IPWs) and uncorrected estimates were calculated with 95% CI using bootstrapping with 1,000 replications. Parameters and measures included for the Starter module were the items “Having a partner” (binary variable, proportion) and “Years of education” (continuous, mean). For the Basic module “Having paid employment at time of SCI” (binary, proportion), “Overall quality of life” (binary derived from WHOQol BREF, coding response options: very poor, poor, and neither poor nor good as 0; and good and very good as 1, proportion), and “Using a handbike” (binary, proportion) were used. For the PPF-HB module “Current smoker” (binary current smoker vs non-smoker), and “Overall quality of life” (binary, proportion) were used. For the HSR module “Inpatient hospitalization in past year” (binary, proportion) and “Life satisfaction” (binary derived from ISCoS Quality of Life dataset, combining 10-point Likert scale response options 1–5 as 0 and 6–10 as 1, proportion) were used. And for the Work module “Current paid employment” (binary, proportion) and “Life satisfaction” (binary derived from ISCoS Quality of Life dataset, proportion) were used.
RESULTS
Survey participation and characteristics of the study population
Survey participation. Fig. 1 is a flow chart of study participants through the successive modules of the community survey. Using the contact database, a total of 3,807 persons were invited, of whom 663 were not eligible. A total of 308 persons did not meet inclusion criteria due to an unsuitable medical diagnosis (48%), not being resident in Switzerland (38%) or insufficient language skills (5%). A further 217 persons were deceased prior to invitation. In 88 cases the invitation mail could not be delivered, and 50 addressees were contacted twice. The eligible sample thus consisted of 3,144 persons, of whom 1,922 (61.1%) and 1,549 (49.3%) participated in the Starter module and subsequent Basic module, which in absolute terms received 80.6% response. Among persons not participating in these modules, 69% (n = 845) and 82% (n = 306) explicitly refused, while no contact could be established in the remaining cases. A total of 1,528 out of 1,549 persons who completed the Starter and Basic modules were invited to participate in 1 of the 3 final modules. Participant numbers for the PPF-HB, HSR and Work modules were 511 (89.5%), 492 (84.5%) and 328 (87.0%), which results in a cumulative response rate of 44.1%, 41.8% and 44.2%. Response rates were calculated based on the definitions of the American Association of Public Opinion Research (“Response Rate 5” (25)).
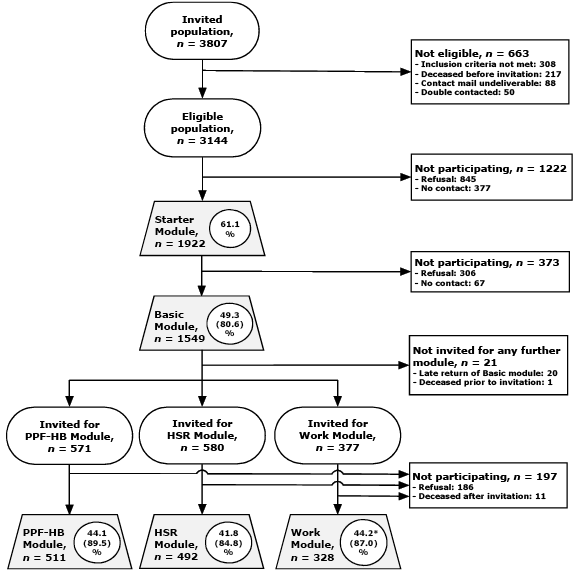
Fig. 1. Participation and non-participation in the successive modules of the 2012 community survey. Legend: ovals, invited groups; rectangular symbols, excluded or non-participating groups; grey trapezoids, participating groups. Percentages in circles within trapezoids indicate the cumulative participation rate, in brackets the participation rate for a given module. Cumulative participation rate for Work module (*) was calculated including 2,352 persons in employable age, who showed 50.8% cumulative participation to the Basic module.
Characteristics of the study population. Table I provides an overview of key demographic and lesion characteristics for all modules. The majority of participants were male, ranging from 70.4% to 72.6% for the Work and PPF-HB module. The median age was similar, at 52 or 53 years for the Starter, Basic and PPF-HB modules. Related to redistribution of persons who were beyond employable age (see Survey protocol), median age was 5 years higher or lower for the HSR and Work module, respectively. The predominant age category was typically 46–60 years, but 61–75 years in the HSR module. The mean duration of education was 13 years. Most participants reported living with a partner, ranging from 65.7% to 71.8% for the Starter and HSR modules. Current employment in participants in employable age ranged between 52.9% and 56.5%; membership of the SPA between 68.9% and 79.9% across modules.
|
Table I. Characteristics of participants in the different modules of the Swiss Spinal Cord Injury Cohort Study (SwiSCI) community survey |
|||||
|
Parameter Indicator variable [missinga] |
Starter module (n = 1,922) n (%; 95% CI) |
Basic module (n = 1,549) n (%; 95% CI) |
Psychological Personal Factors and Health Behavior module (n = 511) n (%; 95% CI) |
Health Services Research module (n = 492) n (%; 95% CI) |
Work Integration module (n = 328) n (%; 95% CI) |
|
Gender [0] |
|
|
|
|
|
|
Female |
546 (28.4; 26.4–30.5) |
442 (28.5; 26.3–30.8) |
140 (27.4; 23.7–31.4) |
142 (28.9; 25.0–33.0) |
97 (29.6; 24.9–34.8) |
|
Male |
1,376 (71.6; 69.5–73.6) |
1,107 (71.5; 69.2–73.7) |
371 (72.6; 68.6–76.3) |
350 (71.1; 67.0–75.0) |
231 (70.4; 65.2–75.1) |
|
Age class at time of survey [0]† |
|
|
|
|
|
|
16–30 years |
168 (8.7; 7.6–10.1) |
129 (8.3; 7.1–9.8) |
43 (8.4; 6.3–11.2) |
29 (5.9; 4.1–8.4) |
30 (9.2; 6.5–12.8) |
|
31–45 years |
468 (24.4; 22.5–26.3) |
377 (24.3; 22.3–26.5) |
108 (21.1; 17.8–24.9) |
103 (20.9; 17.6–24.8) |
111 (33.8; 28.9–39.2) |
|
46–60 years |
681 (35.4; 33.3–37.6) |
571 (36.9; 34.5–39.3) |
201 (39.3; 35.2–43.7) |
150 (30.5; 26.6–34.7) |
157 (47.9; 42.5–53.3) |
|
61–75 years |
464 (24.1; 22.3–26.1) |
378 (24.4; 22.3–26.6) |
125 (24.5; 20.9–28.4) |
175 (35.6; 31.4–39.9) |
30 (9.2; 6.5–12.8) |
|
≥ 76 years |
141 (7.3; 6.3–8.6) |
94 (6.1; 5–7.4) |
34 (6.7; 4.8–9.2) |
35 (7.1; 5.1–9.8) |
n.a. |
|
Partner status [79] |
|
|
|
|
|
|
Single |
633 (34.3; 32.2–36.5) |
483 (32.5; 30.1–34.9) |
163 (33.1; 29.1–37.4) |
131 (28.2; 24.3–32.5) |
100 (31.2; 26.3–36.5) |
|
With partner |
1,210 (65.7; 63.5–67.8) |
1,004 (67.5; 65.1–69.9) |
329 (66.9; 62.6–70.9) |
334 (71.8; 67.5–75.7) |
221 (68.9; 63.5–73.7) |
|
Current employment [0]b |
|
|
|
|
|
|
Not employed |
687 (47.1; 44.6–49.7) |
534 (44.6; 41.8–47.4) |
178 (45.9; 41.0–50.9) |
140 (43.5; 38.1–49.0) |
147 (44.8; 39.5–50.3) |
|
Employed |
771 (52.9; 50.3–55.4) |
664 (55.4; 52.6–58.2) |
210 (54.1; 49.1–59.0) |
182 (56.5; 51.0–61.9) |
181 (55.2; 49.7–60.5) |
|
Membership SPA [0] |
|
|
|
|
|
|
Non-member |
598 (31.1; 29.1–33.2) |
448 (28.9; 26.7–31.2) |
140 (27.4; 23.7–31.4) |
161 (32.7; 28.7–37.0) |
66 (20.1; 16.1–24.8) |
|
Member |
1,324 (68.9; 66.8–70.9) |
1,101 (71.1; 68.8–73.3) |
371 (72.6; 68.6–76.3) |
331 (67.3; 63.0–71.3) |
262 (79.9; 75.2–83.9) |
|
Aetiology [19] |
|
|
|
|
|
|
Traumatic |
1,491 (78.4; 76.4–80.1) |
1,202 (78.4; 76.2–80.3) |
400 (78.6; 74.8–81.9) |
373 (76.6; 72.6–80.2) |
269 (83.0; 78.5–86.7) |
|
Non-traumatic |
412 (21.6; 19.9–23.6) |
332 (21.6; 19.7–23.8) |
109 (21.4; 18.1–25.2) |
114 (23.4; 19.8–27.4) |
55 (17.0; 13.3–21.5) |
|
Lesion severity [27]c |
|
|
|
|
|
|
Paraplegia, incomplete |
723 (38.1; 36.0–40.4) |
577 (37.5; 35.2–40.0) |
184 (36.2; 32.1–40.5) |
191 (39.2; 34.9–43.6) |
119 (36.5; 31.4–41.9) |
|
Paraplegia, complete |
583 (30.8; 28.7–32.9) |
486 (31.6; 29.3–34.0) |
166 (32.7; 28.7–36.9) |
147 (30.1; 26.2–34.4) |
110 (33.7; 28.8–39.1) |
|
Tetraplegia, incomplete |
392 (20.7; 18.9–22.6) |
314 (20.4; 18.5–22.5) |
102 (20.1; 16.8–23.8) |
105 (21.5; 18.1–25.4) |
56 (17.2; 13.4–21.7) |
|
Tetraplegia, complete |
197 (10.4; 9.1–11.9) |
160 (10.4; 9.0–12.0) |
56 (11.0; 8.6–14.1) |
45 (9.2; 6.9–12.1) |
41 (12.6; 9.4–16.7) |
|
Time since injury class [40]d |
|
|
|
|
|
|
≤ 5 years |
372 (19.8; 18–21.6) |
308 (20.2; 18.3–22.3) |
100 (19.8; 16.5–23.5) |
103 (21.5; 18.0–25.4) |
58 (17.9; 14.0–22.4) |
|
6– 15 years |
628 (33.4; 31.3–35.5) |
493 (32.4; 30.1–34.8) |
162 (32.0; 28.1–36.2) |
159 (33.1; 29.0–37.5) |
100 (30.8; 26.0–36.0) |
|
16– 25 years |
425 (22.6; 20.7–24.5) |
332 (21.8; 19.8–24.0) |
104 (20.6; 17.2–24.3) |
99 (20.6; 17.2–24.5) |
83 (25.5; 21.1–30.6) |
|
≥ 26 years |
457 (24.3; 22.4–26.3) |
389 (25.6; 23.4–27.8) |
140 (27.7; 23.9–31.7) |
119 (24.8; 21.1–28.9) |
84 (25.9; 21.4–30.9) |
|
Preferred language [0] |
|
|
|
|
|
|
German |
1,379 (71.8; 69.7–73.7) |
1,088 (70.2; 67.9–72.5) |
361 (70.7; 66.5–74.4) |
342 (69.5; 65.3–73.4) |
227 (69.4; 64.2–74.2) |
|
French |
462 (24.0; 22.2–26) |
391 (25.2; 23.1–27.5) |
129 (25.2; 21.7–29.2) |
126 (25.6; 21.9–29.7) |
80 (24.5; 20.1–29.4) |
|
Italian |
81 (4.2; 3.4–5.2) |
70 (4.5; 3.6–5.7) |
21 (4.1; 2.7–6.2) |
24 (4.9; 3.3–7.2) |
20 (6.1; 4.0–9.3) |
|
Response mode [0] |
|
|
|
|
|
|
Online |
438 (22.8; 21.0–24.7) |
650 (42.0; 39.5–44.4) |
218 (42.7; 38.4–47.0) |
181 (36.8; 32.6–41.2) |
154 (47.1; 41.7–52.5) |
|
Paper-pencil |
1,282 (66.7; 64.6–68.8) |
883 (57.0; 54.5–59.5) |
291 (57.0; 52.6–61.2) |
310 (63.0; 58.6–67.2) |
169 (51.7; 46.2–57.1) |
|
Telephone interview |
202 (10.5; 9.2–12) |
16 (1.0; 0.6–1.7) |
2 (0.4; 0.1–1.6) |
1 (0.2; 0.0–1.4) |
4 (1.2; 0.5–3.2) |
|
Table I. Contd. |
|||||
|
Continuous variable [missing$] |
Mean (SD); Median (IQR) |
Mean (SD); Median (IQR) |
Mean (SD); Median (IQR) |
Mean (SD); Median (IQR) |
Mean (SD); Median (IQR) |
|
Age at time of survey, years [0] |
52.6 (15.3); 52 (42–64) |
52.3 (14.8); 52 (42–63) |
52.9 (14.8); 53 (43–64) |
55.3 (15.1); 57 (44–67) |
46.8 (10.7); 47 (40–56) |
|
Years of education [54] |
13.4 (3.4); 13 (12–15) |
13.6 (3.3); 13 (12–15) |
13.8 (3.3); 13 (12–16) |
13.4 (3.1); 13 (12–15) |
13.8 (3.1); 13 (12–16) |
|
Age at injury, years [40] |
35.9 (17.4); 32 (21–48) |
35.4 (17.4); 31 (21–47) |
35.4 (17.6); 32 (20–46) |
38.7 (18.2); 35 (22–54) |
29.4 (12.5); 27 (20–37) |
|
Years since injury [40] |
16.7 (12.4); 14 (6–24) |
16.9 (12.7); 14 (6–25) |
17.5 (13.1);14 (7–26) |
13.4 (3.1); 12 (6–25) |
17.5 (12.0); 16 (7–26) |
|
a[missing]: n missing in Starter module; percentages exclude missing values; bstatistics including persons in employable age only (males 16–64 years; women 16–63 years); clesion level missing in 23, degree (completeness) in 16; dclassification of age class and time since injury cf. International Spinal Cord Society (ISCoS) recommendations. IQR: interquartile range; 95% CI: 95% confidence interval; SD: standard deviation; SPA: Swiss Paraplegic Association. |
|||||
The predominantly reported aetiology was traumatic SCI by approximately 78% of participants, with the sample for the Work module showing the highest proportion at 83% (Table I). Incomplete paraplegia was the most commonly reported lesion severity (range across modules 36.2–39.2%), followed by complete paraplegia (30.1–33.7%), incomplete tetraplegia (17.2–21.5%) and complete tetraplegia (9.2–12.6%). Correspondingly, the portions of paraplegia varied between 68.9% and 70.2%, and of lesion incompleteness between 53.7% and 60.7%. The median time since injury (bottom of table) ranged between 12.3 and 15.7 years across modules, the predominant time since injury class being 6–15 years.
German was the most common language for survey response (69.4–71.8%), followed by French (24.0–25.6%) and Italian (4.1–6.1%; Table I). Participants showed an overall preference for response by paper-pencil questionnaire; markedly so for the short, 19-item Starter module (66.7%). In responding to subsequent modules between 36.8% and 47.1% of participants opted for online completion compared with 22.8% for the Starter module. Telephone interview was only prominent at 10.5% for the Starter module.
Traumatic vs non-traumatic sample. There are substantial differences in demographic and lesions characteristics between participants with TSCI and NTSCI (Table II). Compared with NTSCI, participants with TSCI were more frequently male (76.3% vs 53.9%) and on average 9 years younger (median age 51 vs 60 years), with 46–60 years vs 61–75 years as predominant age classes. In addition, the median time since injury was approximately 8 years longer in participants with TSCI (16.6 vs 8.3 years in TSCI and NTSCI, respectively). Nearly 54% of participants with TSCI live with their injury since 16 or more years compared with 25% of participants with NTSCI. Finally, predominant lesion severity classes following TSCI were complete paraplegia (35.1%) and incomplete paraplegia (30.7%), whereas the latter class was markedly predominant following NTSCI (62.0%).
|
Table II. Comparison of characteristics of participants to the Basic module by aetiology (traumatic vs non-traumatic spinal cord injury (SCI)) |
|||
|
Parameter Indicator variable a[missing] |
Traumatic SCI (n = 1,202) n (%; 95% CI) |
Non-traumatic SCI (n = 332) n (%; 95% CI) |
p-valueb |
|
Gender [0] |
|
|
< 0.001 |
|
Female |
285 (23.7; 21.4–26.2) |
153 (46.1; 40.8–51.5) |
|
|
Male |
917 (76.3; 73.8–78.6) |
179 (53.9; 48.5–59.2) |
|
|
Age class[0] |
|
|
< 0.001 |
|
16–30 years |
105 (8.7; 7.3–10.5) |
22 (6.6; 4.4–9.9) |
|
|
31–45 years |
328 (27.3; 24.8–29.9) |
45 (13.5; 10.3–17.7) |
|
|
46 –60 years |
463 (38.5; 35.8–41.3) |
103 (31.0; 26.3–36.2) |
|
|
61–75 years |
251 (20.9; 18.7–23.3) |
123 (37.1; 32.0–42.4) |
|
|
≥ 76 years |
55 (4.6; 3.5–5.9) |
39 (11.8; 8.7–15.7) |
|
|
Time since injury class [19] |
|
|
< 0.001 |
|
≤ 5 years |
197 (16.6; 14.5–18.8) |
110 (33.9; 29.0–39.3) |
|
|
6–15 years |
355 (29.8; 27.3–32.5) |
134 (41.4; 36.1–46.8) |
|
|
16–25 years |
286 (24.0; 21.7–26.5) |
46 (14.2; 10.8–18.5) |
|
|
≥ 26 years |
353 (29.6; 27.1–32.3) |
34 (10.5; 7.6–14.4) |
|
|
Lesion severity [27] |
|
|
< 0.001 |
|
Paraplegia, incomplete |
368 (30.7; 28.1–33.3) |
204 (62.0; 56.6–67.1) |
|
|
Paraplegia, complete |
421 (35.1; 32.4–37.8) |
64 (19.5; 15.5–24.1) |
|
|
Tetraplegia, incomplete |
261 (21.8; 19.5–24.2) |
51 (15.5; 12.0–19.9) |
|
|
Tetraplegia, complete |
150 (12.5; 10.7–14.5) |
10 (3.0; 1.6–5.6) |
|
|
Continuous variable a[missing] |
Mean (SD); median (IQR) |
Mean (SD); median (IQR) |
|
|
Age at survey, years [0] |
50.7 (14.2); 51 (41–61) |
58.1 (15.6); 60 (48–70) |
< 0.001 |
|
Years since injury [19] |
18.4 (12.8); 17 (7–27) |
11.3 (10.4); 8 (4–15) |
< 0.001 |
|
Age at injury, years [19] |
32.3 (15.3); 28 (20–42) |
46.7 (19.6); 50 (32–63) |
< 0.001 |
|
a[missing]: n missing in Basic module; percentages exclude missing values; bfrom χ2 test (indicator variables) or t-test (continuous variables). IQR: interquartile range; 95% CI: 95% confidence interval; SD: standard deviation. |
|||
Consistency of self-reported demographic and lesion characteristics with medical record data
Using record linkage, we established a link with the medical record data for 1,284 out of 1,922 persons participating in the Starter module. There were 3 (0.2% of established links) mismatches for gender and 7 (0.4%) for current age, indicating close to 100% internal consistency for demographic parameters. Similarly, year of SCI showed almost perfect reliability (value of Kappa = 0.94) with contradiction between self-report and medical record in 37 cases (2.9%). Aetiology was mismatched in 38 (3.0%) cases, with approximately equal proportions of self-reported causes of SCI as traumatic (52.6%; n = 20) or non-traumatic (47.4% ; n = 18) showing reverse causation in the medical record data. Inconsistency in lesion level was found for 59 cases (4.6%), for which 42.4% (n = 25) and 57.6% (n = 34) of self-reported paraplegia or tetraplegia contrasted with the available medical record data. For a total of 157 (n = 12.2%) datasets, the completeness of the lesion showed inconsistency, involving 47.1% (n = 74) and 52.9% (n = 83) of the self-reported incomplete and complete lesions. Consequentially, lesion severity (combination of level and completeness) was inconsistent between self-report and medical record in 15.9% of cases. Reliability as measured by value of Kappa indicated almost perfect agreement for aetiology (0.91) and lesion level (0.89) and substantial agreement for lesion completeness (0.74) and lesion severity (0.77).
Determinants of study participation
Table III illustrates the extent of potential participation bias using the difference in the distribution of key demographic and lesion characteristics between the source population and the participant‘s sample in each of the modules. The mean difference in the proportion of females between the modules and the respective source population (invited sample) ranged from –2.12% (95% CI: –2.15 to –2.08) and 3.23% (3.18 to 3.27) in the PPF-HB and the Work module, respectively. Likewise, the mean difference in current age ranged between –0.58 to 2.55 years in the Basic and the HSR module; the proportion with paraplegia between 0.48% and 1.91% in the PPF-HB and the Work module; and the time since injury was between 0.51 and 1.43 years in the Starter and the Work module. The proportion of participants with SPA membership was systematically higher in all modules compared with the invited sample, with the difference ranging from 2.80% in the HSR and 8.71% in the Work module. Finally, the proportion of German-speaking participants in any of the modules showed only minor differences from the initial survey population (i.e. ranging from –0.77% to 0.62%).
|
Table III. Comparison of means and proportions between total invited and sampled study participants |
||||||
|
|
Female, proportion |
Age, years |
Paraplegia, proportion |
Time since SCI, years |
SPA membership, proportion |
German-speaking, proportion |
|
Total eligible (n = 3,144; in employable age n = 2,352) |
|
|
|
|
|
|
|
Mean |
29.52 |
53.01 |
68.29 |
15.90 |
64.47 |
70.13 |
|
Mean in employable age group |
26.96 |
46.56 |
68.42 |
15.84 |
71.17 |
70.28 |
|
Starter module |
|
|
|
|
|
|
|
Mean |
28.30 |
52.70 |
68.87 |
16.41 |
68.83 |
69.82 |
|
Difference to total |
–1.21 |
–0.31 |
0.59 |
0.51 |
4.36 |
–0.31 |
|
95% CI for difference |
–1.23 to –1.20 |
–0.75 to 0.13 |
0.57 to 0.60 |
0.21 to 0.81 |
4.35 to 4.38 |
–0.32 to 0.30 |
|
Basic module |
|
|
|
|
|
|
|
Mean |
28.53 |
52.43 |
69.08 |
16.69 |
71.01 |
70.17 |
|
Difference to total |
–0.98 |
–0.58 |
0.80 |
0.78 |
6.54 |
0.04 |
|
95% CI for difference |
–1.00 to –0.97 |
–1.14 to –0.03 |
0.78 to 0.81 |
0.38–1.18 |
6.52 to 6.56 |
0.02 to 0.06 |
|
PPF-HB module |
|
|
|
|
|
|
|
Mean |
27.40 |
53.05 |
68.76 |
17.22 |
72.60 |
70.65 |
|
Difference to total |
–2.12 |
0.04 |
0.48 |
1.31 |
8.13 |
0.51 |
|
95% CI for difference |
–2.15 to –2.08 |
–1.15 to 1.23 |
0.44 to 0.51 |
0.32 to 2.31 |
8.09 to 8.17 |
0.48 to 0.55 |
|
HSR module |
|
|
|
|
|
|
|
Mean |
28.46 |
55.56 |
69.11 |
16.45 |
67.28 |
69.51 |
|
Difference to total |
–1.06 |
2.55 |
0.82 |
0.55 |
2.80 |
0.62 |
|
95% CI for difference |
–1.10 to –1.02 |
1.31 to 3.78 |
0.78 to 0.86 |
–0.47 to 1.58 |
2.77 to 2.84 |
0.58 to 0.66 |
|
Work module |
|
|
|
|
|
|
|
Mean |
30.18 |
46.82 |
70.33 |
17.27 |
79.88 |
69.51 |
|
Difference to totala |
3.23 |
0.25 |
1.91 |
1.43 |
8.71 |
–0.77 |
|
95% CI for difference |
3.18 to 3.27 |
–0.85 to 1.36 |
1.87 to 1.96 |
0.22 to 2.64 |
8.66 to 8.75 |
–0.82 to –0.72 |
|
aOnly including men younger than 65 years or women younger than 64 years in comparison (employable age group). SCI: spinal cord injury; 95% CI: 95% confidence interval; SPA: Swiss Paraplegic Association; HSR: Health Services Research; PPF-HB: Psychological Personal Factors and Health Behavior Module. |
||||||
Adjusted odds ratios (OR) from multivariable logistic regression analyses showed participation to the Starter and the Basic module to be most strongly related to membership of the SPA, with members of the SPA being, in mean, 1.7 and 1.8 times more likely to participate than non-members (Table IV). A strong association was also seen with time since injury; compared with the most recently injured group (0–5 years), groups living with SCI since 6–15 years or 16–25 years showed lower OR of participation, while the group living with SCI since 26 or more years showed higher OR (post-hoc pairwise comparisons, all p-values < 0.01). Age further affected participation to the Basic module, revealing lower adjusted OR in persons aged 76 and older (post-hoc p-value < 0.01), while other age groups showed similar OR of participation (all post-hoc p-values > 0.2). Gender and preferred language were not associated with participation (Table IV). Alternative analyses that modelled the continuous variables age and time since injury flexibly using fractional polynomials gave similar results (not shown). Further, analysis of predictors of participation to the PPF-HB, the HSR or the Work module gave similar results than demonstrated for the Basic Module (results not shown; available from authors on request).
|
Table IV. Response analysis: predictors of participation to the Starter or the Basic module |
|||||
|
Parameter |
Starter module |
|
Basic module |
||
|
Adjusted odds ratio (95% CI) |
p-value* |
|
Adjusted odds ratio (95% CI) |
p-valuea |
|
|
Gender |
|
0.19 |
|
|
0.70 |
|
Male |
1.00 |
|
|
1.00 |
|
|
Female |
0.90 (0.76 to 1.05) |
|
|
0.97 (0.83 to 1.14) |
|
|
Age |
|
0.33 |
|
|
< 0.01 |
|
16–30 years |
1.00 |
|
|
1.00 |
|
|
31–45 years |
1.03 (0.76 to 1.39) |
|
|
1.16 (0.86 to 1.55) |
|
|
46–60 years |
1.01 (0.75 to 1.36) |
|
|
1.23 (0.92 to 1.65) |
|
|
61–75 years |
0.99 (0.73 to 1.35) |
|
|
1.15 (0.85 to 1.54) |
|
|
≥ 76 years |
0.76 (0.53 to 1.09) |
|
|
0.70 (0.49 to 1.01) |
|
|
Membership SPA |
|
< 0.0001 |
|
|
< 0.0001 |
|
Non-member |
1.00 |
|
|
1.00 |
|
|
Member |
1.66 (1.41 to 1.96) |
|
|
1.76 (1.49 to 2.07) |
|
|
Preferred language |
|
0.12 |
|
|
0.18 |
|
German |
1.00 |
|
|
1.00 |
|
|
French |
1.04 (0.87 to 1.23) |
|
|
0.99 (0.84 to 1.17) |
|
|
Italian |
1.51 (1.01 to 2.26) |
|
|
1.41 (0.97 to 2.05) |
|
|
Lesion level |
|
0.45 |
|
|
0.41 |
|
Paraplegia |
1.00 |
|
|
1.00 |
|
|
Tetraplegia |
0.94 (0.80 to 1.10) |
|
|
0.94 (0.80 to 1.09) |
|
|
Time since injury |
|
< 0.0001 |
|
|
< 0.0001 |
|
≤ 5 years |
1.00 |
|
|
1.00 |
|
|
6–15 years |
0.60 (0.49 to 0.73) |
|
|
0.61 (0.50 to 0.74) |
|
|
16–25 years |
0.44 (0.36 to 0.55) |
|
|
0.46 (0.37 to 0.58) |
|
|
≥ 26 years |
1.28 (0.98 to 1.67) |
|
|
1.18 (0.92 to 1.51) |
|
|
ap-values are derived from global Wald tests. 95% CI: 95% confidence interval; SPA: Swiss Paraplegic Association. |
|||||
Sensitivity analyses comparing propensity scores between participants and non-participants revealed well-balanced scores over the full range as well as general absence of outlier scores (Fig. S11). The largest proportional difference in sampling weight (or IPWs) for a given module, which indicates the maximal breadth of sampling disparity in relation to person characteristics between any 2 participants, ranged from 2.5 for the Starter Module to 4.8 for the HSR Module (Table S11).
Impact of response bias on selected survey results
Point estimates for selected parameters of the different survey modules were to a lesser extent affected by the use of IPWs (Table V). The corrected point estimate for the continuous parameter “Years of education” was less than 0.05 years below the uncorrected estimate. The mean difference between the uncorrected and corrected estimates for binary parameters describing percentages was in absolute terms generally below 1%, with the corresponding 95% CI never exceeding 2.5%. Only the weighted estimates for the Basic module items “Having paid employment at time of SCI” and “Using a handbike” showed slightly larger mean difference at 1.2% (0.1 to 2.2) and –1.5% (–2.0 to –1.1).
|
Table V. Impact of correcting for non-response bias using inverse probability weights on point estimates of selected parameters in various survey modules |
|||||
|
Module, parameter |
Sample estimate |
|
Difference |
95% CI |
|
|
Uncorrected |
Corrected |
|
|||
|
Starter module |
|
|
|
|
|
|
Having a partner (%) |
65.65 |
65.24 |
|
–0.41 |
–0.83 to –0.01 |
|
Education (years; mean) |
13.40 |
13.34 |
|
–0.06 |
–0.09 to –0.03 |
|
Basic module |
|
|
|
|
|
|
Having paid employment at time of SCI (%)a |
75.23 |
75.89 |
|
0.66 |
0.29 to 2.57 |
|
Quality of life (good or very good; %)b |
59.57 |
59.45 |
|
–0.13 |
–0.76 to 0.48 |
|
Using a handbike (%) |
23.29 |
21.85 |
|
–1.44 |
–1.90 to –1.00 |
|
PPF-HB module |
|
|
|
|
|
|
Current smoker (%) |
25.00 |
24.96 |
|
–0.04 |
–1.03 to 1.02 |
|
Quality of life (good or very good; %)b |
63.71 |
63.66 |
|
–0.05 |
–1.18 to 1.12 |
|
HSR module |
|
|
|
|
|
|
Inpatient hospitalization in past year (%) |
35.86 |
35.05 |
|
–0.81 |
–2.41 to 0.64 |
|
Life satisfaction (6–10 on 0–10 scale; %)c |
81.82 |
82.09 |
|
0.27 |
–0.97 to 1.36 |
|
Work module |
|
|
|
|
|
|
Current paid employment (%) |
57.94 |
58.27 |
|
0.33 |
–1.34 to 1.96 |
|
Life satisfaction (6–10 on 0–10 scale; %)c |
78.34 |
77.81 |
|
–0.53 |
–2.12 to 0.81 |
|
aIncluding only persons of employable age at time of SCI; bbinary-transformed item from WHOQol-5; cbinary-transformed item from International Spinal Cord Society (ISCoS) Dataset Quality of Life. SCI: spinal cord injury; 95% CI: 95% confidence interval; HSR: Health Services Research; PPF-HB: Psychological Personal Factors and Health Behavior Module. |
|||||
DISCUSSION
We have provided here an in-depth description of the study protocol, the recruitment procedure, characteristics of the study population, non-response bias and data quality of the SwiSCI community survey 2012. This descriptive analysis demonstrates that the design was efficient in sampling and recruiting a substantial proportion of the target population; that self-reported demographics and SCI characteristics showed good consistency with available medical record data; and that response bias with regards to available person characteristics was restrained and had minor impact on selected survey results. The SwiSCI community survey 2012 thereby fulfilled important general quality criteria for survey data and provides a representative collection of empirical data to evaluate the lived experience of people with SCI in Switzerland.
With an initial mail order to over 3,100 eligible recipients, the SwiSCI survey represents one of the largest community surveys performed to date in the context of SCI. By coincidence, the effective sample size of 1,549 participants who completed the core of the survey (Starter and Basic modules) was exactly the inclusion number of the recent Canadian SCI community survey (9), but given the nearly 6-fold difference in adult population size between Canada and Switzerland, as well as the markedly high Canadian SCI prevalence (26), the coverage of the Swiss survey was likely significantly higher. Based on current prevalence estimates (27), the Canadian survey covered only approximately 2% of the prevalent SCI population, which strongly limits its representativeness. Currently, no reliable estimate of the prevalent SCI population in Switzerland exists, but conservatively using the highest prevalence rate for TSCI among European countries (Iceland, 526/million) and the best empirical estimate for NTSCI (Australia, 367/million) (26), our estimate of the prevalence of any SCI in the 2012 Swiss adult population (approximately 6.7 million persons) is at nearly 6,000 persons. Thus, our invitation to the survey probably addressed over 50% of the total Swiss SCI population, with participation to the core modules representing at least 25%. As the restrictive SwiSCI inclusion criteria reduced the actual reference population, both statistics are plausibly underestimates, yet currently of unknown extent.
Demographic and lesion characteristics of our participants appear similar to reports on the SCI community in other countries with comparable socioeconomic and healthcare conditions. However, as most reports are based on the population admitted or discharged from first rehabilitation, often restricted to TSCI (26, 28, 29), few reports allow an unbiased comparison, given the differential life expectancy following SCI in relation to demographic characteristics and lesion severity (2). Comparison with the Canadian SCI community survey (9) indicates that for prevalent cases of SCI in the community, the mean age at survey is approximately 50 years (Canada 49.6 vs SwiSCI Basic module 52.3), while the typical gender distribution is approximately 70% men (67.2% vs 71.5% male). Furthermore, within the SCI community, between 42.2% and 30.6% are tetraplegics (Canada vs Switzerland); this is generally in line with hospital-based studies on incident cases, with a smaller proportion of tetraplegics compared with paraplegics (30).
We found considerable differences in demographic and lesion characteristics between TSCI and NTSCI in the SwiSCI community survey 2012. These findings were similar to the evidence presented in the Canadian survey regarding prevalence of TSCI (Canada 73.4% vs Switzerland, Basic module 78.4%), male gender in TSCI (70.9% vs 76.3%) and NTSCI, where more even distribution between genders is observed (57.0% vs 53.9%). Typically, a larger proportion of incomplete lesions are reported for NTSCI cases, approximately 80% (82.5% vs 76.8%), while the TSCI cases exhibit the highest proportion of complete lesions with roughly 43% (39.1% vs 47.5%). In comparison with studies of incident cases of NTSCI and TSCI, similarities exist although it is again important to note that within the community there is inherently a bias towards less severe injuries, or non-terminal diseases. This is demonstrated most notably in the mean age of SCI. A recent study by Jain et al. (28) found a mean age at TSCI in 2012 of 51 years, while the mean age at injury for the SwiSCI survey 2012 was much lower at 32.4 years. Similarly, a study by New et al. (30) found a median age of 46 years (interquartile range; IQR 29–67 years) for incident TSCI cases, again higher than that reported in SwiSCI (28; 20–42), although the median age for NTSCI cases was closer to that reported here (67 vs 50). However, across study populations, the well-documented trend remains of TSCI being concentrated in younger populations and NTSCI in older populations (26). Incident cases of TSCI indicate a more diverse pattern in terms of severity of lesion, with the proportion of cervical injuries ranging from 40% to 60% (31), once more reflecting the potential influence of survivor bias in community surveys.
The demographic and lesion characteristics of the survey participants are highly reliable, with substantial to almost perfect agreement between self-report and medical record data. This is an important finding, as it provides credibility for the use of self-reported lesion traits in evaluating survey data, evidence that to the best of our knowledge was not provided by previous studies in SCI. The largest discrepancy was observed for lesion completeness, which might indicate that some participants had difficulty discriminating between a motor and sensory complete lesion that was discriminated in the questionnaire from having a lesion with partial preservation of motor or sensory function below the lesion level. Yet, errors in the medical record cannot be excluded. Irrespective of the origin of the discrepancy, it is important to note that the discrepancy in classification of lesion characteristics was non-differential, as the approximately equal proportions of persons reported lesion level as paraplegia or tetraplegia, respectively, lesion completeness as incomplete or complete, in contradiction to the medical record. Bias in descriptive analysis of lesion characteristics is probably minimal due to the counterbalancing effect of the mismatch on average statistics. Yet, non-differential misclassification may modify estimates of effect sizes in association studies using lesion characteristics as exposure or as mediator for outcomes of interest (32, 33). Sensitivity analysis, uncertainty analysis, and Bayesian analysis may be used to evaluate and minimize the risk of information bias in future studies using data from the SwiSCI community survey 2012 (34).
Empirical assessments over the past decade have led to the recognition that the quality or representativeness of a survey is primarily related to the degree to which sampled respondents differ from the survey population as a whole, rather than response rates per se. Thus, a survey with a fairly high response rate, albeit with substantial non-response bias, might produce far more biased results than a survey with a lower response rate from a truly random and representative group of respondents (35–37). We have provided substantial evidence that this study is subject to minimal non-response bias, and for the main module has a relatively good response rate of nearly 50%. The higher response rate by members of the SPA may reflect many different factors, such as members being more likely to be active in the SCI community (e.g. wheelchair clubs, social activities, general interest in community membership), which is likely to affect the propensity of an individual to participate in a survey focused on the lived experience of persons with SCI. The use of the sampling weights (IPWs) counteracts the over-sampling of SPA members, as demonstrated for handbike usage, for which the population average estimates declined when including sampling weights.
In terms of the findings on time since injury, it is more speculative to explain how short- or long-duration following injury is associated with higher response rates, although a potential explanation could be related motivation to contribute to the understanding of SCI in more recently injured, as well as potential selection bias related to long-term survivors. Although the impact of non-response bias is minor, the IPWs are nonetheless provided for all survey modules so as to improve statistical inference as part of sensitivity analyses in future studies.
Strengths and limitations
One of the major strengths of SwiSCI community survey 2012 is the sample size and coverage that gives statistical power for contemporary analyses of relevant aspects of daily living of people with SCI in Switzerland. Furthermore, this study uses a comprehensive data model based on the ICF, allowing for coverage of all aspects of functioning, health, contextual factors and quality of life considered relevant for people with SCI. This is one of the first studies quantifying non-response in SCI research, although a potential limitation related to non-response bias could be that not all variables are included or assessed by the community survey that could affect non-response (e.g. completeness of lesion, socioeconomic variables, general health). A potential limitation is that individuals with a lesser or transitory physical impairment from SCI (e.g. patients with ASIA E) and those with limited rehabilitation potential may not have been referred to a specialized rehabilitation centre and would therefore have been missed if they were not member of the SPA. Furthermore, we were unable to recruit individuals directly from the Balgrist clinic, which accounts for approximately 18% of individuals who meet SwiSCI inclusion criteria. Although this affects sample completeness, the impact on the generalizability of future analyses of functioning after SCI is conceivably limited given the comparability in guidelines and practice of first rehabilitation across the 4 specialized clinics in Switzerland. A final strength is that many key demographic and lesion characteristics were evaluated in both the community survey and the medical records review, allowing assessment of the potential magnitude of differential misclassification. Given the extent of non-differential misclassification, the risk is low for biased results in future analyses using the SwiSCI community survey data.
Conclusion
In summary, the SwiSCI community survey 2012 was effective in recruiting an unbiased sample of the prevalent SCI community in Switzerland. Using a contacts database established through multiple sources, including the major association representing persons with SCI as well as specialized rehabilitation centres for SCI, and a mixed-mode design and active participant follow-up, this study reached a substantial and representative proportion of the prevalent SCI population. In addition, self-reported demographic and lesion characteristics have demonstrated reliability and are thus of good quality. Therefore, this study is well-positioned to support functioning, health maintenance, and quality of life of people living with SCI in Switzerland.
ACKNOWLEDGEMENTS
This study has been financed in the framework of the SwiSCI study, supported by the Swiss Paraplegic Research.
The authors would like to specially thank the staff of the SwiSCI study centre for their efforts in recruitment, in particular Wolfgang Segerer for development and maintenance of a survey database that allowed for real-time management of reminders to late responders. We are grateful to all the participants of the SwiSCI survey for their time and effort spent in responding to our questions.
The members of the SwiSCI Steering Committee are:
Xavier Jordan, Bertrand Léger (Clinique Romande de Réadaptation, Sion); Michael Baumberger, Hans Peter Gmünder (Swiss Paraplegic Center, Nottwil); Armin Curt, Martin Schubert (University Clinic Balgrist, Zürich); Kerstin Hug, Margret Hund-Georgiadis (REHAB Basel, Basel); Hans Georg Koch (Swiss Paraplegic Association, Nottwil); n.n. (Parahelp, Nottwil); Hardy Landolt (Representative for persons with SCI, Glarus); Hannjörg Koch (SUVA, Luzern); Mirjam Brach, Gerold Stucki (Swiss Paraplegic Research, Nottwil); Martin Brinkhof, Christine Thyrian (SwiSCI Study Center at Swiss Paraplegic Research, Nottwil).

1http://www.medicaljournals.se/jrm/content/?doi=10.2340/16501977-2050
REFERENCES


