Claudio Peter, PhD1,2, Stefan E. Schulenberg, PhD3,4, Erin M. Buchanan, PhD5, Birgit Prodinger, PhD1,2 and Szilvia Geyh, PhD1,2, for the SwiSCI Study Group
From the 1Swiss Paraplegic Research (SPF), Nottwil, 2Department of Health Sciences and Health Policy, University of Lucerne, Lucerne, Switzerland, 3Department of Psychology, University of Mississippi, 4University of Mississippi Clinical-Disaster Research Center (UM-CDRC), Oxford and 5Department of Psychology, Missouri State University, Springfield, USA
OBJECTIVE: To evaluate the metric properties of distinct measures of psychological personal factors comprising feelings, beliefs, motives, and patterns of experience and behaviour assessed in the Swiss Spinal Cord Injury Cohort Study (SwiSCI), using Rasch methodology.
METHODS: SwiSCI Pathway 2 is a community-based, nationwide, cross-sectional survey for persons with spinal cord injury (SCI) (n = 511). The Rasch partial credit model was used for each subscale of the Positive Affect Negative Affect Scale (PANAS), Appraisal of Life Events Scale (ALE), Purpose in Life test – Short Form (PIL-SF), and the Big Five Inventory-K (BFI-K).
RESULTS: The measures were unidimensional, with the exception of the positive affect items of the PANAS, where pairwise t-tests resulted in 10% significant cases, indicating multidimensionality. The BFI-K subscale agreeableness revealed low reliability (0.53). Other reliability estimates ranged between 0.61 and 0.89. Ceiling and floor effects were found for most measures. SCI-related differential item functioning (DIF) was rarely found. Language DIF was identified for several items of the BFI-K, PANAS and the ALE, but not for the PIL-SF.
CONCLUSION: A majority of the measures satisfy the assumptions of the Rasch model, including unidimensionality. Invariance across language versions still represents a major challenge.
Key words: psychological factors; personality; affect; spinal cord injury; validity; reliability; psychometrics.
J Rehabil Med 2016; 48: 175–188
Correspondence address: Claudio Peter, Participation & Social Integration Unit, Swiss Paraplegic Research, CH-6207 Nottwil, Switzerland. E-mail: claudio.peter@paraplegie.ch
Accepted Sep 21, 2015; Epub ahead of print Feb 1, 2016
INTRODUCTION
The impact of a spinal cord injury (SCI) on an individual is severe, affecting functioning across a range of domains (1). A full understanding of the lived experience of SCI includes capturing the psychological perspective of an individual. SCI can influence an individual’s feelings, thoughts and beliefs, and life goals. Indeed, diverse well-being and mental health trajectories have been observed. Some individuals show positive adjustment patterns, while others experience poor adjustment (2).
Psychological personal factors (PPF), however, can also act as resources, and hence, determinants of adjustment following SCI (3). Literature overviews have identified associations between higher well-being and higher self-efficacy, purpose in life, and other PPF (4, 5). The increased interest in PPF is also grounded in their malleability: state-like factors represent potential intervention targets. For example, several multi-modal intervention programmes have resulted in increased self-efficacy levels in persons with SCI (6–8).
To capture the lived experience of SCI, several PPF were included and assessed in the Swiss Spinal Cord Injury Cohort Study (SwiSCI) pathway 2 (9). The survey comprised different areas of PPF, including feelings, thoughts and beliefs, motives, and patterns of experience and behaviour (Table I).
|
Table I. Areas of psychological personal factors included in the Swiss Spinal Cord Injury Cohort Study (SwiSCI) Domain Set Pathway 2, the specifications, and measurement instruments, information on metric analysis |
|||
|
Areas of psychological personal factors |
Specifications |
Measurement |
Metric analysis |
|
Basic socio-demographic personal characteristics |
Age, sex, nationality, citizenship, educational background, occupational background, economic background, religious affiliation |
|
Not meaningful |
|
Positive in the immediate social and physical context |
Marital status/relationship status/children |
Items on these characteristics |
Not meaningful |
|
For each of the following areas, one instrument will be used as a case in point (in bold) |
|||
|
Feelings |
Positive and negative affect |
Positive and Negative Affect Schedule (PANAS) (14) |
Meaningful |
|
Symptoms of depression |
Hospital Anxiety and Depression Scale (HADS) (50) |
Already conducted (51) |
|
|
Thoughts and beliefs |
Appraisals |
Appraisal of Life Events Scale (ALE) (15) |
Meaningful |
|
Life satisfaction |
WHOQOL BREF – selected items (52, 53) |
Already conducted (53) |
|
|
Motives |
Purpose in life |
Purpose in Life test – Short Form (PIL-SF) (16) |
Meaningful |
|
Patterns of experience and behaviour |
Coping Personality Social skills Self-efficacy |
Brief COPE (54) Big Five Inventory (BFI-K) (17, 28) Social Skills Inventory (SSI) (55) General Self-Efficacy Scale (56) |
Meaningful Meaningful Meaningful Already conducted (57) |
Psychometric evaluations of measurement instruments are prerequisites for their valid use in research and clinical settings. Until now, classical test-theoretical approaches (CTT), such as confirmatory factor analyses, have been used for validation. However, these approaches have recently been supplemented by modern test-theoretical approaches, such as the unidimensional Rasch model (10), which adds to our understanding of aspects related, in particular, to internal construct validity not covered by CTT (11). One key criticism of CTT lies in its assumption of a continuous nature of a categorical response system without empirical evidence. In Rasch analyses, the observed response patterns are tested against the probabilistic response expectations of the Rasch model, and do not assume that the observed variables are of a continuous nature (12). Finding confirmation of data fit, the Rasch model ensures the additivity of the raw sum score of a measure (12, 13). In the context of a national, epidemiological survey, such as SwiSCI, reliability, adequate targeting and invariance of measures across different national languages are further key aspects that can be investigated using Rasch analyses. Hence, Rasch analyses provide the basis for a comprehensive evaluation of the quality of the measures and provide trend-setting indications regarding future use within SwiSCI and other population surveys.
The objective of the current study is to evaluate the metric properties of distinct measures of PPF comprising feelings, thoughts and beliefs, motives, and patterns of experience and behaviour that were assessed in SwiSCI pathway 2 using Rasch methodology. More specifically, we focus on the Positive Affect Negative Affect Scale (PANAS) (14), the Appraisal of Life Events Scale (ALE) (15), the Purpose in Life test – Short Form (PIL-SF) (16) and the Big Five Inventory-K (BFI-K) (17).
METHODS
Study design
Pathway 2 of SwiSCI is a community-based, nationwide, cross-sectional survey. The main aim of SwiSCI is to provide basic information to support the health, functioning, and quality of life of persons with SCI living in Switzerland. A detailed description of the study design of SwiSCI can be found elsewhere (18).
Participants
Individuals 16 years and older living in the Swiss community with a traumatic (e.g. due to accident) or non-traumatic (e.g. internal bleeding) SCI were eligible for SwiSCI. SCI is differentiated by the lesion level (paraplegia vs tetraplegia) and the completeness of a lesion (complete vs incomplete). Individuals with congenital conditions, such as spina bifida, new SCI in the context of palliative care, or neurodegenerative disorders, such as multiple sclerosis, were excluded from SwiSCI. Participants signed an informed consent form, and local ethics committees approved the study.
Procedure
The community-based survey consisted of self-report questionnaires, which were sent to eligible persons in 3 waves from September 2011 to March 2013. The first wave included general information about SwiSCI, the informed consent form, and questions regarding socio-demographic and lesion-related variables. Individuals who returned a signed consent form and the first questionnaire received a second questionnaire on health, functioning, and well-being. In the third wave, 3 randomized samples, stratified by sex, age, and level of lesion were drawn from the respondents of the second wave. These samples each received a different questionnaire module. The measures used in this study were assessed in the Psychological Personal Factors and Health Behavior Module (PPF-HB).
Measurement instruments
Feelings. The 20-item Positive Affect Negative Affect Scale (PANAS) (14, 19–21) was derived from a principal components analysis of the mood checklist (22) and consists of the 2 subscales positive affect (PA) and negative affect (NA). PA and NA reflect distinct dimensions, with high PA representing the extent to which an individual experiences pleasurable engagement with the environment and high NA characterizing subjective distress and engagement with negative experiences. Respondents were asked to rate the degree to which they have experienced each particular emotion within the past week, with reference to a 5-point scale (1 = ”very slightly or not at all” to 5 = ”very much”). Confirmatory factor analysis supported the construct validity of the PANAS subscales, and reliability estimates were very good (14).
Thoughts and beliefs
Appraisals. Primary appraisals, i.e. the cognitive evaluation of a specific stimulus, were measured with the Appraisal of Life Events Scale (ALE) (15). Using 16 adjectives and a 6-point scale, respondents appraised difficult life-events over the past 3 months. The adjectives refer to 3 dimensions: threat (e.g. “terrifying”, 6 items), challenge (e.g. “stimulating”, 6 items) and loss (e.g. “pitiful”, 4 items). Total scores range from 0 to 20 (loss), or 0 to 30 respectively (threat, challenge). Higher scores indicate higher appraisal levels, e.g. a higher extent of appraising the stimulus as challenge (or threat or loss, respectively). Good internal reliability and convergent validity have been reported (15, 23).
Motives
Purpose in life. Purpose in life (PIL) was assessed using the Purpose in Life test – Short Form (PIL-SF). It consists of 4 items with different anchors (16), which are all based on the original 20-item version (24, 25). The PIL-SF measures the extent to which persons recognize or achieve progress towards their life goals or generally perceive a sense of purpose in life. An example item is “I have discovered: no mission or purpose in life vs a satisfying life purpose.” The item response scale ranges from 1 to 7, leading to a total score of 4–28. Higher scores indicate higher PIL. Good internal consistency, unidimensionality, as well as divergent and convergent validity, have been reported (16, 26, 27).
Patterns of experience and behaviour
Personality. The 21-item Big Five Inventory-K (BFI-K) was used to assess the “Big Five” personality characteristics openness (5 items), conscientiousness, extraversion, agreeableness, and neuroticism (4 items each). The BFI-K uses a 5-point Likert-type response scale. It was adapted from the original 44-item BFI to provide a short economic measure of the 5 personality characteristics for contexts with limited time resources necessitating the use of brief measures (17, 28–30). Good reliability and validity data have been reported (17).
Rasch analysis
We applied the Rasch Partial Credit Model (31) for each subscale of the PANAS (positive affect, negative affect), the ALE (challenge, threat, loss), the BFI-K (openness, conscientiousness, extraversion, agreeableness, neuroticism) and the PIL-SF (purpose in life). For all subscales we tested: (i) stochastic ordering, (ii) unidimensionality and local independency, (iii) reliability, (iv) structure of the response scale, (v) targeting, and (vi) item bias or differential item functioning (DIF) using RUMM2030 software (32).
First, stochastic ordering (fit) was tested by comparing the observed data with the Rasch-model implied expectations for all items with a χ2 based goodness of fit test. The Rasch model posits that persons with a higher ability are more likely to answer an item correctly. With regard to PPF, this fit indicates that persons with, e.g. high PIL are expected to achieve higher levels on the PIL-SF compared with persons with lower PIL. Furthermore, standardized residuals (z values) and χ2 results for each item were calculated. Z values above ± 2.50 and significant χ2 tests indicate misfit to the Rasch model (33).
Secondly, items were grouped according to their loading with the first residual PCA factor, and pairwise t-tests were calculated for each person to assess unidimensionality. The number of significant t-tests, i.e. the lower bound of the 95% confidence interval (95% CI), should be below 5% to indicate unidimensionality (34). Multidimensionality can cause disordered thresholds or DIF (see below). Testlets, i.e. combining items to a superior latent construct, were created to examine for these possible effects and to investigate common variance between the testlets (35).
Local independency was evaluated to further investigate the assumptions of the Rasch model. Local independency means that the response to 1 item is not connected with the response to another item, conditional on the trait. Correlation between the items should be based solely on the measured trait; therefore, residual correlations should be close to zero (36). Positive residual correlations above 0.30 indicate local dependency (37). Local dependency can be tackled by the creation of testlets (35). Under a testlet solution the amount of common variance retained by the aggregation of single items into a super-item is reported. In RUMM2030 this is examined via a bi-factor model, whereby the common variance retained in the total score is indicated by the A statistic (38). A value of 0.88 indicates that the unidimensional latent estimate is based upon at least 88% of the total variance.
Next, reliability was assessed using the Person Separation Index (PSI). As with Cronbach’s alpha, a value higher than 0.80 indicates very good reliability for the purpose of group comparisons (39, 40).
Fourth, the structure of the response scale was tested by studying the ordering of the thresholds of each item. Thresholds are boundaries between the response scale options. For example, a 5-point scale has 4 thresholds. The thresholds need increasing values to be ordered, representing the move from low to high levels on the logit continuum of a construct. Disordered thresholds indicate a response scale that does not work as envisioned (41). Disordered thresholds can be adjusted by collapsing response options.
Fifth, targeting was investigated by checking the distribution of person and item threshold parameters across the continuum of the construct. To assess potential floor or ceiling effects, the percentage of individuals with the minimum and maximum raw total score was calculated (42). Furthermore, the difference between the mean person location on the logit continuum and the mean item location (by definition = 0.00) was checked, under consideration of the 95% CI.
Sixth, DIF was checked regarding age, sex, education, severity of injury, combined time and age since injury, as well as language and administration mode of the questionnaires. DIF, or item bias, reflects the notion that persons in different groups (e.g. paraplegia vs tetraplegia) respond differently to an item, even though they share the same trait level (12). To address potential DIF, the standardized residuals between the groups and across the person parameter continuum were analysed with a 2-way analysis of variance (ANOVA). DIF is indicated by a significant main effect of the group (uniform DIF; e.g. injury level), or a significant interaction effect (non-uniform DIF; e.g. injury level × PIL), using Bonferroni correction to reduce Type I error (43). In the case of DIF, we split the DIF item to test whether it caused item misfit or compensatory DIF (44). In the case of language DIF, we re-analysed DIF without the Italian sample to check whether item biases were stable, or due to the small Italian sample size. We also evaluated the impact of all DIF by investigating the differences in the mean locations between the groups for all class intervals in the DIF items. A difference of < 0.5 logit was considered as inconsequential, and item split was not retained in the final analysis (45, 46).
RESULTS
Overall, 511 persons completed the PPF-HB questionnaires, with 361 individuals using the German, 129 the French, and 21 the Italian language versions. Socio-demographic and lesion-related characteristics of the sample are presented in Table II. The findings of the Rasch analyses will be discussed for each scale (Tables III–VII).
|
Table II. Socio-demographic and lesion-related characteristics of the study participants (n = 511) |
||
|
|
Participants |
|
|
Age, years, mean (SD) |
52.91 (14.79) |
|
|
|
Missing |
0 |
|
Sex, n |
|
|
|
|
Male |
371 (72.6) |
|
|
Female |
140 (27.4) |
|
|
Missing |
0 |
|
Education, years, mean (SD) |
13.78 (3.34) |
|
|
|
Missing |
12 (2.3) |
|
Age at SCI, years, mean (SD) |
35.38 (17.60) |
|
|
|
Missing |
5 (1.0) |
|
Severity of lesion, n |
|
|
|
|
Complete paraplegia |
166 (32.5) |
|
|
Complete tetraplegia |
56 (11.0) |
|
|
Incomplete paraplegia |
184 (36.0) |
|
|
Incomplete tetraplegia |
102 (20.0) |
|
|
Missing |
3 (0.6) |
|
Cause of injury, n |
|
|
|
|
Traumatic |
400 (78.3) |
|
|
Non-traumatic |
109 (21.3) |
|
|
Missing |
2 (0.4) |
|
Time since injury, months, mean (SD) |
209.35 (156.73) |
|
|
|
Missing |
5 (1.0) |
|
Mode of administration of questionnaire, n |
|
|
|
|
Online |
218 (42.7) |
|
|
Paper-form |
291 (56.9) |
|
|
Interview |
2 (0.4) |
|
|
Missing |
0 |
|
Language of questionnaire, n |
|
|
|
|
German |
361 (70.6) |
|
|
French |
129 (25.2) |
|
|
Italian |
21 (4.1) |
|
|
Missing |
0 |
|
SD: standard deviation; SCI: spinal cord injury. |
||
Feelings: positive and negative affect
PA subscale. The Rasch analysis indicated a poor model fit (Tables III and IV). The standardized residual level of items 12 (alert), 14 (inspired), and 16 (determined) exceeded the critical level, but only the χ2 test of item 12 reached statistical significance. The t-tests indicated multidimensionality. Testing for local independency yielded no positive residual correlation coefficients. Reliability was very good (PSI = 0.89). Reversed thresholds were observed for items 5 (strong) and 12 (alert).
|
Table III. Rasch-based fit statistics for all measurement instruments, including initial and final analyses |
|||||||||
|
Questionnaire and Items (sample size for test of fit statistics) |
Description of analysis |
Person Mean β (95% CI) |
Item Mean δ (95% CI) |
χ2 |
df |
p-value |
t-test % sig (95% CI) |
Reliability (w/wou) |
A, r |
|
PANAS PA (n = 501) |
Original scale |
0.228 |
0.000 |
140.51 |
80 |
< 0.001 |
10.00 |
0.89, 0.88 |
– |
|
(0.109, 0.347) |
(–0.050, 0.050) |
|
|
|
(8.10, 11.90) |
|
|
||
|
2-Testlet analysis to correct for signs of multidimensionality |
0.183 |
0.000 |
2.52 |
18 |
0.99 |
3.41 |
0.81, 0.81 |
0.92, 0.91 |
|
|
(0.110, 0.256) |
(–0.033, 0.033) |
|
|
|
(1.44, 5.38) |
|
|
||
|
PANAS NA (n = 470) |
Original scale |
0.228 |
0.000 |
140.51 |
80 |
< 0.001 |
10.00 |
0.89, 0.88 |
– |
|
(0.109, 0.347) |
(–0.041, 0.041) |
|
|
|
(8.10, 11.90) |
|
|
||
|
Combination of 2 response options (items 6, 7, 13) |
–1.622 |
0.000 |
108.22 |
70 |
0.002 |
4.81 |
0.77, 0.76 |
– |
|
|
(–1.722, –1.511) |
(-0.046, 0.046) |
|
|
|
(2.90, 6.72) |
|
|
||
|
ALE – Challenge (n = 459) |
Original scale |
–0.44 |
0.000 |
177.31 |
48 |
< 0.001 |
5.43 |
0.80, 0.78 |
– |
|
(–0.535, –0.345) |
(–0.037, 0.037) |
|
|
|
(3.48, 7.38) |
|
|
||
|
3-Testlet analysis to correct for language DIF |
–0.707 |
0.000 |
18.91 |
24 |
0.76 |
4.05 |
0.88, 0.86 |
1.10, 4.97 |
|
|
(–0.851, –0.563) |
(–0.027, 0.027) |
|
|
|
(2.17, 6.18) |
|
|
||
|
ALE – Loss (n = 435) |
Original scale |
–0.675 |
0.000 |
63.34 |
36 |
0.004 |
1.89 |
0.74, 0.67 |
– |
|
(–0.794, –0.556) |
(–0.050, 0.050) |
|
|
|
(0.07, 3.85) |
|
|
||
|
ALE – Threat (n = 456) |
Original scale |
–0.897 |
0.000 |
112.98 |
48 |
< 0.001 |
2.09 |
0.78, 0.77 |
|
|
(–1.009, –0.785) |
(–0.035, 0.035) |
|
|
|
(0.14, 4.05) |
|
|
||
|
2-Testlet analysis to correct for signs of local dependency |
–0.658 |
0.000 |
18.80 |
16 |
0.28 |
1.50 |
0.72, 0.72 |
0.92, 1.07 |
|
|
(–0.737, –0.579) |
(–0.016, 0.016) |
|
|
|
(0.00, 3.48) |
|
|
||
|
PIL-SF (n = 478) |
Original scale |
1.75 |
0.000 |
34.99 |
32 |
0.33 |
4.79 |
0.85,.84 |
– |
|
(1.57, 1.93) |
(–0.036, 0.036) |
|
|
|
(2.88, 6.70) |
|
|
||
|
Combination of 2 response options (item 3) |
1.705 |
0.000 |
34.68 |
32 |
0.34 |
6.39 |
0.85, 0.84 |
– |
|
|
(1.526, 1.884) |
(–0.049, 0.049) |
|
|
|
(4.48, 8.30) |
|
|
||
|
BFI – Openness (n = 478) |
Original scale |
0.832 |
0.000 |
44.09 |
45 |
0.51 |
4.97 |
0.67, 0.59 |
– |
|
(0.737, 0.927) |
(–0.021, 0.021) |
|
|
|
(3.07, 6.87) |
|
|
||
|
Combination of 2 response options (items 6, 7, 10) |
0.90 |
0.000 |
30.02 |
35 |
0.71 |
3.98 |
0.65, 0.58 |
– |
|
|
(0.799, 1.000) |
(–0.027, 0.027) |
|
|
|
(2.07, 5.88) |
|
|
||
|
BFI – Conscientiousness (n = 475) |
Original scale |
1.040 |
0.000 |
24.32 |
24 |
0.44 |
2.40 |
0.61, 0.50 |
– |
|
(0.935, 1.145) |
(–0.017, 0.017) |
|
|
|
(0.49, 4.30) |
|
|
||
|
Combination of 2 response options (items 2 and 16) |
1.105 |
0.000 |
30.59 |
24 |
0.17 |
2.19 |
0.59, 0.48 |
– |
|
|
(0.997, 1.213) |
(–0.024, 0.024) |
|
|
|
(0.28, 4.10) |
|
|
||
|
BFI – Extraversion (n = 488) |
Original scale |
0.592 |
0.000 |
32.64 |
28 |
0.25 |
4.40 |
0.66, 0.60 |
– |
|
(0.491, 0.693) |
(–0.033, 0.033) |
|
|
|
(2.49, 6.31) |
|
|
||
|
Combination of 2 response options for item 8 |
0.593 |
0.000 |
31.04 |
28 |
0.32 |
4.40 |
0.66, 0.60 |
– |
|
|
(0.488, 0.700) |
(–0.034, 0.034) |
|
|
|
(2.49, 6.51) |
|
|
||
|
BFI – Agreeableness (n = 491) |
Original scale |
1.60 |
0.000 |
103.01 |
32 |
< 0.001 |
1.60 |
0.53, 0.47 |
– |
|
(0.00, 3.51) |
(–0.014, 0.014) |
|
|
|
(0.00, 3.51) |
|
|
||
|
BFI – Neuroticism (n = 482) |
Original scale |
–0.734 |
0.000 |
53.06 |
32 |
0.01 |
3.61 |
0.73, 0.68 |
– |
|
(–0.856, –0.612) |
(–0.051, 0.051) |
|
|
|
(1.70, 5.53) |
|
|
||
|
Person mean β: person mean location in logits (beta); item mean δ: item mean location in logits (delta); χ2: chi-square based goodness of fit test; df: degrees of freedom; Reliability (w/wou): Person separation index (with extremes, without extremes), A: common variance between the testlets; r: association between the testlets. |
|||||||||
|
Table IV. Raw scores and Rasch-based fit statistics, ordering of the response scale thresholds, local dependency and differential item functioning (DIF) of the Positive Affect Negative Affect Scale (PANAS) items |
|||||||||
|
Questionnaire and Items (sample size for test of fit statistics) |
Item Mean δ (95% CI) |
SE |
z |
χ2 |
df |
p-value |
τ |
Local dependency |
DIF |
|
PANAS Positive Affect – Full scale (n = 501) |
|
|
|
|
|
|
|
|
|
|
PANAS Positive Affect 01 – interested |
–0.692 |
0.068 |
–0.297 |
11.28 |
8 |
0.19 |
ord |
– |
Education |
|
PANAS Positive Affect 03 – excited |
0.242 |
0.059 |
1.081 |
2.37 |
8 |
0.97 |
ord |
– |
– |
|
PANAS Positive Affect 05 – strong |
0.719 |
0.058 |
–0.021 |
5.52 |
8 |
0.70 |
disord |
– |
– |
|
PANAS Positive Affect 09 – enthusiastic |
0.164 |
0.060 |
–2.480 |
13.28 |
8 |
0.10 |
ord |
– |
– |
|
PANAS Positive Affect 10 – proud |
0.490 |
0.057 |
1.931 |
7.18 |
8 |
0.52 |
ord |
– |
– |
|
PANAS Positive Affect 12 – alert |
–0.232 |
0.058 |
5.243 |
51.61 |
8 |
< 0.001 |
disord |
– |
Language |
|
PANAS Positive Affect 14 – inspired |
0.833 |
0.059 |
2.754 |
11.72 |
8 |
0.16 |
ord |
– |
– |
|
PANAS Positive Affect 16 – determined |
–0.319 |
0.060 |
–3.127 |
12.50 |
8 |
0.13 |
ord |
– |
– |
|
PANAS Positive Affect 17 – attentive |
–0.756 |
0.064 |
–0.779 |
9.49 |
8 |
0.30 |
ord |
– |
– |
|
PANAS Positive Affect 19 – active |
–0.449 |
0.060 |
–2.147 |
15.55 |
8 |
0.05 |
ord |
– |
– |
|
PANAS Negative Affect – Full scale (n = 470) |
|
|
|
|
|
|
|
|
|
|
PANAS Negative Affect 02 – distressed |
–0.635 |
0.054 |
3.433 |
15.29 |
7 |
0.032 |
ord |
– |
Language |
|
PANAS Negative Affect 04 – upset |
–0.483 |
0.057 |
1.663 |
12.80 |
7 |
0.077 |
ord |
– |
– |
|
PANAS Negative Affect 06 – guilty |
0.490 |
0.067 |
–1.146 |
5.03 |
7 |
0.656 |
disord |
– |
– |
|
PANAS Negative Affect 07 – scared |
0.430 |
0.065 |
–2.567 |
17.54 |
7 |
0.014 |
disord |
– |
– |
|
PANAS Negative Affect 08 – hostile |
0.425 |
0.065 |
–1.181 |
9.54 |
7 |
0.216 |
ord |
– |
– |
|
PANAS Negative Affect 11 – irritable |
–0.392 |
0.060 |
–0.904 |
6.61 |
7 |
0.470 |
ord |
– |
– |
|
PANAS Negative Affect 13 – ashamed |
0.507 |
0.072 |
–0.223 |
4.04 |
7 |
0.775 |
disord |
– |
SCI severitya |
|
PANAS Negative Affect 15 – nervous |
–0.399 |
0.056 |
–0.312 |
10.22 |
7 |
0.176 |
ord |
– |
Language |
|
PANAS Negative Affect 18 – jittery |
–0.094 |
0.056 |
–1.076 |
6.30 |
7 |
0.505 |
ord |
– |
Language |
|
PANAS Negative Affect 20 – afraid |
0.151 |
0.059 |
–1.474 |
9.94 |
7 |
0.192 |
ord |
– |
– |
|
Item mean δ: Item mean location in logits (delta); SE: standard error of item location; z: standard normal distributed test value z; df: degrees of freedom; τ: ordering of the response scale thresholds (tau); ord: ordered thresholds; disord: disordered thresholds; Local dependency using r ≥ 0.3 as criteria. aNon-uniform DIF. |
|||||||||
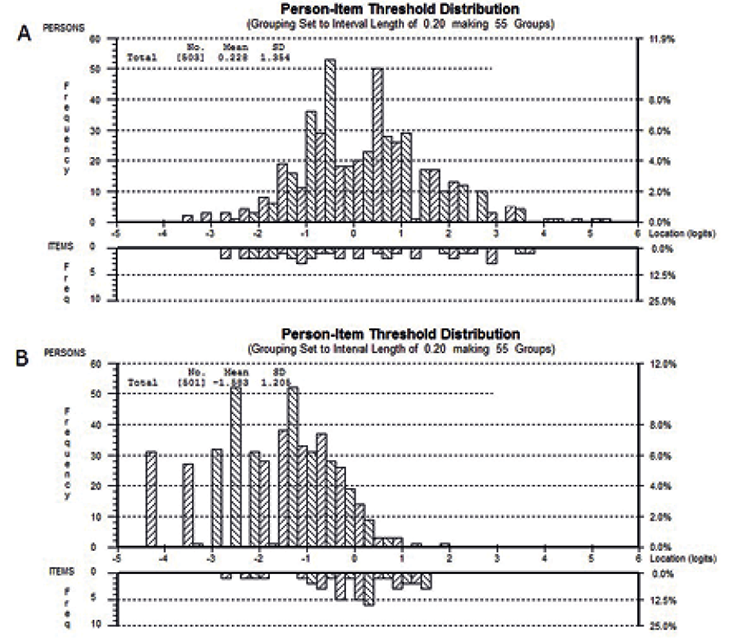
Regarding targeting, the logit means of the 10 items were located within 1.6 logits. The item thresholds were spread along the whole logit continuum (Fig. 1A). Out of 503 participants with valid scores, 2 achieved the maximum raw total score, and none obtained the minimum score. The person and the item mean did not overlap, indicating a tendency toward a ceiling effect. We found uniform DIF for education (item 1) and language (item 12).
Due to signs of multidimensionality, we assigned the items according to their first PCA loadings to 2 groups and conducted additional Rasch analyses for each of the 2 groups. The Rasch analysis with the items 3, 5, 9 and 10 yielded a non-significant goodness of fit statistic, good fit for all items, and 2.81% significant t-tests. Reliability was very good (0.80). Item 5 had disordered thresholds and uniform sex DIF.
Rasch analysis of the second item subgroup (items 1, 12, 14, 16, 17, and 19) showed a borderline non-significant goodness of fit statistic, good item fits to the model, and 6.63% (95% CI [4.71, 8.54]) of significant t-tests. Reliability was very good (0.83). Thresholds of item 12 were disordered. No DIF was found.
Finally, to test whether the 2 item-groups form a unidimensional latent estimate, we conducted a testlet analysis, revealing that 92% of variance between the 2 item-groups was common, 8% uniquely factor-related (Table III). The goodness of fit statistics were good, thresholds ordered. We found a uniform education DIF for testlet 2, and uniform DIFs for both subtests for combined time and age since injury. To test for compensatory DIF we split testlet 1 by combined time and age since injury, and DIF on testlet 2 disappeared. Because the differences of the group mean locations were below 0.5 logits, hinting at inconsequential DIF, the item splits were not retained. Overall, items can be summated to form a unidimensional latent scale, but unique variance and DIF, inconsistently appearing at the item and testlet level, may bias the raw scores.
NA subscale. The Rasch analysis indicated poor model fit. The z-values of items 2 and 7 were above ± 2.50, but both χ2 tests were not significant (Table IV). The t-tests indicated unidimensionality. Testing for local independency did not reveal any positive residual correlation. Reliability was respectable (PSI = 0.77). Disordered thresholds were observed for items 6, 7 and 13.
The logit means of the 10 items were located within 1.1 logits. Many persons are located in the lower negative affect levels, which are not captured by many item thresholds (Fig. 1B). Considering all valid scores, 31 persons (6.19%) attained the minimum, no person the maximum raw total score. The person mean was below the item mean, overall indicating floor effects. Language DIF was detected for items 2, 15 and 18, a non-uniform DIF for SCI severity for item 13.
In an additional analysis we combined 2 response options for items 6, 7 and 13 to adjust for the disordered thresholds. The model fit remained statistically significant, the z-values of items 2 and 7 above ± 2.5, with a significant χ2 test for item 7. Thresholds were ordered, language DIF for items 2, 4, 15 and 18 were observed, but with mean locations between the groups for all class intervals below 0.5 logits indicating inconsequential DIF (Table III). Examining whether DIF caused item misfit or compensatory DIF by splitting item 2 on language, analysis yielded compensatory language DIF for item 18 and no item fit changes (results not shown).
Thoughts and beliefs: appraisals
Challenge. Rasch analysis revealed a poor model fit and items 6, 7 and 13 did not fit the Rasch model (Table V). The χ2 test for item 3 was not significant, but the z-value exceeded the critical level. The χ2 test for item 8 was statistically significant, but the z value was < 2.50. The pairwise t-tests supported unidimensionality. No positive residual correlations were observed, indicating local independency.
|
Table V. Raw scores and Rasch-based fit statistics, ordering of the response scale thresholds, local dependency and differential item functioning (DIF) of the Appraisal of Life Events Scale (ALE) items |
|||||||||
|
Questionnaire and Items (sample size for test of fit statistics) |
Item Mean δ (95% CI) |
SE |
z |
χ2 |
df |
p-value |
τ |
Local dependency |
DIF |
|
ALE Challenge – Full scale (n = 459) |
|
|
|
|
|
|
|
|
|
|
ALE Challenge 3 – Enjoyable |
0.259 |
0.039 |
4.705 |
18.22 |
8 |
0.020 |
disord |
– |
Education, administration mode |
|
ALE Challenge 6 – Challenging |
–0.526 |
0.042 |
5.290 |
53.19 |
8 |
< 0.001 |
ord |
– |
education |
|
ALE Challenge 7 – Stimulating |
0.143 |
0.044 |
–4.031 |
48.30 |
8 |
< 0.001 |
ord |
– |
Language |
|
ALE Challenge 8 – Exhilarating |
0.325 |
0.043 |
–1.804 |
22.73 |
8 |
0.004 |
ord |
– |
Language |
|
ALE Challenge 12 – Informative |
–0.504 |
0.044 |
–0.040 |
3.76 |
8 |
0.878 |
ord |
– |
– |
|
ALE Challenge 13 – Exciting |
0.303 |
0.043 |
–2.674 |
31.10 |
8 |
< 0.001 |
ord |
– |
– |
|
ALE Loss – Full scale (n = 435) |
|
|
|
|
|
|
|
|
|
|
ALE Loss 9 – Painful |
–0.690 |
0.045 |
–0.435 |
8.90 |
9 |
0.446 |
ord |
– |
– |
|
ALE Loss 10 – Depressing |
–0.135 |
0.045 |
–1.511 |
20.36 |
9 |
0.016 |
ord |
– |
– |
|
ALE Loss 11 – Pitiful |
0.516 |
0.046 |
2.289 |
19.98 |
9 |
0.018 |
ord |
– |
– |
|
ALE Loss 16 – Intolerable |
0.309 |
0.046 |
–0.546 |
14.10 |
9 |
0.119 |
ord |
– |
– |
|
ALE Threat – Full scale (n = 456) |
|
|
|
|
|
|
|
|
|
|
ALE Threat 1 – Threatening |
0.072 |
0.044 |
–0.306 |
12.27 |
8 |
0.139 |
ord |
– |
|
|
ALE Threat 2 – Fearful |
–0.185 |
0.046 |
–1.417 |
19.85 |
8 |
0.011 |
ord |
– |
Education |
|
ALE Threat 4 – Worrying |
–0.607 |
0.048 |
2.065 |
7.56 |
8 |
0.477 |
ord |
– |
– |
|
ALE Threat 5 – Hostile |
0.125 |
0.043 |
3.513 |
36.26 |
8 |
< 0.001 |
disord |
– |
Language |
|
ALE Threat 14 – Frightening |
0.058 |
0.045 |
–1.403 |
19.98 |
8 |
0.010 |
ord |
Yes |
Language |
|
ALE Threat 15 – Horrifying |
0.538 |
0.047 |
–2.301 |
17.05 |
8 |
0.030 |
ord |
Yes |
Language |
|
Item mean δ: Item mean location in logits (delta); SE: standard error of item location; z: standard normal distributed test value z; df: degrees of freedom; τ: ordering of the response scale thresholds (tau); ord: ordered thresholds; disord: disordered thresholds; Local dependency using r ≥ 0.3 as criteria. |
|||||||||
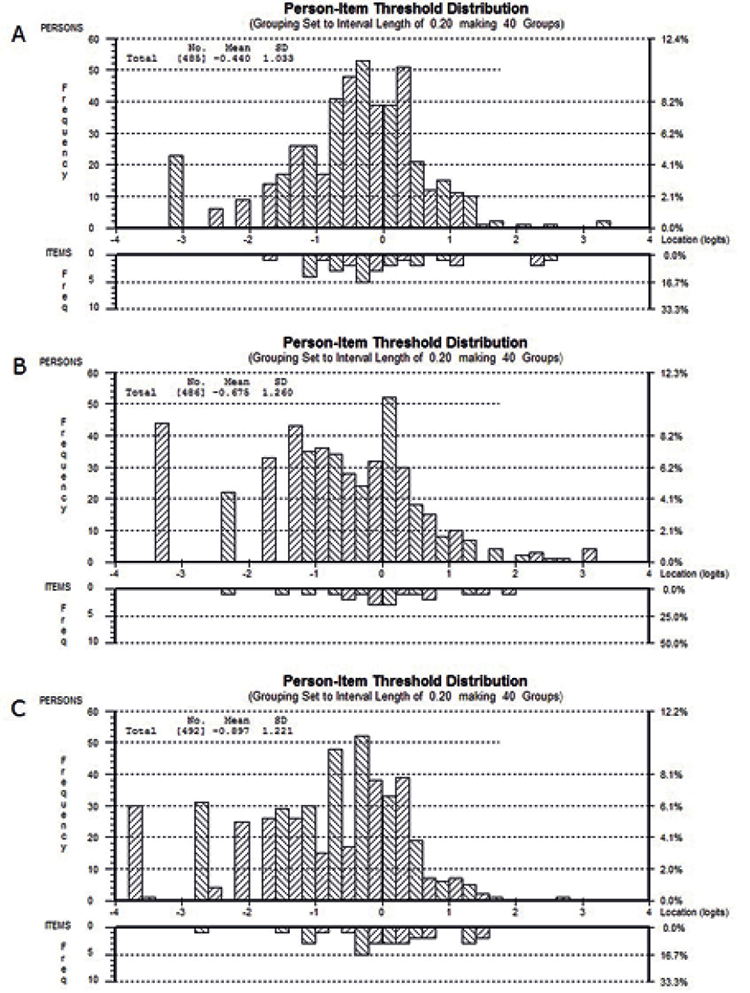
Reliability was very good (PSI = 0.80). Thresholds were ordered, with exemption of item 3. Concerning targeting, the logit means of the 6 items were located within 1 logit. The item thresholds were spread, but slightly accumulated in the centre of the challenge continuum (Fig. 2A). Out of 485 valid scores, 23 persons (4.74%) attained the minimum, and no person the maximum raw total score. The person mean was below the item mean. Uniform DIF was observed for education (items 3 and 6), language (items 7 and 8), and administration mode (item 3).
To investigate whether language DIF caused item misfit or compensatory DIF, items 7 and 8 were split in an additional analysis. No changes in the item fits were observed. Education DIF for item 3 and 6 remained; language DIF for item 8 and administration mode DIF for item 3 were compensatory and disappeared (results not shown).
Alternatively, to examine whether language DIF cancels out at the latent test level, we conducted a testlet analysis based on the language DIF pattern (items with DIF with German > French; DIF with French > German; items with no DIF). All variance was common, but there was more dependence across the 3 subscales than within. Thresholds were ordered, 2 testlet fits were > 2.50, and we found non-significant χ2 tests (Table III). We found a uniform language DIF for 2 (representing items 7 and 8) of the 3 subtests. Again, splitting 1 subtest had no effect on the item fit, but made the DIF for the second testlet disappear (compensatory DIF). However, the differences of the testlet mean locations were below 0.5 logits for all class intervals, suggesting inconsequential DIF. Overall, items can be summated and capture Challenge on a latent level, but language versions may be inequivalent.
Loss. The goodness of fit statistic was statistically significant, indicating misfit to model expectations (Table III). All individual items fit to the model and no positive residual correlation was found (Table V). The t-tests indicated unidimensionality. Reliability was respectable (PSI = 0.74), and all thresholds ordered.
Regarding targeting, the logit means of the 4 items were located within 1.2 logits. Of the 486 valid scores, 44 persons (9.05%) reached the minimum, and 4 persons the maximum raw total score. The person mean was below the item mean, overall indicating a floor effect (Fig. 2B). No DIF was found.
Threat. The overall goodness of fit statistic was statistically significant, and item 5 did not fit the model (Table V). The pairwise t-tests supported unidimensionality. The residual correlation between items 14 and 15 was 0.30, indicating local dependency. Other coefficients were small and negative. The PSI was 0.78, indicating respectable reliability. The thresholds of item 5 were disordered.
Regarding targeting, the item thresholds were spread across the continuum, but many persons were located in the lower part (Fig. 2C). The person mean –0.90 (95%CI [–1.01, –0.79]) was located below the item mean. Of all 492 valid scores, 31 persons (6.30%) attained the minimum, no person attained the maximum raw total score, indicating a floor effect. Uniform DIF was found for education (item 2) and language (items 5, 14 and 15).
To further investigate local dependency, we built 2 testlets based on the loadings of the items on the first residual component. The common variance was 92% (Table III). We found disordered thresholds for 1 testlet (items 14 and 15), a z-value > 2.50 for the other testlet (χ2 test not significant), and a uniform language DIF for both testlets. Scrutinizing the mean locations between the groups for all class intervals hinted at inconsequential DIF. We then checked for compensatory DIF or effects of DIF on item fit. Splitting 1 testlet made DIF the second testlet disappear (compensatory DIF), and the testlets now fit the model (results not shown). Overall, items can be summated to capture a unidimensional latent Threat construct, but raw scores may be biased due to unique variance, local dependency, and language inequivalence.
Motives: purpose in life
The goodness of fit statistic of the PIL-SF was not significant (Table VI). The z-values of items 1 and 4 exceeded ± 2.50, but χ2 tests were not significant. The pairwise t-tests supported the unidimensionality assumption. All residual correlations were negative, indicating local independency. The reliability of the PIL-SF was very good (PSI = 0.85). Disordered thresholds were observed for item 3.
|
Table VI. Raw scores and Rasch-based fit statistics, ordering of the response scale thresholds, local dependency and differential item functioning (DIF) of the Purpose in Life test – Short Form (PIL-SF) items |
|||||||||
|
Questionnaire and Items (sample size for test of fit statistics) |
Item mean δ (95% CI) |
SE |
z |
χ2 |
df |
p-value |
τ |
Local dependency |
DIF |
|
PIL-SF – Full scale (n = 478) |
|
|
|
|
|
|
|
|
|
|
PIL-SF 1 – Presence of clear life goals |
0.096 |
0.057 |
2.618 |
6.04 |
8 |
0.64 |
ord |
– |
– |
|
PIL-SF 2 – Life being meaningful |
–0.410 |
0.059 |
–0.738 |
7.98 |
8 |
0.44 |
ord |
– |
– |
|
PIL-SF 3 – Life goal completion |
0.521 |
0.060 |
0.669 |
4.39 |
8 |
0.82 |
disord |
– |
– |
|
PIL-SF 4 – Presence of goals/life purpose |
–0.207 |
0.061 |
–3.114 |
16.57 |
8 |
0.03 |
ord |
– |
– |
|
Item mean δ: Item mean location in logits (delta); SE: Standard error of item location; z: Standard normal distributed test value z; df: Degrees of freedom; τ: Ordering of the response scale thresholds (tau); ord: ordered thresholds; disord: disordered thresholds; Local dependency using r ≥ 0.3 as criteria. |
|||||||||
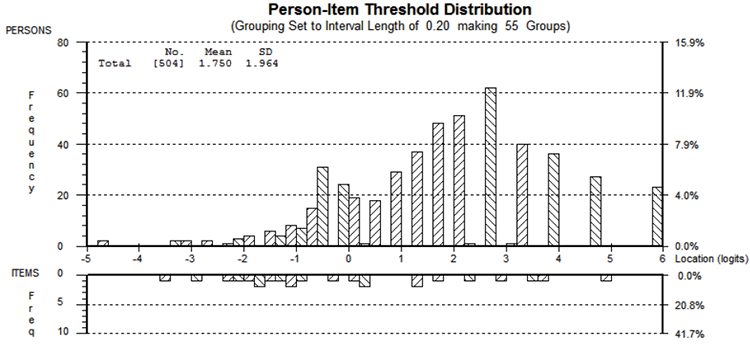
Regarding targeting, the item means were located within 1 logit. Item thresholds spread well across the PIL continuum (Fig. 3). Of 504 individuals with valid scores, 2 (0.40%) attained the minimum, and 23 (4.56%) the maximum raw total score. The mean person level lay above the mean item level, indicating a ceiling effect. We found no DIF. Collapsing 2 response options of item 3 in an additional analysis to adjust for the disordered thresholds did not change the findings of this measure (Table III).
Patterns of experience and behaviour: Personality
Openness. The goodness of fit statistic was not significant, indicating good fit to the model (Table III). All individual items fit the Rasch model. The pairwise t-tests indicated unidimensionality (Table VII). The residual correlations indicated local independency, and no coefficient was positive. The PSI was 0.67, which points at minimally acceptable reliability. Thresholds were disordered for items 6, 7 and 10.
|
Table VII. Raw scores and Rasch-based fit statistics, ordering of the response scale thresholds, local dependency and differential item functioning (DIF) of the Big Five Inventory-K (BFI-K) items |
|||||||||
|
Questionnaire and Items (sample size for test of fit statistics) |
Item mean δ (95% CI) |
SE |
z |
χ2 |
df |
p-value |
τ |
Local dependency |
DIF |
|
BIF-K Openness – Full scale (n = 478) |
|
|
|
|
|
|
|
|
|
|
BIF-K Openness 6 – curious |
–0.351 |
0.058 |
0.733 |
7.28 |
9 |
0.61 |
disord |
– |
– |
|
BIF-K Openness 7 – ingenious |
0.009 |
0.054 |
0.682 |
12.73 |
9 |
0.18 |
disord |
– |
Language |
|
BIF-K Openness 10 – active imagination |
–0.049 |
0.056 |
–0.111 |
5.65 |
9 |
0.77 |
disord |
– |
– |
|
BIF-K Openness 15 –artistic experience |
0.106 |
0.054 |
–0.447 |
11.14 |
9 |
0.27 |
ord |
– |
– |
|
BIF-K Openness 21 – few artistic interest |
0.285 |
0.048 |
0.704 |
7.29 |
9 |
0.61 |
ord |
– |
– |
|
BFI-K Conscientiousness – Full scale (n = 475) |
|
|
|
|
|
|
|
|
|
|
BFI-K Conscientiousness 2 – thorough job |
–0.239 |
0.062 |
–0.673 |
8.80 |
6 |
0.19 |
disord |
– |
– |
|
BFI-K Conscientiousness 13 – lazy |
0.167 |
0.052 |
1.059 |
4.93 |
6 |
0.55 |
ord |
– |
– |
|
BFI-K Conscientiousness 16 – efficient |
–0.072 |
0.064 |
–1.198 |
7.28 |
6 |
0.30 |
disord |
– |
Language |
|
BFI-K Conscientiousness 19 – follows plans |
0.144 |
0.058 |
0.373 |
3.32 |
6 |
0.77 |
ord |
– |
– |
|
BFI-K Extraversion – Full scale (n = 488) |
|
|
|
|
|
|
|
|
|
|
BFI-K Extraversion 4 – reserved |
0.516 |
0.053 |
0.183 |
6.72 |
7 |
0.46 |
ord |
– |
Language |
|
BFI-K Extraversion 8 – generates enthusiasm |
–0.108 |
0.057 |
0.537 |
7.59 |
7 |
0.37 |
disord |
– |
– |
|
BFI-K Extraversion 11 – quiet |
–0.039 |
0.053 |
0.552 |
10.62 |
7 |
0.16 |
ord |
– |
Language |
|
BFI-K Extraversion 17 – outgoing |
–0.369 |
0.060 |
0.430 |
7.71 |
7 |
0.36 |
ord |
– |
– |
|
BFI-K Agreeableness – Full scale (491) |
|
|
|
|
|
|
|
|
|
|
BFI-K Agreeableness 1 – fault in others |
0.199 |
0.051 |
1.596 |
24.19 |
8 |
0.002 |
ord |
– |
Sex |
|
BFI-K Agreeableness 12 – trusting |
–0.022 |
0.053 |
2.617 |
23.47 |
8 |
< 0.001 |
ord |
– |
Language |
|
BFI-K Agreeableness 14 – cold and aloof |
0.002 |
0.050 |
–1.638 |
27.42 |
8 |
< 0.001 |
ord |
– |
|
|
BFI-K Agreeableness 18 – rude to others |
–0.179 |
0.050 |
–1.782 |
28.01 |
8 |
< 0.001 |
ord |
– |
Language |
|
BFI-K Neuroticism – Full scale (n = 482) |
|
|
|
|
|
|
|
|
|
|
BFI-K Neuroticism 3 – depressed, blue |
0.736 |
0.057 |
–1.348 |
14.50 |
8 |
0.07 |
ord |
– |
– |
|
BFI-K Neuroticism 5 – relaxed |
–0.219 |
0.059 |
2.798 |
11.60 |
8 |
0.17 |
ord |
– |
– |
|
BFI-K Neuroticism 9 – worries a lot |
–0.571 |
0.053 |
–0.579 |
11.41 |
8 |
0.18 |
ord |
– |
– |
|
BFI-K Neuroticism 20 – nervous |
0.028 |
0.056 |
–0.560 |
15.56 |
8 |
0.05 |
ord |
– |
Language |
|
Item mean δ: Item mean location in logits (delta); SE: Standard error of item location; z: Standard normal distributed test value z; df: Degrees of freedom; τ: Ordering of the response scale thresholds (tau); ord: ordered thresholds; disord: disordered thresholds; Reliability (w/wou): Local dependency using r ≥ 0.3 as criteria. |
|||||||||
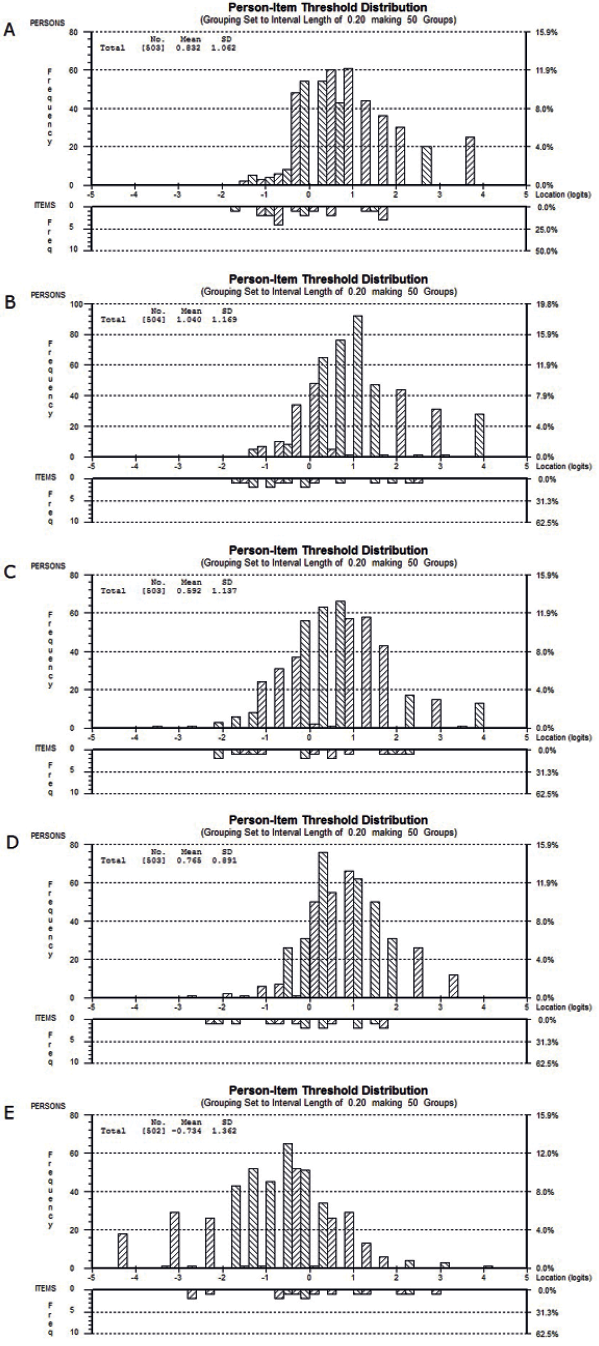
Regarding targeting, the logit means of all items were located within 0.6 logits. The person mean was located above the item mean. The item thresholds accumulated in approximately 3 areas of the continuum, at –1, 0 and 1.5 logits. No thresholds were located in higher areas (Fig. 4A). Of all 503 valid scores, no person attained the minimum, but 25 persons (4.97%) attained the maximum raw total score. Overall, this finding points to a marginal ceiling effect.
We identified a uniform language DIF for item 7. However, it disappeared after combining 2 response options for items 6, 7 and 10 in an additional analysis (Table IV).
Conscientiousness. The goodness of fit statistic was non-significant and all items showed fit to the model. Pairwise t-tests pointed at unidimensionality. No positive residual correlation was observed, indicating local independency. Reliability was low, with PSI = 0.61 (Table VII). Disordered thresholds were found for items 2 and 16. Regarding targeting, item means were located within 0.4 logits. The person mean was located above the item mean. The item thresholds were spread along the conscientiousness continuum, with a slight tendency towards lower levels (Fig. 4B). No person attained the minimum, but 28 persons (5.56%) attained the maximum raw total score, suggesting a ceiling effect. Uniform language DIF was identified for item 16.
In an additional analysis 2 response options for items 2 and 6 were collapsed (Table III), which yielded good fit statistics. Language DIF for item 16 persisted, but the mean locations between the groups for all class intervals hinted at inconsequential DIF.
Extraversion. The goodness of fit statistic was not statistically significant, and all items fit the model. The pairwise t-tests hinted at unidimensionality. No positive residual correlation was found, indicating local independency (Table VII).
Reliability was minimally acceptable, with PSI = 0.66. Disordered thresholds were found for item 8. Regarding targeting, the item means were located within 1 logit. The person mean was situated on a higher extraversion level than the item mean. The thresholds are spread along the extraversion continuum, with missing thresholds between –1 and 0, and 1 and 2 (Fig. 4C). Of 503 valid scores, 1 person (0.20%) attained the minimum, and 13 (2.58%) the maximum raw total score, indicating a tendency towards a ceiling effect. We found a uniform language DIF for items 4 and 11. In a further analysis we collapsed 2 response options of item 8 (Table III). Language DIF for items 4 and 11 persisted, but the mean locations between the groups for all class intervals indicated inconsequential DIF.
Agreeableness. The goodness of fit statistic was statistically significant (Table III). The z-value of item 12 was above 2.50, with a non-significant χ2 test. In contrast, the standardized residual levels of the other items were below ± 2.50, but statistically significant. The pairwise t-tests supported unidimensionality. Residual correlations were negative, indicating local independency. Reliability was unacceptable, with PSI = 0.53. All item thresholds were ordered.
Concerning targeting, the item means were spread along 0.4 logits. The person mean’s location was higher than the item mean. The item thresholds (Fig. 4D) are spread along the agreeableness continuum, but are not located in the highest agreeableness levels. The number of persons reaching the maximum raw total score was 12 (2.39%). No persons attained the minimum raw total score, overall, suggesting a ceiling effect.
Examination of DIF revealed a uniform sex DIF for item 1 and a uniform language DIF for items 12 and 18 (Table VII), however, with mean locations between the groups for all class intervals below 0.5 logits. To test for compensatory DIF and whether DIF caused item misfit we split the DIF items (item 1 for sex; item 18 for language). No improvement of model or item fit was observed, but language DIF for item 12 disappeared (results not shown).
Neuroticism. Rasch analysis resulted in a significant goodness of fit statistic (Table III). The z-value of item 5 was above ± 2.50, but the χ2 test was not statistically significant. Pairwise t-tests pointed at unidimensionality. No positive residual correlation was found, indicating local independency (Table VII). Reliability was respectable, with PSI = 0.73. The thresholds of all items were ordered.
Regarding targeting, the 4 item means were spread along 1.3 logits. The person mean was below the item mean. The item thresholds were spread along the neuroticism continuum, but no threshold was located between –1 and –2 logits (Fig. 4E). Out of 502 valid scores, 18 persons (3.59%) attained the minimum, and 1 person the maximum raw total score, suggesting a floor effect.
Examination of DIF revealed a uniform language DIF for item 20, but the mean locations between the groups for all class intervals of item 20 pointed at inconsequential DIF. Splitting item 20 did not improve overall model fit or fit of item 5 (results not shown).
Fig. 4. Person-item threshold distribution of the 5 personality dimensions (A) openness, (B) conscientiousness, (C) extraversion, (D) agreeableness, and (E) neuroticism, extreme scores included.
DISCUSSION
This study examined the psychometric qualities of 4 PPF using a modern, test-theoretical approach with Rasch analysis. Indications for multi-dimensionality were found for the Positive Affect items. All other scales represent unidimensional measures. Reliability ranged from adequate to very good, except for the BFI-K agreeableness and extraversion subscales. The PPF measures are suitable for an SCI population, indications for bias by SCI-related characteristics were found for just 1 item across all scales. However, with the exception of the PIL-SF, we repeatedly found language DIF. Language DIF can be accommodated within the Rasch framework, but the raw sum scores of the different language versions may not be equivalent, even though our results indicated inconsequential impacts of DIF.
Our analyses of the PANAS-PA subscale suggested a bi-dimensional factor structure. The 2 sub-dimensions could stand for positive self-view (items 3, 5, 9 and 10), and motivation-related alertness with a future outlook (items 1, 12, 14, 16, 17 and 19). Our findings, however, do not correspond with a recent study applying the Rasch methodology using Winsteps software with the Brazilian Portuguese questionnaire version, as no multidimensionality was found (47). Multi-dimensionality could bias raw total scores, since the score may not capture the intended construct. Our analyses suggest that items can be summated to form a unidimensional latent scale using a bi-factor approach. This approach, however, needs to be applied when comparing total scores across populations.
In contrast to PA, our results support unidimensionality for NA. The observed floor effect indicates that our study participants reported low levels of NA. From a psychological perspective, this finding is pleasing, hinting at good well-being of our SCI study sample (48). From a psychometric point of view, it means that the NA items might not have captured distinct patterns in the low-NA levels, which could be covered with additional NA-items. In the context of SwiSCI a clear differentiation of high NA levels seems preferable, potentially representing a proxy for complications in the adjustment to SCI. High scorers on negative affect may need a more detailed clarification of their mental health. Test equating, i.e. putting the NA items on a common metric with mental health measures with a clinical cut-off score, may provide more knowledge on potential, clinically meaningful cut-off-scores for the NA-subscale.
We found unidimensionality and very good reliability for the PIL-SF. Validated versions of the French and Italian PIL-SFs did not exist prior to SwiSCI. The forms were translated in a forward translation procedure. Collapsing response options, as for item 3, reduces the range of the raw total score and impedes comparability across studies. However, since only 2 responses of 1 item needed collapsing, the impact on the PIL-SF total score range (4–28) is small.
Our findings regarding the 3 subscales of the ALE diverge dramatically. The Loss subscale showed unidimensionality, respectable reliability, and invariance across all language versions. In contrast, for both Challenge and Threat, testlets had to be created and language bias persisted even at the testlet level, although in a range indicating inconsequential impact. Standardized French and Italian versions of the ALE did not exist and were translated by our study team. A closer examination of these language versions in other settings is warranted, along with a careful inspection of the items in each context.
The positive side in relation to the 5 personality subscales of the BFI-K is that unidimensionality was revealed. The 5 personality characteristics represent comprehensive, broad constructs, which is why lower reliability estimates could be expected. Nonetheless, the low PSI value for agreeableness and conscientiousness indicated unreliable assessment of these constructs. Taking 0.80 as the cut-off for reliable group comparisons reveals insufficient reliability for all 5 subscales, and hence questionable usability within population studies (40).
The frequently observed language DIFs observed in most measurement instruments could reflect cultural differences across the Swiss-German-, French-, and Italian-speaking populations, or differences in item phrasings. For example, the French BFI-K item 16 (efficient) of the conscientiousness subscale refers to the work context (efficient in work), while the German item alludes to a more general statement of being efficient when working, which can comprise more aspects than work per se. Overall, a careful re-examination of the DIF items might be warranted. This examination is especially important in the context of an epidemiological survey, such as SwiSCI, which aims to describe health and quality of life and the potential risk factors within a specified multi-lingual population. Comparisons across language groups, but also comparisons with the general population, may yield biased results. Although transformation tables have been offered to convert raw total scores to a logic metric scale and adjust for biased effects (e.g. 49), cross-validations with larger sample sizes are needed, and we refrain from premature disclosure of transformed logit scores.
Our study is subject to several limitations. First, important characteristics of a measurement instrument, such as test-retest reliability and sensitivity to change, were not tested due to the cross-sectional study design. Secondly, a larger sample is needed to cross-validate our findings regarding DIF. The sample sizes per language group were different, but representative for the Swiss context, i.e. multiple national languages in the same country.
The current study has shown that a majority of our measures of PPF satisfy the assumption of unidimensionality of the Rasch model. The Swiss context represents a major challenge from a psychometric point of view because equivalence across languages is not guaranteed. Comparisons with the English original measures were not part of this study, but should be addressed in the future. The validation of measures by the use of modern test-theoretical approaches, such as the Rasch model, should become a regular step within epidemiological studies.
Funding
This study was funded by the Swiss Paraplegic Research (SPF), Nottwil, Switzerland.
ACKNOWLEDGEMENTS
This study has been financed in the framework of the Swiss Spinal Cord Injury Cohort Study (SwiSCI, www.swisci.ch), supported by the Swiss Paraplegic Association.
The members of the SwiSCI Steering Committee are: Olivier Dériaz (Clinique Romande de Réadaptation, Sion); Michael Baumberger and Hans Peter Gmünder (Swiss Paraplegic Center, Nottwil); Armin Curt and Martin Schubert (University Clinic Balgrist, Zürich); Kerstin Hug and Margret Hund-Georgiadis (REHAB Basel, Basel); Hans Georg Koch and Urs Styger (Swiss Paraplegic Association, Nottwil); Hardy Landolt (representative for persons with SCI, Glarus); Rita Schaumann-Von Stosch (SUVA, Luzern); Mirjam Brach and Gerold Stucki (Swiss Paraplegic Research, Nottwil); and Martin Brinkhof and Christine Thyrian (SwiSCI Study Center at Swiss Paraplegic Research, Nottwil).
The authors would like to thank study participants and the personnel of the SwiSCI study centre.
REFERENCES

