Ulf Krister Hofmann, MD1, Stefan Thumm1, Maurice Jordan, MD1, Falk Mittag, MD1, Ina-Christine Rondak2 and Ingmar Ipach, MD1
From the 1Department of Orthopaedic Surgery, University Hospital of Tübingen, Tübingen and 2Institute for Medical Statistics and Epidemiology, University Hospital of the Technische Universität München, München, Germany
BACKGROUND: Fitness to drive a car has been investigated increasingly over recent years. However, most research has focussed on perioperative driving performance, and few data are available on how orthoses influence the ability to perform an emergency stop. This study investigated the effect of 4 common ankle braces (Kallassy®, CaligaLoc®, Air-Stirrup®, ASO®) on reaction time, foot transfer time (together: brake response time) and brake force. The hypothesis was that wearing these braces on the right ankle impairs braking performance, specifically by increasing foot transfer time, but also by altering brake force.
METHODS: A car cabin was set up with measurement equipment to register reaction time, foot transfer time, brake response time and brake force under realistic spatial constraints. A crossover repeated measures design was used to test 30 healthy volunteers with and without each of the braces.
RESULTS: All 4 braces resulted in statistically significantly increased foot transfer time (p < 0.001), compared with measurements without a brace. Reaction time with a brace was significantly prolonged, with the exception of the Kallasy®. Brake force was not statistically significantly impaired.
CONCLUSION: This study demonstrates that ankle braces lead to impaired braking performance. Depending on the type of brace, a stopping distance increase of more than 1 m at 100 km/h can be expected.
Key words: automobile driving; reaction time; ankle brace; total brake response time; driver reaction time.
J Rehabil Med 2015; 00: 00–00
Correspondence address: Ulf Krister, Orthopaedic Surgery, University Hospital of Tübingen, DE-72076 Tübingen, Germany. E-mail: ulf.hofmann@med.uni-tuebingen.de
Accepted Jun 22, 2015; Epub ahead of print Oct 9, 2015
INTRODUCTION
Many people’s lifestyles depend on being able to drive. Although in many countries it is ultimately considered the car driver’s responsibility to ensure that they are fit to drive (1–3), patients with conditions that partly immobilize the right lower limb often seek advice from orthopaedic surgeons as to whether they are able to drive. In these cases caution should be exercised over the precise wording used, since potential liabilities may arise from such recommendations (3, 4). It is therefore crucial to provide sufficient scientific evidence on which to base such medical advice.
Safe participation in driving in traffic depends on various abilities, and different approaches are used to assess fitness to drive. A key element is the ability to perform an emergency stop within a short distance. The distance covered by a car before coming to a complete halt (total stopping distance) comprises 2 principal components: reaction distance and braking distance (Table I). Braking distance is determined mostly by speed, but also includes technical features of the vehicle, as well as the surrounding environment. Technical developments over recent decades have reduced braking distances, so that at a speed of up to approximately 60 km/h the reaction distance, i.e. the distance covered by the car until the driver reacts and starts the actual braking process, is currently longer than the braking distance of the vehicle itself (5).
|
Table I. Components of total brake response time. Data from Green (6), reprinted with permission from Hofmann et al. (18) |
||
|
Total brake response time |
||
|
1. Reaction time |
2. Movement time |
3. Device response time |
|
Sensation Perception/recognition Situational awareness Response selection Programming |
Lift the foot off the accelerator pedal and transfer it to the brake (foot transfer time) Depress the pedal (brake pedal travelling time) |
Time it takes the device to engage once activated |
|
Total stopping distance = reaction distance + braking distance. Reaction distance = total brake response time × speed of the vehicle. |
||
The time it takes the driver to react and fully execute emergency braking is called total brake response time (TBRT), and this can be further subdivided into the following categories (6, 7):
• reaction time (RT);
• movement time (MT), comprising foot transfer time (FTT) and brake pedal travelling time (BPTT);
• device response time (see Table I).
TBRT without BPTT and device response time is called brake response time (BRT) and has been used frequently in the scientific literature to evaluate braking performance.
A wide range of possible BRT limits, which define fitness to drive, have been proposed by different road authorities. These range from 1,500 (8) to 700 ms (1, 9). These suggested limits must be considered under the premise that events may be expected or unexpected. An expected event, e.g. when a driver anticipates a signal and expects to perform a manoeuvre, leads to a much faster reaction time (approximately 700 ms) than an unexpected event (approximately 1,500 ms) (6, 7). Many other factors, such as driver age, sex, fatigue level, drug intake, cognitive load, or the nature of the signal, can further influence reaction and response times (3, 10–14).
The brake force (BF) applied to the brake pedal is another important factor for effective braking. Since brake assist systems can partly compensate for insufficient maximum pressure in modern vehicles, there is no generally accepted threshold for minimum BF. As possible end-points for MT forces of 100 N (7, 15) or 200 N on the brake pedal have been used in the literature (16, 17).
For the specific experimental set-up used in this study, the reference BRT limit in healthy subjects was set at 600 ms (18, 19); a value that allows various parameters that may affect BRT to be tested under highly controlled and reproducible conditions. Various studies have investigated the effect of surgical procedures. However, there is limited information available regarding the influence of an immobilized lower limb on driving fitness (20–23).
In this study, the braking performance of young healthy volunteers wearing different ankle braces was analysed and compared with measurements from the same collective without a brace. Not only BRT, with its components RT and FTT, but also maximum BF on the brake pedal was assessed, using a real car cabin to create realistic spatial constraints.
The purpose of this study was not to analyse the effect of pathological conditions leading to patients wearing braces, but rather to examine the influence of the braces themselves. Based on the findings of Waton et al. (23), it was expected that braces immobilizing the ankle would affect braking performance. However, in a study published by Tremblay et al. (22) BRT was prolonged by only approximately 5% when immobilizing the ankle. This raises the question as to what extent this effect is statistically significant and clinically relevant.
METHODS
Testing device
The testing device was incorporated within a Volkswagen automobile, thus re-creating the real ergonomic conditions of a European middle-class car (Fig. 1). Both the accelerator and brake pedal were fixed and then equipped with a force transducer (KMB31, Megatron® Electronics, Heilbronn, Germany) to register the applied force. One transducer was directly clamped onto the accelerator pedal. The sensor for the brake pedal was attached behind the pedal suspension in order to increase measurement precision. This was necessary, since during rapid transfer of the foot from accelerator to brake pedals, the latter is not always pushed centrally. The signal output of the force transducers was connected to a measurement amplifier (EMA 3 DMS, Megatron® Electronics) and then sent to a USB-Scope (MEphisto Scope, Meilhaus Electronic, Alling, Germany). This 2-channel multifunctional module has an integrated voltmeter to register the signal coming from the force transducers.
The simulated emergency signal (see below) from a triggered red light-emitting diode (LED) light placed in front of the windscreen at the driver’s eye level was also received by the MEphisto Scope. These data were transmitted to a laptop equipped with a custom-made measuring computer program developed according to the required specifications (Engineering Office, Michael Sawatzki, Wülfrath, Germany). Calibration of the sensors was carried out according to standard procedures.
An electronic timer measured the elapsed time. The measured pressures and times were displayed on a computer screen visualized in the form of a diagram (Fig. 1D).
Before testing, the driver’s seat was adjusted to each patient’s normal driving position with respect to seat inclination, head-rest and seat-pedal distance (24). Subjects were asked to wear footwear of their choice that would correspond to that normally used when driving a car. The same experimental set-up was used as described previously (18).
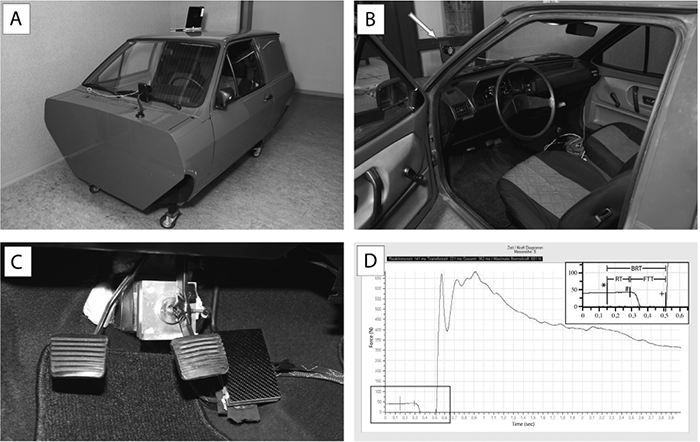
Fig. 1. Experimental set-up and recorded data. (A) Custom-made car simulator (Volkswagen Polo) for measuring brake response time (BRT), reaction time (RT), foot transfer time (FTT) and brake force (BF) (graph in D). (B) View of the driver cabin. The white arrow indicates the red flashlight. (C) Overview of the pedals with the brake pedal in the middle and the accelerator pedal on the right, both equipped with a pressure sensor; on the left the clutch pedal. (D) Computer output data, showing BRT, RT and FTT. The top right insert is an enlargement of the bottom left section of the graph. The first vertical line (marked *) indicates the triggering of the red flashlight, the second vertical line (marked #) the beginning of pressure decrease on the accelerator pedal, and the third vertical line (marked +) the beginning of pressure increase on the brake pedal (Data from Green (6), reprinted with permission from Hofmann et al. (18).
Procedure
Subjects were asked to push the accelerator pedal continuously, thus starting the computer-based registration. The supervisor then activated the red LED light at varying time intervals within a period of 10 s, using a hand control unit kept out of sight of the patient. Participants were instructed to consider this light as the simulated emergency situation and initiate full emergency braking. The right foot was thus lifted off the accelerator pedal, transferred to the brake pedal and maximum brake pressure applied. Absolute pressure levels were measured on both pedals, to quantify how the foot is lifted off the accelerator and depresses the brake pedal. The time elapsed between triggering the LED light and the start of reduced pressure on the accelerator pedal reflects the measured RT.
Various end-points for MT have been described in the literature, ranging from the start of pressure increase (25, 26), to a force of 100 N (7, 15), up to a minimum of 200 N being applied on the brake pedal (16, 17). To provide an unequivocal end-point in this study, FTT was measured and defined as from the start of reduced pressure on the accelerator until the start of increased pressure on the brake pedal.
For each trial with or without a brace, RT, FTT, BRT, and maximum BF were measured 10 times once the participant was familiar with the set-up (3 practice trials). All subjects were given the same standardized instructions. Before starting the experimental procedure with each brace, subjects were asked to walk a distance of 50 m to adapt to the new perception and motion range. A crossover repeated measures design was chosen to avoid a possible systemic error. Therefore, the testing order was randomized, including the testing without a brace.
Subjects were awaiting the signal and therefore no decision-making process as to whether to steer or brake was required. The displayed signal was clear, yet there was no immediate danger to suggest a vital urgency. The patient was not distracted by a cognitive load since there were no obstacles to consider.
Tested braces
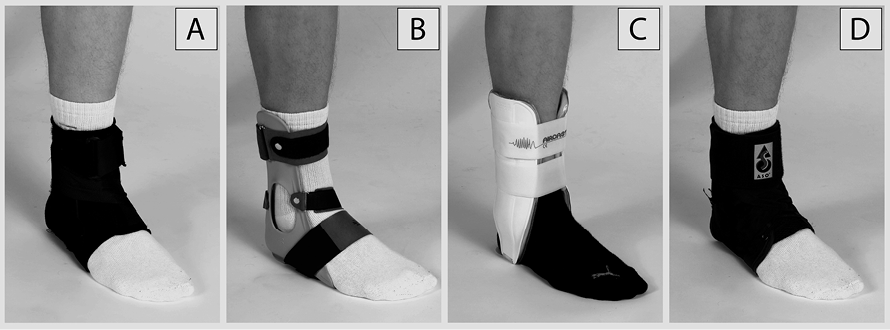
Four different braces were tested in this study: Kallassy® – Neatec®, Neu-Ulm, Germany; CaligaLoc® – Bauerfeind®, Zeulenroda-Triebes, Germany; Air-Stirrup® – DJO Inc.®, Vista, Canada; ASO® – Basko-Healthcare®, Hamburg, Germany (Fig. 2A–D). The characteristics of the tested braces are shown in Table II.
|
Table II. Characteristics of the tested braces |
||||
|
Brace |
Size |
Weight, g |
Material |
Limitation of range of motion |
|
Kallassy® – Neatec® |
L/XL (4/6) |
105 |
Neoprene shoe with nylon straps |
Limitation of inversion, only mild restriction of eversion, plantar flexion and dorsiflexion |
|
CaligaLoc® – Bauerfeind® |
2a (2/3) |
142 |
Plastic shell with internal cushioning |
Limitation of inversion, eversion, plantar flexion, dorsiflexion |
|
Air-Stirrup® – DJO Inc.® |
M (3/4) |
135 |
Plastic shell with internal soft aircell system |
Limitation of inversion and eversion, free plantar flexion and dorsiflexion |
|
ASO® – Basko-Healthcare® |
M (4/7) |
148 |
Nylon shoe with nylon straps |
Limitation of inversion and eversion, mild restriction of plantar flexion and dorsiflexion |
|
aCorresponding to 39–43 in Germany and 8–12 in USA. The weight of each brace is given for the size listed. In brackets the ordinal size rank from smallest to largest. |
||||
Statistical analysis
Distributions of variables within the study groups were assessed by histograms and described by means ± standard deviations or medians (ranges), as appropriate. Absolute frequencies are used to describe categorical measures. Using logarithmic transformation in the case of deviation from normality, repeated measures analysis of variance (ANOVA) and post-hoc paired t-tests were used to compare mean values of braking performance (RT, FTT, BRT and BF) between all braces and braking without a brace. Differences between each brace-impaired and unrestricted braking were calculated by forming the mean of the individual differences in median values for braking performance.
These mean differences and their 95% confidence intervals (95% CI) are presented in order to assess clinical relevance.
All reported p-values are 2-sided, with a significance level of α = 0.05. Since this study was intended as an explorative descriptive investigation, no adjustment for multiple testing was performed, but all p-values are presented, as suggested by Saville (27). Statistical analysis was conducted using IBM SPSS version 22 and R version 3.0.3 (R Foundation for Statistical Computing) (28).
Participants
Healthy volunteers were recruited for participation in the study. Inclusion criteria were: age 18–40 years; female and male participants were counterbalanced. Exclusion criteria were clinical instability of the ankle, known cardiovascular disease, a musculoskeletal or neurological condition requiring medical treatment, positive medical history of psychiatric disease or addiction, previous surgery on ankle, knee, hip or spine, regular drug intake (with the exception of the contraceptive pill in women) and pregnancy.
Full departmental, institutional and ethics committee approval from the University of Tübingen/Germany were obtained before commencing the study. Written informed consent was received from all subjects before participation.
Clinical trial registration number: University of Tübingen ethics committee project number: 009/2014BO2.
RESULTS
Thirty volunteers (15 females, 15 males) were included in the study (for demographic characteristics see Table III). All subjects met the inclusion criteria and had valid driving licenses. Subjects were aged between 19 and 30 years, and all were non-smokers.
No obvious learning effect or deterioration due to exhaustion could be observed in participants for RT, FTT, BRT or BF; the median values of the 10 repeated measurements for each participant and brace were used for further analysis.
|
Table III. Demographic data |
|||
|
Variable |
Study collective (n = 30) |
Male (n = 15) |
Female (n = 15) |
|
Age, years, median (min–max) |
23 (19–30) |
23 (19–30) |
23 (22–27) |
|
Body height, m, median (min–max) |
1.72 (1.60–1.90) |
1.81 (1.67–1.95) |
1.66 (1.60–1.73) |
|
Body weight, kg, median (min–max) |
70.5 (52–90) |
75.0 (64–90) |
60.0 (52–75) |
|
BMI, kg/m2, median (min–max) |
22.2 (19.8–28.4) |
22.6 (20.7–28.4) |
21.1 (19.8–26.0) |
|
Smokers, n |
0 |
0 |
0 |
|
Driving distance, km/year, median (min–max) |
5,000 (1,000–20,000) |
5,000 (1,000–20.,000) |
4,000 (1,000–12,000) |
|
Years of driving experience, median (min–max) |
6 (3–13) |
6 (3–13) |
6 (4–10) |
|
BMI: body mass index. |
|||
The individual medians of the measurements without a brace in our experimental setting recorded a mean (SD) BRT of 410 ms (39 ms) (Table IV), which is well below the recommended margin of 600 ms. No BRT without a brace exceeded 600 ms.
|
Table IV. Braking performance with and without ankle brace |
|||||
|
Variable |
No brace |
Kallasy® |
CaligaLoc® |
Air-Stirrup® |
ASO® |
|
BRT, ms, mean (SD) F-value p-value |
410 (39) 20.537 < 0.001* |
429 (45) < 0.001** |
450 (307) < 0.001** |
440 (43) < 0.001** |
441 (49) < 0.001** |
|
RT, ms, mean (SD) F-value p-value |
181 (15) 5.969 < 0.001* |
183 (18) 0.283** n.s. |
191 (17) 0.001** |
188 (16) 0.005** |
191 (19) < 0.001** |
|
FTT, ms, mean (SD) F-value p-value |
228 (29) 21.479 < 0.001* |
244 (33) < 0.001** |
258 (42) < 0.001** |
252 (34) < 0.001** |
248 (37) < 0.001** |
|
BF, N, median (min–max) F-value p-value |
301 (66–1,449) 1.275 0.284*** n.s. |
301 (86–1,413) |
281 (89–1,265) |
305 (83–1,288) |
318 (95–1,350) |
|
*F-values (DFn = 4, DFd = 116) and p-value of repeated measures ANOVA, **p-value of paired t-test (no brace vs ankle brace), ***p-value of repeated measures ANOVA on log-transformed values. n.s.: not significant; BRT: brake response time; RT: reaction time; FTT: foot transfer time; BF: brake force; ms: milliseconds; N: newton. |
|||||
As hypothesized, the use of ankle braces reduced braking performance (see Table IV and Fig. 3). The mean difference between the measurements without and with each of the braces revealed an increase in FTT ranging from 18 ms when wearing Kallasy® to 30 ms in the case of CaligaLoc®. In contrast, RT was impaired in all cases by less than 10 ms (Table V).
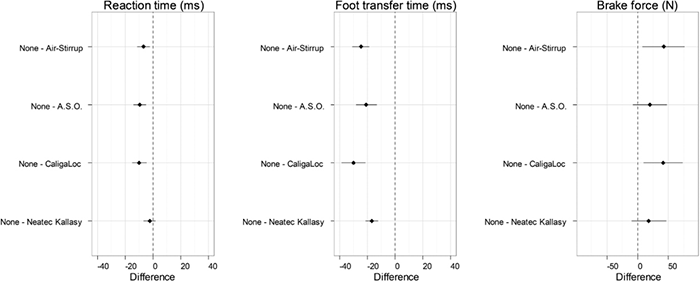
Fig. 3. Differences in reaction time (RT), foot transfer time (FTT) and brake force (BF) between the different braces and braking without a brace. Forest plots showing the mean differences and 95% confidence intervals for RT, FTT and BF between the different braces and braking without a brace. Negative values for time and positive values for brake force represent impairment in braking performance.
Post-hoc comparisons with the measurements without a brace showed that the observed differences are statistically significant for FTT and BRT with all braces (all p < 0.001), and for RT for ASO® (p < 0.001), CaligaLoc (p = 0.001) and Air-Stirrup® (p = 0.005).
No statistically significant impairment of RT was seen with the Kallasy® brace (p = 0.283).
BF was not significantly altered when wearing an ankle brace (F(4, 116) = 1.275, p = 0.284), with the mean difference BF(no brace) – BF(brace) ranging from +18 to +42 N.
To describe the clinical relevance of the observed effects, the increase in stopping distance resulting from impaired braking performance is given at a speed of 100 km/h. The total increase in stopping distance at 100 km/h would be +0.50 m for Kallasy®, +0.83 m for Air-Stirrup®, +0.85 m for ASO® and +1.11 m for CaligaLoc® (Table V). However, even in these cases, from a total of 1,200 measurements for BRT only 2 exceeded 600 ms (633 ms and 618 ms, both ASO®).
|
Table V. Clinical relevance of observed differences in braking performance |
||||
|
Variable |
Kallasy® |
CaligaLoc® |
Air-Stirrup® |
ASO® |
|
BRT, ms |
–18 (–25 to –12) |
–40 (–50 to –29) |
–30 (–38 to –22) |
–31 (–40 to –21) |
|
RT, ms |
–2 (–7 to 2) |
–10 (–15 to –5) |
–7 (–11 to –2) |
–9 (–14 to –5) |
|
FTT, ms |
–17 (–21 to –12) |
–30 (–39 to –21) |
–25 (–31 to –19) |
–21 (–28 to –13) |
|
BF, N |
18 (–10 to 47) |
42 (10 to 73) |
42 (8 to 76) |
20 (–7 to 47) |
|
Stopping distance, m |
+0.50 |
+1.11 |
+0.83 |
+0.85 |
|
Mean differences with 95% confidence intervals for all pair-wise comparisons of measurements without brace minus each intervention group and calculated increased stopping distance at 100 km/h. BRT: brake response time; RT: reaction time; FTT: foot transfer time; BF: brake force; ms: milliseconds; N: newton. |
||||
DISCUSSION
This study demonstrates that wearing an ankle brace on the right foot slightly, but statistically significantly, impairs braking performance. The observed effect is due mainly to an increase in FTT, which is prolonged by 7% in Kallasy®, 13% in CaligaLoc®, 11% in Air-Stirrup® and 9% in ASO®. The increase in total stopping distance ranges from +0.50 to +1.11 m at a velocity of 100 km/h.
Our results are in agreement with previous publications concerning immobilization of the lower extremity. Tremblay et al. (22) evaluated the effect of an Aircast Walker® (DJO Inc.®) and a walking cast of the lower limb and found significant differences for BF and BRT in these 2 groups compared with measurements without a brace. Mean BF was reduced by 18 N for walking cast and 6 N for Aircast Walker®. In their experimental setting FTT and RT could not be measured separately. The observed differences prolonged mean BRT by 23 ms with a walking cast and 33 ms with the Aircast Walker®. These differences are of a similar order of magnitude, as in our study.
Orr et al. (4) investigated the effects of a below-knee cast and a controlled-ankle-motion boot on BRT, FTT and RT. Mean BRT in the measurement without immobilization was 571 ms, which increased by 104 ms with the boot and 69 ms with the cast. These differences are 2-fold greater than those observed in our study. This could be explained by the grade of immobilization of the ankle, which in Orr’s study greatly exceeds the immobilization when wearing only an ankle brace. This phenomenon was investigated in detail by Waton et al. (23), who tested the effect of gradual immobilization of the knee using a DonJoy® knee brace (DJO Inc.®) adjusted in 30° steps from 90° flexion to 0° immobilization, and both a below- and above-knee plaster. As expected, a gradual increase in immobilization resulted in a gradual increase in FTT and TBRT. Absolute values for TBRT were also much higher for the group without a brace (approximately 1100 ms). This can be attributed to the fact that the time from the beginning of computer registration to the braking signal was up to 27 s, a value closer to the premise of an “unexpected” signal and that BPTT was also included in the measurement.
When comparing the effect on FTT alone, results obtained by Waton et al. (23) were similar to those found in our study. Although significant, the increase in FTT was less than 25 ms in all DonJoy® settings, with the exception of 0° immobilization. Complete immobilization of the ankle by a below-knee plaster alone also led to greater impairment by approximately 50 ms, compared with 30 ms in our experiment with the CaligaLoc®. In a complete plaster, however, proprioceptive, and especially tactile, information are lacking, which could account for the stronger effect in such cases.
What could explain the slight increase in RT observed in our study? Possible explanations are slower pre-motor coordination, or an increase in the moment of inertia caused by the mass and distal position of the different braces. Anson (29) showed that an increase in the moment of inertia delays simple reaction time. In his experimental set-up a weight of 176 g was attached to the wrist and simple reaction time with its components pre-motor and motor time was measured for elbow flexion with and without the weight. The observed time delay with the weight attached was approximately 9 ms. While pre-motor time remained unchanged, motor time, defined as the latency from electromyographic nerve firing to muscle reaction, was identified as the underlying cause of longer simple reaction times.
In the present study, the maximum weight difference for braking with and without a brace was 148 g, and between the different ankle braces 43 g. Moreover, both the weight and the muscle power of the leg exceed by far those of the arm. It is, therefore, not self-explanatory that the observed increase in RT can be attributed to an increase in the moment of inertia.
In Waton’s experiment (23) RT also increased when immobilizing the lower extremity. Interestingly, this significant increase in RT was also observed with the same brace, depending on its degree of immobilization. Since the weight remained identical, this suggests that slower pre-motor coordination is the cause. The reason this effect is so pronounced, especially in Waton’s study, whereas it remains moderate in our study, might partly be explained by the “unexpected” condition of the signal. The further one deviates from normal physiological movement patterns, for example due to extensive immobilization, the more apparent additional pre-motor coordination might become when the signal is not expected, in contrast to possible anticipation of the upcoming movement for an expected emergency signal.
In our study only Kallassy®, which is the lightest of the braces used, did not lead to increased RT. The other braces tested increased RT by 7–10 ms. Two explanations are conceivable for the difference between Kallassy® and the other braces. First, it could be due to the reduced weight of Kallassy® compared with the other braces. Secondly, it could be explained by the phenomenon described by Waton et al. (23); while CaligaLoc®, Air-Stirrup® and ASO® are made of non-elastic material and therefore provide a more rigid fixation, the Kallassy® boot is made of a neoprene-like fabric, which increases wearing comfort. However, in our opinion, this leads to less restriction of movement than with the other braces investigated in this study. Since the present study did not specifically register pre-motor and motor time, it cannot determine the explanation; it would be interesting to include such measurements in future experiments.
With the exception of Tremblay et al. (22), previous studies did not focus on the brake force, which in our opinion, is of importance when evaluating driving ability. Our results show that no statistically significant difference was observed when wearing an ankle brace: values remained slightly decreased. This could be due to the fact that decreased flexibility in the ankle leads to more compensatory movement coming from the knee and thus the quadriceps and hamstring muscles, which are anyway much stronger than the flexors of the ankle.
The aim of this study was to evaluate the influence of ankle braces on the ability to perform emergency braking. It does not reflect the impairment caused by an acute painful pathology.
The main strengths of the present study are the precision of the measurement instrument, the standardized methodology, the use of the most popular ankle braces, and the fact that not only braking times, but also brake force, were evaluated. Our model is also very close to reality, since it uses a real passenger cabin with reduced space around the front seat.
Although great efforts were made to create an experimental setting allowing for reliable emergency stop testing, the complexity of everyday driving cannot be entirely reflected under artificial conditions. In particular, the effect of a visual stimulus’ strength and urgency possibly overriding arthrogenic muscle inhibition would need to be investigated in further studies. Moreover, BPTT was not evaluated with this experimental set-up. However, since modern brake assist systems do not require full depression of the pedal, but rather register the mode of how the pedal is depressed for full braking activation, it would be difficult to define a standard condition for BPTT. Therefore, limiting experimental testing of MT to FTT simplifies standardizing the data. It should be pointed out, however, that especially in braces with a restricted range of motion differences in braking performance might be more pronounced when having to depress a brake pedal completely.
In conclusion, since in our study the mean BRT for all 4 braces remained below the limit of 600 ms, we would not generally warn against driving with an ankle brace. However, patients should be made aware of their slightly impaired braking performance when wearing an ankle brace, which extrapolates to an increase in total braking distance of up to 1 m at 100 km/h. This could represent the difference between a collision and the ability to stop in time. In addition, when ankle braces are not just worn prophylactically, but rather due to an acute and painful pathological condition, not just the brace will limit braking performance, but also the underlying pathology. So far it is unclear whether in these cases the effect of the brace on braking performance would be even more detrimental, or possibly beneficial due to increased stability. Further studies are needed to specifically elucidate these aspects.
ACKNOWLEDGEMENTS
This project was supported by the AKF-programme of the University of Tubingen (AKF – angewandte klinische Forschung/applied clinical research). Braces were provided by a local distributer on a contract base, granting that such support would not entail any financial or commercial obligations.
The authors would like to thank Thomas Müller (FRG) for taking the photographs of the different braces, and Avril Arthur-Goettig for proof-reading the manuscript.
Conflicts of interest: The authors have no competing interests to declare.
REFERENCES

