Marina Castel Sánchez, PT, MSc1, Johannes Bussmann, PT, PhD2, Wim Janssen, MD, PhD2, Herwin Horemans, PhD2, Sebastian Chastin, PhD3, Majanka Heijenbrok, PhD4 and Henk Stam, MD, PhD2
From the 1Physical Therapy Department of Seville University, Seville, Spain, 2Department of Rehabilitation Medicine & Physical Therapy, Erasmus MC, Rotterdam, The Netherlands, 3Glasgow Caledonian University School of Health and Social Care, Glasgow, UK and 4Rijndam Rehabilitation Centre, Rotterdam, The Netherlands
OBJECTIVES: To describe the course of walking behaviour over a period of 1 year after stroke, using accelerometry, and to compare 1-year data with those from a healthy group.
DESIGN: One-year follow-up cohort study.
SUBJECTS: Twenty-three stroke patients and 20 age-matched healthy subjects.
METHODS: Accelerometer assessments were made in the participants’ daily environment for 8 h/day during the 1st (T1), 12th (T2) and 48th (T3) weeks after stroke, and at one time-point in healthy subjects. Primary outcomes were: percentage of time walking and upright (amount); mean duration and number of walking periods (distribution); step regularity and gait symmetry (quality); and walking speed.
RESULTS: Time walking, time upright, and number of walking bouts increased during T1 and T2 (p < 0.01) and then levelled off (p > 0.30). Mean duration of walking periods showed no significant improvements (p > 0.30) during all phases. Step regularity, gait symmetry and gait speed showed a tendency to increase consistently from T1 to T3. At T3, amount and distribution variables reached the level of the healthy group, but significant differences remained (p < 0.02) in step regularity and gait speed.
CONCLUSION: In this cohort, different outcomes of walking behaviour showed different patterns and levels of recovery, which supports the multi-dimensional character of gait.
Key words: accelerometry; gait; stroke; activities of daily living.
J Rehabil Med 2015; 00: 00–00
Correspondence address: Marina Castel Sánchez, Seville University – Physical Therapy department, Calle Avicena s/n 41009 Seville, Spain. E-mail: marinacastelsanchez@gmail.com, marina_spa@hotmail.it
Accepted May 12, 2015; Epub ahead of print Jul 1, 2015
INTRODUCTION
Stroke is associated with motor impairments that result in problems with walking. The International Classification of Functioning, Disability and Health (ICF) (1) offers a model to categorize these consequences of stroke into a range of domains, including “Body function and structures”, “Activity” and “Participation”. However, not all domains have been studied equally. Clinical studies focus mainly on testing function and structures, on gait characteristics, such as speed and spatiotemporal parameters measured in a controlled setting, which do not necessarily represent gait in daily life (2), and on activity and participation assessed with questionnaires (3).
The consequences of stroke in daily life (the ICF performance qualifier) have been studied relatively little. However, this type of study has become possible over recent decades through the use of portable devices, such as accelerometers (4–6). An example is the Vitaport Activity Monitor, which has the advantage of a high-resolution detection time of a large set of body postures and motions (including walking), and which can provide accurate and reliable data on quality parameters (7–10).
Only a few studies have comprehensively and objectively examined walking behaviour (i.e. the performance of walking in a person’s daily life setting) among stroke patients (11, 12). The long-term patterns and levels of recovery of walking performance are relatively unknown.
Walking behaviour is an umbrella term involving several dimensions. Previous research has shown the potential relevance of 4 dimensions of walking behaviour: amount (6, 13); distribution (14–16); quality of gait (17, 18); and gait speed (19, 20). The amount of activities is an increasingly used parameter in studies of people with chronic conditions (6). However, there is growing evidence (14–16, 21) to support that it is not only the amount of a given activity that is important, but also how periods of activity are distributed in bouts of shorter or longer duration. Distribution has been studied for periods of physical activity, but also for sedentary behaviour, being an independent risk factor for chronic disease and poor health outcomes (22). The dimension gait quality (i.e. the way people walk) is a major issue in stroke rehabilitation (17, 18), as is gait speed, which has been shown to correlate with walking recovery after stroke (19, 20).
The primary objective of this study is to assess the recovery of walking behaviour in terms of volume, distribution, quality and gait speed over a period of 1 year following stroke. Secondary objectives were: to compare the patient data 1 year after stroke with a healthy group, in order to assess the final state of recovery compared with healthy data; to explore the mutual relationships between the different domains of walking behaviour; and to assess the recovery of some other components of patients’ physical behaviour. Since walking and mobility are important goals in post-stroke recovery, monitoring these constructs might inform clinicians about the effectiveness of current interventions and therapy, or whether an improvement in mobility was achieved by a specific dose of intervention (5, 18, 23).
METHODS
Subjects
The source population for the present study were 50 patients included in the sit-to-stand stroke study of Janssen et al. (24), recruited from the stroke unit of the Erasmus Medical Centre (Rotterdam, The Netherlands). Inclusion criteria were: (i) patients aged 20–90 years, and; (ii) who had had a stroke within the last 4 days. Exclusion criteria were: (i) comatose on day 4 post-stroke; (ii) previous stroke with persistent motor symptoms; (iii) current transient ischaemic attack; (iv) serious co-morbidity that interfered with walking; and (v) severe communication and cognitive impairment, as assessed by observing patients’ performance in response to movement instructions. All individuals provided written informed consent as approved by the ethics committee of the Erasmus Medical Center.
Healthy group data were collected from a database of 120 subjects’ measurements from previous studies at the Department of Physical Medicine and Rehabilitation of the Erasmus Medical Center. Prior written informed consent was provided to use the data for research purposes. A total of 20 healthy people, age-matched (± 4 years) to the stroke patients were included.
Design and procedure
This prospective cohort study measured daily behaviour with an activity monitor (AM) during the 1st (T1), 12th (T2) and 48th (T3) weeks after stroke. Activity monitoring took place only if a patient was capable of independently performing a sit-to-stand movement. To be included in our sample subjects with stroke must have been measured with the AM for at least 2 of the 3 scheduled measurement times. For both stroke and healthy groups, the AM was worn in their daily environment from 10.00 h to 18.00 h on weekdays.
Equipment
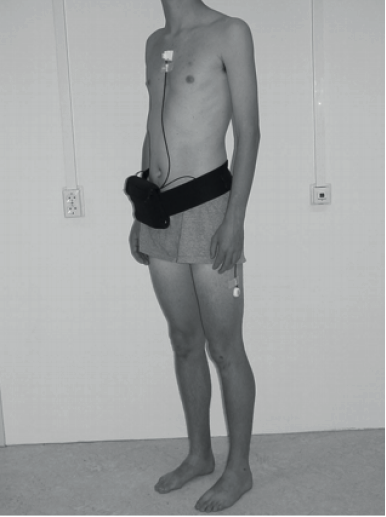
Accelerometric data were acquired with the Vitaport AM. Three piezo-resistive (1.5 × 1.5 × 1 cm) accelerometers ADXL202 (Analog Devices, Breda, The Netherlands, adapted by Temec Instruments, Kerkrade, The Netherlands) were taped to the subject’s skin. One was attached to the sternum, with the sensitive axis oriented into the sagittal, longitudinal and transverse directions, and 1 to each thigh, with the sensitive axis oriented in the sagittal direction while standing (Fig. 1). Acceleration data were stored on a Vitaport 2 recorder (sample frequency 128 Hz), transferred to a PC and analysed with the Kinematic Analysis Module of the Vitaport Analysis Package. This program automatically detects a large set of body postures, motions and transitions between postures, with a 1-s resolution (Activity Detection Time Series). Postures and motions with a duration < 5 s were disregarded (25). The monitor stored raw data, so, from the recorded files, the time-frame analysed (from 10.00 h to 18.00 h) could be checked precisely. The reliability and validity of the AM for mobility detection has been studied extensively (7–10, 26).
Outcome measures and data analysis
Amount and distribution outcomes were derived from the Activity Detection Time Series with the Kinematic Analysis Module of the Vitaport Analysis Package, except for mean duration and number of walking bouts, which were calculated from the Activity Detection Time Series with custom-made Matlab programs. Quality and gait speed parameters were obtained from Matlab. For each dimension, we distinguished primary and secondary outcome parameters. Primary outcomes were selected on the key position of walking and gait (amount), on being most easily clinically interpretable (distribution), and on being most stable (quality).
Amount. All amount outcomes are expressed as a percentage of the measured period (8 h). The ability and accuracy of the AM to capture a large and specific set of postures and motions during daily life has been supported by different studies (7–10, 25, 26). Primary outcomes were: time walking and time upright (standing and walking). Secondary outcomes were: time sitting, time lying and sedentary time (lying and sitting).
Distribution. The distribution of activities was assessed by the method described by Chastin et al. (14, 15, 21), which quantifies the distribution of activities with respect to shorter or longer periods contributing to the total time of a given activity.
Primary outcomes were:
• Mean duration of walking bouts (mu). Mu is based on the mean value of walking bouts after log-normal transformation.
• Number of walking bouts.
Secondary outcomes were:
• Walking coefficient of variation, obtained after dividing mu by S2, the standard deviation of the log-normal distribution.
• Sedentary exponent. A lower exponent indicates that subjects tend to accumulate sedentary time with a larger proportion of long sedentary bouts. Sedentary exponent was estimated using the robust maximum likelihood estimation technique (14).
Quality of walking. Gait quality parameters were calculated based on 10 walking periods throughout the 8-h AM measurement. At first, walking periods of at least 20 s, automatically determined by a custom-made software program, were selected for analysis. Then, within these periods, an interval of “stable” walking was chosen manually. The samples related to the first and the last 2 steps were excluded to avoid transitional phases of gait initiation and termination. All quality outcomes, except for step-time ratio, were computed on the basis of the unbiased autocorrelation coefficients for trunk acceleration during walking, according to Moe-Nilssen & Helbostad (27).
The primary outcomes were:
• Step regularity derived from the longitudinal trunk sensor, LAd1 (Longitudinal Autocorrelation coefficient at 1st Dominant period). LAd1 close to 1.0 reflects high step regularity.
• Gait symmetry (LAd1/LAd2) derived from the longitudinal acceleration signal. Closeness to 1.0 reflects symmetrical gait.
Secondary outcomes were:
• Stride regularity for the longitudinal and transverse directions (LAd2 and TAd2). An Ad2 (Autocorrelation coefficient at 2nd dominant period) close to 1.0 reflects high stride regularity.
• Step regularity (TAd1) and gait symmetry (TAd1/TAd2) based on the transversal acceleration signal.
• Step-time ratio. Based on the detection of heel contacts from the thigh sensors signals. The ratio was expressed as paretic step-time divided by non-paretic step-time (stroke group), and as right step-time divided by left step-time (healthy group). Closeness to 1 reflects symmetry.
Gait speed. Stroke patients’ gait speed was obtained from a 5-m walking test. For both healthy and stroke subjects an indicator of gait speed was calculated from the acceleration signals: body motility during walking. Previous research (28, 29) has shown that this measure correlates well (R = 0.88 and 0.90) (28) with gait speed.
Statistical analysis
Statistical analyses were performed using SPSS for Windows (version 17.0). The match between patients and control subjects was checked via independent-samples t-tests and χ2 tests. First, descriptive statistics were generated. Secondly, analysis of longitudinal change was performed for each outcome using linear mixed model (LMM) analysis, taking into account correlations of measurements within and between patients. Through estimating the covariance structure, this method is very flexible in handling missing data. Time of measurement was entered as a factor in each model in order to evaluate change over the total follow-up period (T1, T2, T3) and to compare changes between the individual time-points in post-hoc analyses (T1–T2, T2–T3, and T1–T3). To check the effect of multiple testing, Bonferroni corrections were also applied in the post-hoc analyses. The models were adjusted for subject’s incapability to rise independently from the chair at T1 in the LMM. Independent-samples t-tests were used to compare data between healthy and stroke groups. Finally, a correlation analysis (Pearson) was conducted to examine relationships between different domains of gait.
For all statistical analyses p < 0.05 was considered statistically significant.
RESULTS
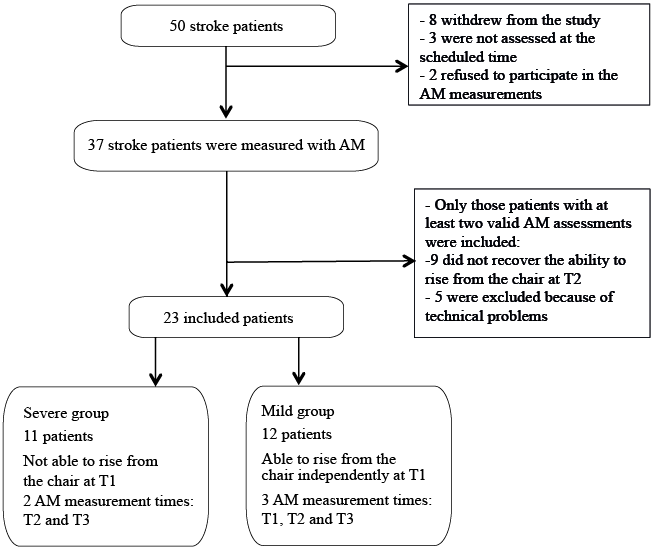
A total of 50 stroke patients was enrolled initially. Eight persons withdrew from the study after inclusion, 9 did not regain the ability to rise independently at T2, 3 were not assessed at the scheduled times, 2 refused to participate in the AM measurements, and 5 were excluded for technical reasons (missing signal for one of the sensors due to cable or connector problems at one of the measurement times). Thus, a final total of 23 stroke patients was included in the current study. Of these, 11 were not measured at T1 because they were not able to rise from the chair independently at that time (“severe” group). The remaining 12 patients are considered the “mild” group. Fig. 2 presents a flow diagram of participation. Patients with severe stroke tended to have worse walking parameters compared with those with mild stroke, but the differences did not reach statistical significance, except for the Sedentary Exponent (difference 0.052; p = 0.031 with Bonferroni correction).
At T1, 22 patients were measured in the hospital and 1 at home. At T2, 21 patients were at home, 1 in a nursing home, and another in a rehabilitation centre, whereas at T3 all subjects were measured at home. Table I shows the subjects’ demographics and the disease characteristics of stroke patients at baseline (first week post-stroke).
|
Table I. Summary of subjects’ demographics (stroke patients and healthy controls) and clinical information related to stroke patients at baseline (first week post-stroke) |
||||
|
Group |
Mild stroke groupa (n = 12) |
Severe stroke groupa (n = 11) |
Total stroke group (n = 23) |
Healthy group (n = 20) |
|
Age, years, mean (SD) |
64.33 (10.10) |
51.36 (11.82) |
58.13 (12.58) |
55.35 (12.70) |
|
Sex, F/M, n |
3/9 |
1/10 |
4/19 |
9/11 |
|
Type of stroke, n |
||||
|
Haemorrhagic |
3 |
6 |
9 |
|
|
Ischaemic |
9 |
5 |
14 |
|
|
Paretic side, n |
||||
|
Right |
6 |
6 |
12 |
|
|
Left |
6 |
5 |
11 |
|
|
Stroke localization, n |
||||
|
Basal ganglia |
2 |
4 |
6 |
|
|
Anterior cerebral artery |
2 |
1 |
3 |
|
|
Middle cerebral artery |
1 |
2 |
3 |
|
|
Unspecified |
7 |
4 |
11 |
|
|
FIM, median ± IQR |
109.5 ± 15 |
57 ± 63 |
93 ± 56 |
|
|
MAS, median ± IQR |
42 ± 10.5 |
20 ± 31 |
35 ±25 |
|
|
a”Mild group”: stroke patients who were able to rise independently from the chair at T1 (1st week); “Severe group”: stroke patients who were not able to rise independently from the chair at T1. FIM: Functional Independence Measure; IQR: interquartile range; MAS: Motor Assessment Scale; SD: standard deviation. |
||||
Most parameters were normally distributed (Shapiro-Wilk test). The variables “mean duration of walking bout” and “walking coefficient of variation” were based on a log-normal distribution.
Descriptives of the amount, distribution, quality and speed of walking are shown in Table II. Mean and standard deviation are shown for primary and secondary outcome measures at the first week (n = 12), 12th week (n = 23) and 1 year after stroke (n = 23).
|
Table II. Descriptive data for quantity, distribution, quality and gait speed outcomes |
||||
|
Dimensions |
Outcomes |
T1 (1st week) n = 12 Mean (SD) |
T2 (12th week) n = 23 Mean (SD) |
T3 (48th week) n = 23 Mean (SD) |
|
Amount |
Time walking, % |
3.65 (2.61) |
12.48 (11.11) |
11.84 (10.09) |
|
Time upright, % |
12.77 (9.75) |
27.34 (15.49) |
26.78 (13.59) |
|
|
Time sitting, % |
59.87 (16.74) |
53.22 (22.05) |
52.40 (22.80) |
|
|
Time lying, % |
24.76 (14.36) |
16.83 (18.25) |
17.61 (19.38) |
|
|
Sedentary time,% |
83.77 (11.30) |
69.92 (15.55) |
70.02 (14.36) |
|
|
Distribution |
Mean duration of walking bout (s) |
14.97 (5.47) |
16.46 (11.27) |
15.20 (7.13) |
|
Number of walking bouts |
47.67 (33.97) |
104.83 (61.16) |
112.91 (69.51) |
|
|
Walking coefficient of variation |
0.05 (0.01) |
0.05 (0.02) |
0.06 (0.02) |
|
|
Sedentary exponent |
1.27 (0.07) |
1.28 (0.07) |
1.27 (0.06) |
|
|
Quality |
Step regularity lon (LAd1) |
0.60 (0.19) |
0.61 (0.23) |
0.67 (0.23) |
|
Stride regularity lon (LAd2) |
0.53 (0.19) |
0.60 (0.24) |
0.65 (0.22) |
|
|
Gait symmetry lon (LAd1/LAd2) |
1.12 (0.13) |
1.03 (0.17) |
1.02 (0.19) |
|
|
Step regularity tra (TAd1) |
–0.64 (0.20) |
–0.60 (0.17) |
–0.64 (0.15) |
|
|
Stride regularity tra (TAd2) |
0.71 (0.16) |
0.68 (0.14) |
0.71 (0.14) |
|
|
Gait symmetry tra (TAd1/TAd2) |
–0.87 (0.20) |
–0.88 (0.15) |
–0.83 (0.32) |
|
|
Step time ratio (PST/NPST) |
1.00 (0.08) |
1.17 (0.37) |
1.15 (0.39) |
|
|
Gait speed |
5 MWT, m/s |
0.76 (0.21) |
0.95 (0.31) |
1.01 (0.27) |
|
Bod.Mot.Wal., g |
0.12 (0.03) |
0.16 (0.06) |
0.17 (0.05) |
|
|
lon: derived from the longitudinal trunk sensor; LAd1: longitudinal autocorrelation coefficient at first dominant period; LAd2: longitudinal autocorrelation coefficient at second dominant period; tra: derived from the transversal trunk sensor; TAd1: transversal autocorrelation coefficient at first dominant period; Td2: transversal autocorrelation coefficient at second dominant period; PST: paretic step-time; NPST: non-paretic step-time; 5MWT: 5-m walking test; Bod.Mot.Wal.: body motility signal during walking; g: 1 g = 9.8 m/s. |
||||
Results from linear mixed model analysis are shown in Table III and Fig. 3. An overall time effect was found for time walking, upright and sedentary time, with largest and significant changes between T1 and T2. No recovery was found for the last 9 months of the follow-up (T3 vs T2). Similar, but not significant, patterns were found for time sitting and lying.
|
Table III. Linear mixed model analysis of change over time for each outcome, presenting estimated values (mean±standard error) for 23 patients at the 3 measurement times (T1, T2 and T3), overall p-values and post-hoc comparisons (without Bonferroni correction) between assessment moments: T1 and T2 (P1–2), and T2 and T3 (P2–3) and T1 and T3 (P1–3) |
||||||||
|
Outcomes |
T1 (1st week) Mean ± SE |
T2 (12th week) Mean ± SE |
T3 (48th week) Mean ± SE |
Poverall |
P1–2 |
P2–3 |
P1–3 |
|
|
Amount |
||||||||
|
Time walking, % |
3.33 ± 2.19 |
12.45 ± 2.37 |
11.82 ± 2.14 |
0.03 |
0.01 |
0.71 |
0.01 |
|
|
Time upright, % |
8.35 ± 3.65 |
27.14 ± 3.15 |
26.58 ± 2.69 |
< 0.01 |
< 0.01 |
0.87 |
< 0.01 |
|
|
Time sitting, % |
60.69 ± 7.10 |
53.28 ± 4.67 |
52.47 ± 4.85 |
0.65 |
0.44 |
0.85 |
0.37 |
|
|
Time lying, % |
26.78 ± 5.94 |
16.92 ± 3.87 |
17.70 ± 4.07 |
0.42 |
0.21 |
0.82 |
0.26 |
|
|
Sedentary time, % |
87.37 ± 4.27 |
70.07 ± 3.19 |
70.17 ± 2.97 |
0.01 |
< 0.01 |
0.98 |
0.01 |
|
|
Distribution |
||||||||
|
Mean duration walking bouts (s) |
13.98 ± 2.10 |
16.46 ± 2.37 |
15.20 ± 1.51 |
0.59 |
0.54 |
0.30 |
0.70 |
|
|
Number of walking bouts |
26.29 ± 12.85 |
103.87 ± 12.28 |
111.95 ± 13.66 |
< 0.001 |
< 0.01 |
0.58 |
< 0.001 |
|
|
Walking coefficient of variation |
0.06 ± 0.01 |
0.06 ± 0.00 |
0.06 ± 0.00 |
0.90 |
0.99 |
0.73 |
0.74 |
|
|
Sedentary exponent |
1.24 ± 0.02 |
1.28 ± 0.01 |
1.28 ± 0.01 |
0.40 |
0.20 |
0.70 |
0.21 |
|
|
Quality |
||||||||
|
Step regularity lon (LAd1) |
0.56 ± 0.06 |
0.60 ± 0.05 |
0.66 ± 0.05 |
0.08 |
0.51 |
0.12 |
0.08 |
|
|
Gait symmetry lon (LAd1/LAd2) |
1.12 ± 0.04 |
1.03 ± 0.04 |
1.02 ± 0.04 |
0.12 |
0.10 |
0.68 |
0.048 |
|
|
Step regularity tra(TAd1) |
–0.60 ± 0.06 |
–0.60 ± 0.03 |
–0.63 ± 0.03 |
0.52 |
0.94 |
0.27 |
0.64 |
|
|
Stride regularity lon (LAd2) |
0.48 ± 0.06 |
0.59 ± 0.05 |
0.64 ± 0.05 |
0.09 |
0.14 |
0.28 |
0.04 |
|
|
Stride regularity tra (TAd2) |
0.68 ± 0.05 |
0.68 ± 0.03 |
0.71 ± 0.03 |
0.66 |
0.97 |
0.41 |
0.57 |
|
|
Gait symmetry tra (TAd1/TAd2) |
–0.82 ± 0.07 |
–0.88 ± 0.03 |
–0.83 ± 0.07 |
0.43 |
0.45 |
0.44 |
0.95 |
|
|
Step-time ratio |
1.14 ± 0.08 |
1.20 ± 0.08 |
1.17 ± 0.08 |
0.76 |
0.57 |
0.60 |
0.72 |
|
|
Gait speed |
||||||||
|
Body motility walking, g |
0.13 ± 0.02 |
0.16 ± 0.01 |
0.17 ± 0.01 |
0.10 |
0.14 |
0.59 |
0.049 |
|
|
5MWT, m/s |
0.69 ± 0.08 |
0.94 ± 0.07 |
1.00 ± 0.06 |
< 0.01 |
0.02 |
0.11 |
< 0.01 |
|
|
SE; standard error; lon, derived from the longitudinal trunk sensor; LAd1, longitudinal autocorrelation coefficient at first dominant period; tra, derived from the transversal trunk sensor; TAd1, transversal autocorrelation coefficient at first dominant period; LAd2, longitudinal autocorrelation coefficient at second dominant period; TAd2, transversal autocorrelation coefficient at second dominant period; g, 1 g = 9.8 m/s; 5 MWT, 5-m walking test. |
||||||||
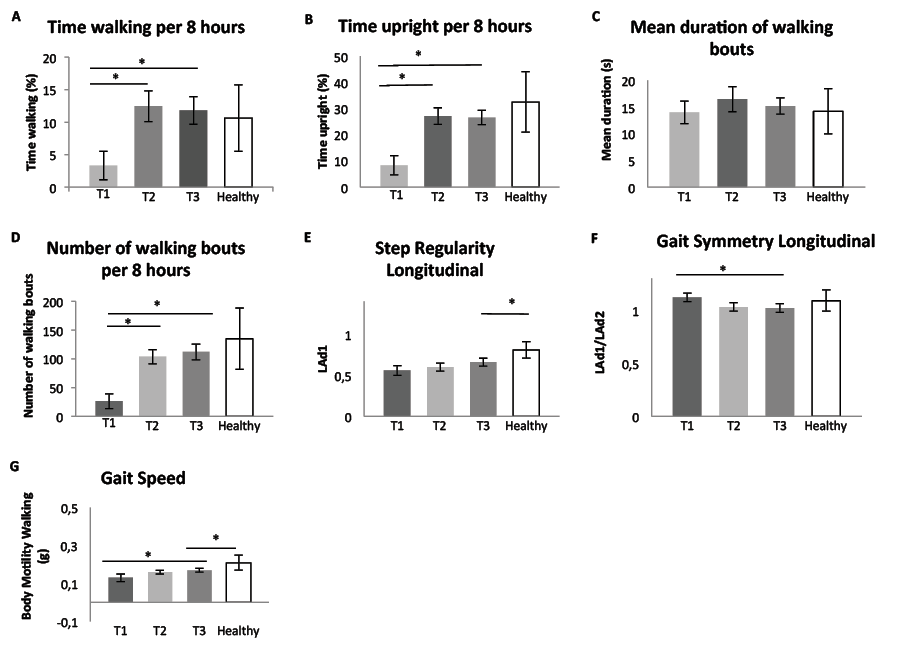
Fig. 3. Results of linear mixed model analysis at T1, 1 week after stroke onset; T2, 3 months after stroke; T3, 1 year after stroke, and comparison with the healthy control group. (A) Time walking, (B) time upright, (C) mean duration of walking bouts, (D) number of walking bouts, (E) step regularity longitudinal, (F) gait symmetry longitudinal, and (G) gait speed. *Significant differences between different measurement times (stroke group) and between stroke and healthy group at T3 (p < 0.05). Error bars at the top of each column (T1, T2, T3 and Healthy) represent ± standard error.
The number of walking bouts and walking speed (5-m walking test) showed an overall effect of measurement time with a statistically significant change from T1 to T2. Mean duration of walking bouts and the secondary outcomes of distribution did not change significantly throughout the study period.
Quality outcomes and body motility showed borderline overall time effects, with significant post-hoc differences (without Bonferroni correction) between T1 and T3 for gait symmetry longitudinal, stride regularity longitudinal and body motility. However, if we applied a Bonferroni correction and adjusted the p-values accordingly, these changes over time were no longer significant. All remaining quality outcomes showed patterns of improvements, but those were not significant throughout the first year post-stroke.
The comparisons for the primary outcomes between patients and healthy subjects at T3 are shown in Fig. 3. One year after stroke, patients showed an apparently complete recovery on the amount outcomes, except for percentage lying (17.61 vs 1.16, p < 0.01) and total sedentary time (70.02 vs 59.96, p = 0.02). Distribution outcomes were not significantly different between healthy and stroke subjects. Step regularity longitudinal and gait speed showed significant differences between both groups (p < 0.02), but other quality outcomes were not significantly different between groups.
Correlation analysis was performed for the primary outcomes measures (Table IV). The strongest relationships were found between step regularity–gait speed and time walking–gait speed and between quantity and distribution outcomes. Relationships were low or moderate for the other parameters.
|
Table IV. Correlations coefficients (p-value) between primary outcome measures for each domain of walking behaviour |
||
|
Amount |
||
|
Time walking (%) |
Time upright (%) |
|
|
Distribution |
||
|
Mean duration of walking bout |
0.76 (< 0.001) |
0.45 (< 0.001) |
|
Number walking bouts |
0.50 (< 0.001) |
0.74 (< 0.001) |
|
Quality |
||
|
Step regularity lon (LAd1) |
0.50 (< 0.001) |
0.39 (< 0.01) |
|
Gait symmetry lon (LAd1/LAd2) |
–0.28 (0.03) |
–0.17 (0.20) |
|
Gait speed |
||
|
Bod.Mot.Wal. (g) |
0.74 (< 0.001) |
0.54 (< 0.001) |
|
Distribution |
||
|
Mean duration of walking bout |
Number walking bouts |
|
|
Quality |
||
|
Step regularity lon (LAd1) |
0.32 (0.02) |
0.28 (0.04) |
|
Gait symmetry lon (LAd1/LAd2) |
–0.18 (0.18) |
–0.18 (0.19) |
|
Gait speed |
||
|
Bod.Mot.Wal. (g) |
0.53 (< 0.001) |
0.30 (0.02) |
|
Quality |
||
|
Step regularity lon (LAd1) |
Gait symmetry lon (LAd1/LAd2) |
|
|
Gait speed |
||
|
Bod.Mot.Wal. (g) |
0.65 (< 0.001) |
–0.33 (0.01) |
|
lon: derived from the longitudinal trunk sensor; LAd1, longitudinal autocorrelation coefficient at first dominant period; LAd2, longitudinal autocorrelation coefficient at second dominant period; Bod. Mot. Wal., body motility signal during walking; g, 1g = 9.8 m/s. |
||
DISCUSSION
This study showed different patterns (course over time) and different degrees of recovery (level of recovery achieved) between several domains of walking behaviour. Recovery of amount was large and rapid, reaching levels similar to those of the healthy group after 3 months. By contrast, distribution outcomes showed no significant improvements throughout the year, and data from stroke people were similar to those from normal controls at T3. At the same time, the quality and speed of walking showed small, but steady, improvement, with lower values than for healthy people, even 1 year after stroke onset.
As stated, primary amount outcomes, number of walking bouts and walking speed increased significantly over the first 3 months, but levelled off during the last 9 months. This pattern of recovery is similar to that found by Kollen et al. (30) and Askim et al. (31), who suggested that most pronounced improvements in functional outcomes occurred early after stroke. In agreement with these results, Jorgensen et al. (32) found that recovery of walking function occurred in 95% of patients within the first 11 weeks after stroke. This improvement may be due to the natural recovery processes, compensation (33), but will also be affected by environmental and personal factors, such as lifestyle and motivation. For example, in our study, most patients were hospitalized at T1, whereas they were mostly at home after 3 and 12 months. The low percentages walking and upright might be the direct result of the stroke, but also due to several conditions in the hospital, which do not stimulate patients to be active (34).
Whereas the volume of movement behaviour immediately post-stroke and its pattern of recovery might be explainable, the fact that these parameters at the 3rd and the 12th month are not different from those of the healthy group was less expected. This finding is also in conflict with other studies; e.g. Michael et al. (35) found that mean ambulatory profiles were extremely low in patients more than 6 months after stroke onset. A factor that might explain this is the duration of the measurement period. In the present study, for both healthy and stroke groups the time-frame analysed was from 10.00 h to 18.00 h. The comparison group was, at least partly, a working population, with (low) activity levels steered by occupation. In addition, it is possible that the observed overall recovery was the current clinical practice in the Netherlands, with all its clinical diversity, and in other locations different medical care might have affected the studied outcomes.
Deeper insight into patterns of behaviour is provided by the distribution analysis. On the one hand, in our distribution results, neither walking parameters (mean duration of walking bouts and walking coefficient of variation) nor sedentary exponent changed during the first year after stroke. Only the number of walking bouts improved significantly from T1 to T2. On the other hand, regarding the amount dimension, both total time walking and sedentary time experienced significant changes from T1 to T2, and levelling off from T2 to T3. Thus, our results indicate that this cohort became more active by increasing the number of active periods and not by increasing the length of these active periods.
As far as the recovery of gait pattern is concerned, although changes in quality outcomes were rather small between consecutive measurement times, all showed a tendency to steadily improve from T1 to T3. However, some significant differences were found for step regularity (LAd1) and gait speed in the comparison between stroke patients and healthy controls 1 year after stroke. That is in line with some authors (36) who described that gait asymmetry persists in the long-term post-stroke.
One striking finding of the current research was the weak correlation between the amount of walking and gait quality outcomes expressed both by the low correlation coefficients and by the different recovery patterns, with amount parameters recovering faster and to a more normal degree than quality. This divergence between quantity and quality may have negative clinical consequences. Firstly, it might be that the normal amount of walking with a non-normal quality results in a risk of overuse (e.g. of the non-paretic leg or the trunk). This might lead to increased energy cost, more fatigue, and an increased chance of musculoskeletal injury of the non-paretic leg in the long-term. This may cause patients to restrict their walking activity, leading to a decline in mobility post-stroke (3). Secondly, considering that stroke patients are walking more without sufficient recovery of gait quality, their fall risk might be increased (37). Further studies are necessary to determine which gait quality parameters make people with stroke more prone to fall.
Study limitations
This study has some limitations. Firstly, the sample was small and heterogeneous. Small differences between the groups may not have reached statistical significance because of the small sample size.
Related to distribution outcomes, the 8-h 1-day assessment could be considered short (38), but performing measurements over more days with the cabled version of the accelerometer was not practically feasible. To increase accuracy, further work with more sample days is needed.
With regard to the lack of expected significant differences between controls and patients, it is possible that measures in the present study are not sensitive enough to detect differences; further research is needed.
Finally, concerning the correlation analysis, no corrections were made for multiple testing, because the power to detect significant differences would have become too low. Hence our results must be interpreted with care.
Conclusion
The results of this study show that, for this cohort, the recovery of the amount of walking reached levels close to that of age-matched healthy levels. However, the pattern of walking was still altered and sedentary behaviour unchanged, showing that recovery of the amount of walking did not necessarily translate into change in behaviour and improved walking quality. This suggests that these aspects of walking represent different constructs. Therefore, these different constructs should be included in gait studies in order to enhance our understanding of gait performance in daily life.
REFERENCES

