Jorrit Slaman, MSc, Rita van den Berg-Emons, PhD, Siok Swan Tan, PhD, Heleen Russchen, BSc, Jetty van Meeteren, PhD, MD, Henk Stam, MD, PhD, FRCP, Marij Roebroeck, PhD and Learn2Move Research Group
From the Department of Rehabilitation, Research lines MoveFit; Transition into Adulthood, Erasmus MC, University Medical Center, Rotterdam, The Netherlands
OBJECTIVE: To evaluate the cost-utility of a lifestyle intervention among adolescents and young adults with cerebral palsy.
DESIGN: Single-blind, randomized controlled trial.
SETTING: Six university hospital/clinics in the Netherlands.
PARTICIPANTS: Fifty-seven adolescents and young adults with spastic cerebral palsy classified as Gross Motor Functioning Classification System (GMFCS) level I–IV.
INTERVENTION: A 6-month lifestyle intervention consisting of physical fitness training combined with counselling sessions focusing on physical behaviour and sports participation.
Main outcome measures: Data on quality of life, direct medical costs and productivity costs were collected using standardized questionnaires. Quality adjusted life years (QALYs) were derived from the Short-Form 36 questionnaire using the Short-Form 6D.
RESULTS: Quality of life remained stable over time for both groups. No significant differences between groups were found for direct medical costs or productivity costs. A cost-utility ratio of –€23,664 per QALY was found for the lifestyle intervention compared with no treatment.
CONCLUSION: The results of this study are exploratory, but indicate that implementing a lifestyle intervention for the cerebral palsy population might be cost-effective or cost-saving compared with offering no intervention to improve physical behaviour and fitness. However, the large range of uncertainty for the cost-utility ratio should be taken into account and the results interpreted with caution.
Key words: lifestyle intervention; physical activity; cost-effectiveness; economic evaluation.
J Rehabil Med 2015; 47: 00–00
Correspondence address: Jorrit Slaman, Erasmus Medical Center, ‘s-Gravendijkwal 230, NL-3015 CE Rotterdam, The Netherlands. E-mail: j.slaman@erasmusmc.nl
Accepted Oct 9, 2014; Epub ahead of print Feb 12, 2015
Introduction
Cerebral palsy (CP) is the most common cause of physical disability in paediatric rehabilitation medicine (1). Representing a group of permanent disorders of the development of movement and posture, CP results in activity limitation attributed to non-progressive disturbances that occurred in the developing foetal or infant brain (2). For the general population, sufficient levels of physical activity (PA) and physical fitness are known to provide psychological and physiological benefits (3, 4). An active lifestyle may be even more important in persons with CP, since it is assumed that it optimizes and maintains their physical performance in daily life (5) and prevents the development of secondary health problems later in life (6). Nevertheless, research has consistently shown that people with CP have low levels of physical fitness (7–10), low levels of PA (11–14) and high amonts of sedentary time (15). The Active Lifestyle and Sports Participation (ALSP) intervention has been developed in the Netherlands, with the aim of improving physical behaviour and fitness in adolescents and young adults with childhood onset physical disabilities (16). The effectiveness of this intervention is being studied in adolescents and young adults with spastic CP in the Learn 2 Move 16–24 study (17).
Economic evaluations are a prerequisite for the reimbursement and implementation of interventions in many Western countries, since they provide valuable information on relative efficiency compared with usual care. Costs are preferably determined from a societal perspective in which all relevant costs are included (18), such as costs incurred by patients and informal caregivers. For example, productivity costs often account for significant proportions of total healthcare expenditure (19). Following the ALSP intervention might reduce these productivity costs, which could possibly compensate for the additional cost of the intervention.
The cost-utility of a lifestyle intervention has, to our knowledge, never been evaluated in an adolescent or young adult population with CP. The lack of such analyses may explain why lifestyle interventions are rarely implemented in rehabilitation medicine in the Netherlands. The aim of the present study was therefore to estimate the cost-utility of a lifestyle intervention compared with usual care in adolescents and young adults with spastic CP.
Material and methods
This cost-utility study was performed in conjunction with the multicentre randomized clinical trial of the Learn 2 Move 16–24 study, as detailed in the study design protocol (17). In short, adolescents and young adults with spastic unilateral or bilateral CP were eligible if they met all of the following inclusion criteria: (i) age 16–24 years; (ii) GMFCS level I–IV; and (iii) a spastic type of CP as measured with the Modified Ashworth Scale (20). Exclusion criteria were: (i) disabilities other than CP that affected daily PA or aerobic capacity; (ii) contraindication to (maximal) exercise; (iii) PA level at baseline exceeding 2 standard deviations (SD) above the mean PA level of a CP population; or (iv) severe cognitive/intellectual disorders or insufficient comprehension of the Dutch language that hamper understanding of instructions about the intervention and assessments. The study had a multicentre, single-blind, randomized controlled design. After baseline measurement, participants were stratified according to their level on the Gross Motor Functioning Classification System (GMFCS) (21) to obtain an equal distribution of GMFCS levels between the experimental and control groups. Within each stratum and for each centre, participants were randomly allocated (1:1) to these groups. The experimental group received the ALSP intervention. The control group received no intervention to improve physical behaviour and fitness, which is usual care in the Netherlands. All participants provided written informed consent. The study was approved by the medical ethics committee of Erasmus Medical Center and local approval was granted by all participating centres.
Intervention
The ALSP intervention had a duration of 6 months and was developed for adolescents and young adults with physical disabilities (16). This intervention aimed permanently to increase PA and fitness levels and to reduce sedentary behaviour by promoting behavioural changes toward a more active lifestyle. The intervention consisted of 3 parts: (i) counselling on daily PA, which was based on motivational interviewing and guided by a personal coach to discuss barriers and facilitators of physical behaviour; (ii) physical fitness training, which consisted of supervised centre and home-based training and focused on increasing aerobic capacity and muscle strength; and (iii) counselling about sports participation to find suitable, accessible and appropriate sports and sports facilities in the person’s day-to-day environment. The intervention has been described in detail elsewhere (17). The clinical trial registration number is NTR1785.
Measurements
The present paper focuses on cost-utility, which was primarily conducted from a societal perspective, but the healthcare perspective was also appraised. Data on quality of life, direct medical costs and productivity costs were collected using standardized questionnaires: (i) prior to starting the intervention (T0); (ii) directly after finishing the intervention, i.e. 6 months after the start of the intervention (T6); and (iii) at follow-up, 6 months after finishing the intervention (T12). All costs were based on Euro 2009 cost data from the Dutch manual for cost research (22). Where necessary, costs were adjusted to 2009 values using the general price index from the Dutch Central Bureau of Statistics, as the ALSP intervention took place in that year.
The primary outcome measures of the randomized clinical trial are levels of PA and physical fitness. The results of the effectiveness of the ALSP intervention on these outcome measures will be reported in forthcoming publications.
Quality of life
Quality of life was measured using the Short Form-36 (SF-36, version 1 US) (23). However, the SF-36 questionnaire cannot directly be used in economic evaluations because it does not produce a preference-based single index that can be combined with life duration in order to obtain quality adjusted life years (QALYs), the metric used in cost-utility analysis (24). Therefore, SF-36 responses were converted into Short-Form-6D (SF-6D) utility scores using the University of Sheffield algorithm. The SF-6D is an algorithm for describing health and is composed of 6 multi-level dimensions (physical functioning, role limitation, social functioning, pain, mental health and vitality). This index ranges from 0 to 1 and introduces preference weights to generate health state utility values needed to construct QALYs (25).
Intervention costs
The intervention costs included a consultation by a rehabilitation physician and utilization of allied healthcare. The total number of contacts was multiplied by the 2009 reference unit prices of the corresponding healthcare service to calculate the total intervention costs (26).
Direct medical costs
The “Trimbos and iMTA questionnaire on Costs associated with Psychiatric illness” (TiC-P) was used to collect data on direct costs (27). The first part of the TiC-P consists of questions on the number of contacts with healthcare providers in the previous 3 months. Bottom-up methodology was used to calculate the total direct medical costs; that is, the total number of medical contacts (outpatient visits, hospital length of stay, etc.) was multiplied by the 2009 reference unit prices of the corresponding healthcare service. Furthermore, the TiC-P questionnaire determined the frequency and dosage of medication use. Wholesale medication costs were valued by a Dutch government website (28). To estimate the costs over the period of half a year, we used linear extrapolation, i.e. we assumed that the quartile costs measured at T6 and T12 could be taken as representative to calculate costs of the preceding 6 months. The annual costs were calculated by adding up the costs per half year. Thus, the yearly overall direct medical costs of patients with spastic CP were assessed.
Productivity costs
The productivity costs were measured with the second part of the TiC-P, which includes the Short Form of the Health and Labour questionnaire (SF-HLQ) for collecting data on productivity losses (29). The SF-HLQ consists of 3 modules that measure productivity losses: costs due to absence from paid work, reduced efficiency in paid work, and difficulties with job performance in unpaid work.
The days of absence from paid work were valued using the friction method (elasticity factor = 0.8) (30) and were calculated taking the number of days and hours of paid employment per week into account. Reference prices were applied to value the absence from paid work, which ranged from €8.67/h to €34.03/h depending on gender and age (31).
Osterhaus et al.’s method was applied to calculate costs associated with reduced efficiency in paid work (32). This method multiplies (number of days hindered) × (1 minus the indicated efficiency for these days). Respondents with paid jobs were asked to estimate the number of extra hours they should have worked to compensate for the health-related work productivity loss incurred. Reference prices were applied to value these extra hours of work, which ranged from €8.67/h to €34.03/h depending on gender and age (31).
An impediment score was estimated to assess the amount of difficulty experienced in performing unpaid work. Unpaid work was defined as household work, shopping, childcare and work around the house. Hours of unpaid work that were taken over by others were valued at €8.64/h for unpaid help and €31.94/h for paid help (31).
Statistical analysis
Differences between the intervention and control groups were assessed by means of independent sample t-tests (for normally distributed variables) or Pearson χ2 tests and Mann-Whitney U tests (for variable fractions). Using non-parametric bootstrapping (2,500 observations at random from the available patient sample), the degree of uncertainty for costs, QALYs and the cost-utility plane was examined. In addition, an acceptability curve was generated to indicate the probability that the intervention has lower incremental costs per QALY gained than various thresholds for the maximum willingness to pay for an extra QALY.
Results
A target population of 456 adolescents and young adults with CP was identified from the participating centres. Many of them had not presented to the participating centres for years, and therefore, the accuracy of their address information was uncertain. A total of 183 potential participants responded to our invitation, of whom 57 (31%) agreed to participate, and 43 completed the total study (Fig. 1). Participants who completed the intervention followed, on average, 89% of the supervised training sessions. The clinical characteristics at baseline are presented in Table I for the complete study sample and specified per allocated group, showing that control and intervention groups did not differ significantly on clinical characteristics.

|
Table I. Clinical characteristics at baseline of the complete study sample and specified per allocated group. p-values are given for differences between control and intervention groups |
||||
|
All (n = 57) |
Control group (n = 29) |
Intervention group (n = 28) |
p-value |
|
|
Gender (M/F), n |
27/30 |
15/14 |
12/16 |
0.50 |
|
Age, years, mean (SD) |
20 (3) |
20 (3) |
20 (3) |
0.64 |
|
Body mass, kg, mean (SD) |
170 (10) |
170 (9) |
169 (11) |
0.66 |
|
Height, cm, mean (SD) |
67 (18) |
65 (18) |
70 (18) |
0.24 |
|
CP type (unilateral/bilateral)*, n |
29/27 |
14/14 |
15/13 |
0.79 |
|
GMFCS level (I/II/III/IV), n |
33/18/5/1 |
16/9/3/1 |
17/9/2/0 |
0.75 |
|
Primary occupation, % |
0.36 |
|||
|
School |
73 |
79 |
68 |
|
|
Paid work |
9 |
10 |
7 |
|
|
Unemployed due to health problems |
11 |
4 |
18 |
|
|
Unemployed due to other reasons |
7 |
7 |
7 |
|
|
Paid work; primary or secondary |
29 |
28 |
30 |
0.87 |
|
Work duration/week, h, mean (SD) |
16.8 (12.0) |
17.8 (11.9) |
12.8 (4.5) |
0.75 |
|
Net income/hour, €, mean (SD) |
7.53 (2.68) |
7.76 (3.13) |
7.23 (2.21) |
0.75 |
|
Sports participation, % |
60 |
66 |
54 |
0.36 |
|
Sports duration/week, h, mean (SD) |
2.1 (3.0) |
2.4 (3.6) |
1.7 (2.2) |
0.34 |
|
*CP distribution of one person from the control group is unknown. GMFCS: Gross Motor Function Classification System; SD: standard deviation; M: male; F: female. |
||||
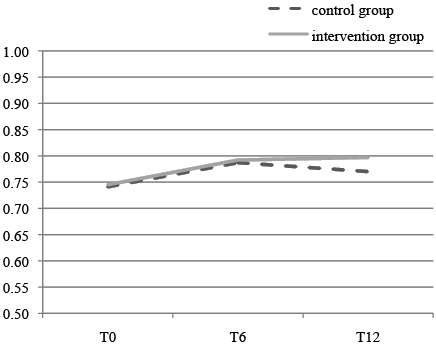
Quality of life
Fig. 2 shows the SF-6D outcomes over time for the intervention and control groups. The quality of life scores did not differ significantly between control and intervention groups at any time-point (Table II).
|
Table II. Quality adjusted life year (QALY) scores over time specified per allocated group |
||||
|
Measurement |
SF-6D index scores |
p-value |
||
|
Control group Mean (SD) |
Intervention group Mean (SD) |
Mean difference |
||
|
T0 (n = 28/28) |
0.741 (0.116) |
0.745 (0.098) |
–0.004 |
0.90 |
|
T6 (n = 24/23) |
0.787 (0.125) |
0.792 (0.116) |
–0.005 |
0.90 |
|
T12 (n = 20/20) |
0.770 (0.122) |
0.797 (0.087) |
–0.027 |
0.42 |
|
SF-6D: Short-Form 6D; SD: standard deviation. |
||||
Intervention costs
The total costs of the intervention were €496 per participant. This included one consultation with a rehabilitation physician (€96). Furthermore, 12 fitness sessions of 1 h were provided for the fitness training (12 × €50 = €600), which was in a group context with a mean of 3 participants at a time (€600/3 = €200). Finally, 6 individual counselling sessions of half an hour on daily activity (6 × €25 = €150) and 2 sessions of half an hour on sports advice (2 × €25 = €50) were deployed.
Direct medical costs
A summary of the direct medical costs per 3 months (excluding intervention costs) is shown in Table III. Frequently used healthcare resources were the general practitioner, psychological care, medical specialists and allied healthcare. At baseline 44% of the intervention group and 38% of the control group used medication. The most frequently used medications were those for pain, epilepsy or spasticity.
|
Table III. Direct medical costs (€) per respondent for the past 3 months per measurement time-point |
||||||||
|
T0 |
T6 |
T12 |
||||||
|
Intervention (n = 28) Mean (median) |
Control (n = 29) Mean (median) |
Intervention (n = 22) Mean (median) |
Control (n = 24) Mean (median) |
Intervention (n = 20) Mean (median) |
Control (n = 20) Mean (median) |
|||
|
General practitioner |
22 (0) |
14 (0) |
18 (0) |
25 (0) |
18 (28) |
19 (0) |
||
|
Industrial physician |
0 (0) |
1 (0) |
0 (0) |
0 (0) |
0 (0) |
0 (0) |
||
|
Medical specialist |
55 (0) |
40 (0) |
66 (0) |
16 (0) |
63 (0) |
24 (0) |
||
|
Allied healthcare |
78 (0) |
76 (0) |
68 (0) |
110 (0) |
58 (0) |
101 (0) |
||
|
Psychological care |
102 (0) |
158 (0) |
54 (0) |
174 (0) |
28 (0) |
118 (0) |
||
|
Social work |
39 (0) |
16 (0) |
0 (0) |
89 (0) |
3 (0) |
23 (0) |
||
|
Alternative healthcare |
0 (0) |
20 (0) |
0 (0) |
37 (0) |
0 (0) |
29 (0) |
||
|
Hospital admission |
0 (0) |
29 (0) |
0 (0) |
72 (0) |
0 (0) |
0 (0) |
||
|
Medication |
12 (0) |
17 (0) |
13 (0) |
12 (0) |
14 (0) |
16 (0) |
||
|
Total |
308 (125) |
371 (77) |
219 (140) |
537 (254) |
184 (106) |
330 (87) |
||
|
SD [IQR] |
432 [7; 476] |
673 [0; 457] |
259 [0; 334] |
623 [55; 961] |
208 [28; 298] |
620 [0; 464] |
||
|
SD: standard deviation; IQR: interquartile range (25th percentile; 75th percentile). |
||||||||
The direct medical costs per patient did not differ significantly between the intervention and control groups at the 3 measurement time-points. Annual direct medical costs (excluding intervention costs) for both the intervention and control groups are shown in Table IV. The direct medical costs for the intervention and control groups were €840 (standard deviation (SD) €757) and €1,602 (SD €2,156), respectively (p = 0.40). No significant differences were found for any of the cost components of the direct medical costs.
|
Table IV. Annual direct medical costs per patient based on the Euro 2009 cost data from the Dutch manual for cost research (22) |
|||||||||
|
Visits or lying days per |
Median costs per patient |
Mean (SD) costs per patient |
pa |
||||||
|
Control Mean n |
Intervention Mean n |
Control |
Intervention |
Control |
Intervention |
||||
|
General practitioner |
2.9 |
2.6 |
56.0 |
56.0 |
81.2 (88.0) |
72.8 (70.6) |
0.93 |
||
|
Psychological care |
5.8 |
1.9 |
0.0 |
0.0 |
578.2 (1335.9) |
174.9 (519.4) |
0.68 |
||
|
Industrial physician |
0.0 |
0.0 |
0.0 |
0.0 |
0.0 (0.0) |
0.0 (0.0) |
1.00 |
||
|
Medical specialist |
0.9 |
2.7 |
0.0 |
193.0 |
86.9 (116.7) |
260.6 (416.7) |
0.21 |
||
|
Allied healthcare |
19.7 |
10.7 |
0.0 |
0.0 |
466.6 (701.6) |
267.0 (379.1) |
0.64 |
||
|
Social work |
2.8 |
0.1 |
0.0 |
0.0 |
182.0 (403.2) |
6.5 (29.1) |
0.07 |
||
|
Alternative healthcare |
2.8 |
0.0 |
0.0 |
0.0 |
146.1 (418.1) |
0.0 (0.0) |
0.08 |
||
|
Hospital admission |
0.0 |
0.0 |
0.0 |
0.0 |
0.0 (0.0) |
0.0 (0.0) |
1.00 |
||
|
Medication |
– |
– |
4.7 |
0.0 |
60.7 (117.0) |
58.7 (129.5) |
0.66 |
||
|
Total |
– |
– |
1,001.1 |
766.2 |
1,601.7 (2155.7) |
840.5 (756.7) |
0.40 |
||
|
aMann-Whitney U (two-tailed). |
|||||||||
Productivity costs
Absence from paid work. Table IV presents the productivity costs per month due to absence or reduced efficiency at paid or unpaid work. The annual costs due to absence from paid work per patient were €82 (SD €332) and €27 (SD €122) for the intervention and control groups, respectively (p = 0.80).
Reduced efficiency in paid work. The proportion of persons with reduced efficiency in paid work is shown in Table V and was high at the 6-month measurement for both groups (33% and 22%) and low at the measurement at 12 months (0% for both groups). The differences between both groups were never significantly different. The annual costs due to reduced efficiency in paid work were €17 (SD €74) and €72 (SD €320) for the intervention and control groups, respectively (p = 0.82).
|
Table V. Productivity costs due to absence or reduced efficiency at paid or unpaid work in the past month per measurement time-point (Euro 2009) |
||||||||||
|
T0 |
T6 |
T12 |
||||||||
|
Control (n = 29) |
Intervention (n = 28) |
Control (n = 24) |
Intervention (n = 22) |
Control (n = 20) |
Intervention (n = 20) |
|||||
|
Respondents with a paid job, n |
8 |
8 |
10 |
8 |
6 |
10 |
||||
|
Share of respondents absent, % |
0 |
0 |
10.0 |
12.5 |
0 |
10.0 |
||||
|
Number of days absent, mean (SD) |
0 (0) |
0 (0) |
0.1 (0.3) |
0.1 (0.4) |
0 (0) |
0.2 (0.6) |
||||
|
Share of respondents with reduced efficiency at paid work, % |
12.5 |
12.5 |
22.2 |
33.3 |
0.0 |
0.0 |
||||
|
Share of respondents with reduced efficiency at unpaid work, % |
13.8 |
3.6 |
4.2 |
4.5 |
5.0 |
10.0 |
||||
|
Costs due to absence from work, mean (SD) |
||||||||||
|
Per respondent with a paid job |
0 (0) |
0 (0) |
9.1 (28.7) |
2.7 (7.8) |
0 (0) |
24.8 (78.3) |
||||
|
Per respondent |
0 (0) |
0 (0) |
3.8 (18.6) |
1.0 (4.7) |
0 (0) |
12.4 (55.4) |
||||
|
Costs due to reduced efficiency at paid work, mean (SD) |
||||||||||
|
Per respondent with a paid job |
2.0 (5.7) |
24.7 (70.0) |
32.6 (77.4) |
7.2 (19.3) |
0 (0) |
0 (0) |
||||
|
Per respondent |
0.6 (3.0) |
7.1 (37.4) |
13.6 (51.1) |
2.6 (11.7) |
0 (0) |
0 (0) |
||||
|
Costs due to reduced efficiency at unpaid work per respondent, mean (SD) |
||||||||||
|
Per respondent |
14.3 (50.0) |
0 (0) |
5.8 (28.4) |
0 (0) |
2.2 (9.7) |
1.7 (7.7) |
||||
|
Total productivity costs, mean (SD) |
||||||||||
|
Per respondent |
14.9 (50.0) |
7.1 (37.4) |
23.2 (73.0) |
3.6 (16.4) |
2.2 (9.7) |
14.1 (55.5) |
||||
|
SD: standard deviation. |
||||||||||

Reduced efficiency in unpaid work. At baseline approximately 3.6% of the patients in the intervention group and 13.8% of the patients in the control group had housekeeping tasks taken over. These fractions remained stable during the intervention period and did not differ significantly between the intervention and control groups at any of the measurement time-points. The annual costs of taking over housekeeping tasks were €10 (SD €46) and €55 (SD €244) for the intervention and control groups, respectively (p = 0.99).
Cost utility
Table VI shows the total annual costs and QALYs for the intervention and control groups. The mean difference in annual total costs was €310 lower for the intervention group compared with the control group (p = 0.55). Furthermore, compared with the control group, the intervention group gained 0.0131 QALY (p = 0.76). This resulted in a societal average cost-utility ratio of –€23,664 per QALY. However, the variance around this cost-utility ratio was substantial. The bootstrapping method showed that the simulated 95% confidence interval for the cost-utility ratio ranged from –€167,992 to +€129,007. The cost-utility plane (Fig. 3) shows that the intervention was dominant in 75% of cases (positive health effects and cost savings) and inferior in 8% of cases. The probability that the intervention had positive health effects was 78% (quadrants I and II), the probability for cost savings was 89% (quadrants II and III). The acceptability curve showed a probability of 86% that the costs per QALY were lower than €20,000, which is a generally accepted threshold in the Netherlands.
|
Table VI. Total annual costs and quality adjusted life years (QALYs) per patient in the intervention and control groups, expressed as mean (standard deviation; SD) |
||||
|
Intervention group (n = 20) |
Control group (n = 20) |
Incremental |
pa |
|
|
Intervention costs (€) |
496 (0) |
0 (0) |
496 |
– |
|
Direct medical costs (€) |
841 (757) |
1,602 (2156) |
–761 |
0.40 |
|
Direct medical costs including intervention costs (€) |
1,337 (757) |
1,602 (2156) |
–265 |
0.45 |
|
Total productivity costs (€) |
109 (343) |
154 (494) |
–45 |
0.84 |
|
Costs due to absence from paid work (€) |
82 (332) |
27 (122) |
55 |
0.80 |
|
Costs due to reduced efficiency at paid work (€) |
17 (74) |
72 (320) |
–55 |
0.82 |
|
Costs due to reduced efficiency at unpaid work (€) |
10 (46) |
55 (244) |
–45 |
0.99 |
|
Total costs (€) |
1,446 (848) |
1,756 (2187) |
–310 |
0.55 |
|
Quality adjusted life years (QALYs) |
0.7921 |
0.7790 |
0.0131 |
0.76 |
|
aMann-Whitney U test (2-tailed). |
||||
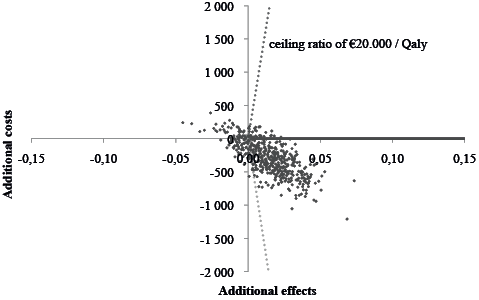
Fig. 3. Cost-utility plane. The joint distribution of costs (y-axis) and effects (x-axis) based on the Learn 2 Move trial population were calculated over 2,500 replications of the study data using the bootstrap re-sampling method and plotted on the cost-utility plane. Each point in the scatter-plot represents 1 bootstrap iteration. The probability that the intervention had positive health effects is shown in quadrants I and II, whereas the probability for cost savings is found in quadrants II and III. The acceptability curve is represented by the dotted line. All points right from this line fall below the ceiling ratio of €20,000/quality adjusted life year (QALY).
When only direct medical costs and intervention costs were included, mean incremental costs per patient were –€265 for persons following the ALSP intervention and the mean cost per QALY was –€20,229. The bootstrapped confidence interval for the cost-utility ratio was again wide, ranging from –€141,368 to +€134,174. The probability for costs savings was 85%. The acceptability curve showed a probability of 83% that the cost per QALY was lower than €20,000; an amount which is generally accepted in the Netherlands.
Discussion
To our knowledge, this is the first cost-utility study of a lifestyle intervention for adolescents and young adults with spastic CP. There were no significant differences in annual direct medical costs, annual productivity costs and total annual costs between the intervention and control groups. In contrast to findings in the literature (18, 19), our results suggest that productivity costs contribute little to the total costs. This might be explained by the small proportion of persons in the study sample that had paid work as a primary (9%) or secondary (20%) occupation. Another explanation for the low productivity costs may be that CP is a congenital condition. Therefore, in contrast to persons with acute disabilities, persons with CP may have occupations that suit their capabilities, keeping their reduced efficiency costs low. Furthermore, the majority of participants were living with their parents, possibly explaining the low reduced efficiency costs for unpaid work, as relatives may take over these unpaid tasks. QALY did not significantly differ between the 2 groups at any time and was fairly constant over time. The ALSP intervention apparently had no or minimal effects on this generic outcome. Moreover, the aim of the intervention was to affect clinical outcomes, such as physical activity or fitness, and was not directly targeted at improving generic outcomes, such as QALYs.
With a cost-utility ratio of –€23,664 per QALY, our study revealed a considerable probability that the ALSP intervention is cost-saving or cost-effective compared with offering no intervention to improve movement behaviour and fitness. This is in line with the results of a review on cost-utility studies of lifestyle interventions in the healthy population (33). However, the small variance in QALYs between participants, and the substantial variance in total costs (Table V), combined with a small sample size resulted in a wide confidence interval for the cost-utility ratio. This implies considerable uncertainty about whether to adopt the ALSP intervention from a cost-utility perspective. The uncertainty analysis, however, indicated that there is a probability of 78% that the ALSP intervention produces positive health effects, 89% that the cost per QALY gained is lower than €20,000, and 86% that the intervention saves societal costs. Although these results are exploratory, they indicate that implementing a lifestyle intervention for the CP population might be cost-effective or cost-saving.
Study limitations
Dutch reference unit prices were applied to calculate intervention costs. However, costs that are expected to account for a large proportion of total costs are ideally calculated using micro-costing methodology, because this methodology provides cost estimations that most accurately reflect actual costs. As this methodology is time-consuming, especially when administrative information systems are absent or inadequate, we chose to use Dutch reference prices.
The power of this cost-utility study was poor, as reflected in the wide confidence intervals for cost differences, implying that the study results should be interpreted with caution. This uncertainty is a common problem in cost-utility studies performed alongside randomized controlled trials, in which sample sizes are based on detecting relevant differences in clinical effects. Because the distribution of cost data is typically heavily skewed, large study populations are needed (34), which often results in a requirement for unfeasibly large sample sizes.
Conclusion
The results of the present study are exploratory, but indicate that implementing a lifestyle intervention for the CP-population might be cost-effective or cost-saving compared with offering no intervention to improve physical behaviour and fitness. However, the large ranges of uncertainty for the cost-utility ratio should be taken into account and, therefore, these results should be interpreted with caution. Further research with larger samples is required to reduce the uncertainty of these estimations.
Acknowledgements
The authors would like to thank J. W. R. Twisk for his advice on the statistical analysis of our data-set, and all the adolescents and young adults with CP who participated in this study. The following members of the Learn2Move Research Group contributed to this study: Department of Rehabilitation Medicine and Physical Therapy, Erasmus MC, University Medical Center, Rotterdam (J. van Meeteren, MD, PhD); Rijndam Rehabilitation Center, Rotterdam (W. van der Slot, MD, PhD); Sophia Rehabilitation, The Hague (F. van Markus, MD); Department of Rehabilitation, VUmc, Amsterdam (A. Dallmeijer); Rehabilitation Center De Hoogstraat, Utrecht (A. Wensink) and the Association of Physically Disabled Persons and their Parents (BOSK).
This project is part of the Dutch Learn 2 Move research programme and is supported financially by ZonMw (grant no. 89000002) and the Phelps Stichting (grant no. 2008039).
References

