Mandy M. L. Chung, MPT1, Rebecca W. Y. Chan, MPT1, Ying-Ki Fung, MPT1, Shirley S. M. Fong, PhD2, Stefanie S. L. Lam, MSc3, Charles W. K. Lai, MSc3 and Shamay S. M. Ng, PhD1
From the 1Department of Rehabilitation Sciences, The Hong Kong Polytechnic University, 2Institute of Human
Performance, The University of Hong Kong and 3 Physiotherapy Department, Shatin Hospital, Hong Kong
OBJECTIVE: (i) To investigate the intra-rater, inter-rater and test-retest reliability and minimal detectable change of the Alternate Step Test (AST) when assessing people with chronic stroke. (ii) To quantify the correlation between AST times and stroke-specific impairments.
DESIGN: Cross-sectional study.
SETTING: University-based rehabilitation centre.
PARTICIPANTS: A convenience sample of 86 participants: 45 with chronic stroke, and 41 healthy elderly subjects.
METHODS: The AST was administered along with the Fugl-Meyer Lower Extremity Assessment (FMA-LE), the Five Times Sit-To-Stand Test (FTSTS), limits of stability (LOS) measurements, Berg Balance Scale (BBS) scores, Chinese-translated Activities-specific Balance Confidence Scale (ABC-C) ratings, and the Timed “Up and Go” test (TUG).
RESULTS: Excellent intra-rater, inter-rater and test-retest reliability were found, with a minimal detectable change (MDC) of 3.26 s. AST times were significantly associated with FMA-LE assessment, FTSTS times, LOS in the forward and backward directions and to the affected side, BBS ratings and TUG times.
CONCLUSION: AST time is a reliable assessment tool that correlates with different stroke-specific impairments in people with chronic stroke.
Key words: stroke; balance; stepping; rehabilitation.
J Rehabil Med 2014; 46: 00–00
Correspondence address: Shamay S. M. Ng, Department of Rehabilitation Sciences, The Hong Kong Polytechnic University, Hong Kong (SAR), China. E-mail: shamay.ng@polyu.edu.hk
Accepted May 22, 2014; Epub ahead of print Aug 28, 2014
INTRODUCTION
Impaired dynamic standing balance is common after stroke (1). Achieving adequate dynamic standing balance is a prerequisite for independent daily functioning, including stepping and walking. Uneven weight distribution between the paretic and non-paretic legs is thought to be a major cause of impaired dynamic standing balance after stroke (2–5). One of the major aims in stroke rehabilitation is to improve dynamic standing balance in order to maximize independence in daily functioning. Thus, clinicians need a valid and reliable outcome measure which they can use to monitor and document a patient’s progress toward dynamic standing balance at different stages of rehabilitation.
The Alternate Step Test (AST) is a modified version of the stool stepping task (6), one of the tests in the comprehensive and lengthy Berg Balance Scale (BBS). It is designed to measure clinical balance performance, and it has been shown to predict fall risk among elderly subjects (7). In the stool stepping test in BBS, the participant is required to step on the stool alternately while standing unsupported until each foot has touched the stool 4 times. The process is timed with a stopwatch. In the AST, the participant is required to place the entire foot on the stool while stepping, rather than just touching the stool with the forefoot.
The AST has been shown to have good test-retest reliability (intra-class correlation coefficient (ICC) 0.78) in a study of 30 healthy participants aged 75–90 years (8). When performed as part of a BBS evaluation, stool stepping has demonstrated excellent test-retest reliability (ICC = 0.98) in a study with 38 participants aged 60–93 years, mostly with impaired balance,72% with a neurological disorder, including stroke and Parkinson’s disease (7).
Stool stepping (item 12 in the BBS evaluation) has high power in discriminating single fallers from multiple fallers, with an odds ratio (OR) of 46 (9). In addition, times on the AST longer than 10 s have been found to predict multiple falls among community-dwelling older adults with a high relative risk (RR) of 2.30 (6).
The AST inter-rater, intra-rater and test-retest reliability for use with people with stroke have not been published previously, and any correlation of AST times with stroke-specific impairments has not been systematically investigated in the stroke population.
The objectives of this study were to document the intra-rater, inter-rater, test-retest reliability and minimal detectable change (MDC) of the AST of people with chronic stroke, and to quantify the correlation of AST times with other measures of stroke-specific impairments: the Fugl-Meyer Lower Extremity assessment (FMA-LE); the Five Times Sit-to-Stand Test (FTSTS); limits of stability (LOS); Berg Balance Scale (BBS) scores; the (Chinese version of the) Activities-specific Balance Confidence Scale (ABC-C) and the Timed “Up and Go” test (TUG) times.
METHODS
Participants
A total of 86 participants were recruited. Forty-five were people with stroke (32 male, 13 female) with a mean age of 60.40 years (standard deviation (SD) 5.54) and a mean time since stroke of 7.13 years (SD 2.83). Participants were recruited from a local stroke self-help group. Forty-one healthy participants (5 males, 36 females) mean age 61.56 years (SD 5.20) were recruited from the community through a poster advertisement. Power analysis (using version 3.1.7 of the G-power software package) (10) showed that a sample size of 34 participants per group was required in order to achieve 80% power to detect an ICC of 0.95 at a confidence level of 0.05.
Participants with chronic stroke were included if they: (i) were aged 50 years or older; (ii) were at least 1 year post-stroke; (iii) were generally in a stable medical condition that allowed them to take part in the testing protocol; (iv) were able to walk more than 10 m independently with or without walking aids; and (v) had an Abbreviated Mental Test score ≥ 7 (11). Participants were excluded if they had been diagnosed with any neurological disorder aside from stroke or if they had other comorbidities that might interfere with proper assessment.
Healthy participants were recruited if they: (i) were aged 50 years or older; (ii) were able to ambulate independently with or without walking aids; and (iii) could understand and follow instructions. Participants were excluded if they had any condition such as uncontrolled diabetes mellitus or hypertension, which might affect the assessment.
Written informed consent was obtained from each participant before commencement of the study. Ethical approval was obtained from the ethics committee of the local institution, and the study was conducted according to the Declaration of Helsinki for human experiments.
Procedures
All participants with stroke were tested in 2 different sessions 7–10 days apart. Session 1 lasted approximately 90 min and session 2 lasted approximately 20 min. The AST was assessed by 2 assessors (A & B) simultaneously on both sessions. The stroke-specific impairments, including FMA-LE for stroke recovery assessment, FTSTS for lower limb muscle strength assessment, LOS and BBS for balance performance, ABC for subjective balance confidence and TUG for functional mobility assessment were examined by either assessor (Assessor A or B) during session 1. The order of the testing arrangement was randomized by drawing lots. In order to minimize the effect of fatigue, a 2-min rest was given after each trial. The data collection procedures are shown in Fig. 1.
The healthy participants were tested in a single session of approximately 20 min and only the AST assessment was performed.
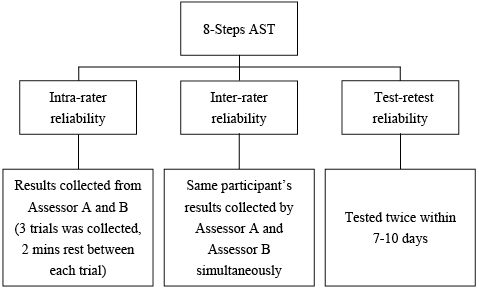
Fig. 1. Data collection procedures.
Outcome measures
Alternate Step Test. The AST is a modified version of the stool stepping task in a BBS evaluation. Like stool stepping, it is designed to challenge a participant’s weight-shifting ability in the forward and upward directions (12). An 18 cm step, 40 cm deep and 60 cm wide was used. At the beginning of the test the participant stood facing the step with double leg support and no help from any walking aid. The participant was instructed to place the entire left and right foot alternately on the step as fast as possible, 8 times for each foot in response to the count of “1. 2. 3. Go”. Each successful step involved placing the entire foot on the step and returning it to the floor. The time required for completing a total of 8 steps was measured using a stopwatch by 2 trained and experienced assessors (A and B) independently. The testing was replicated in 2 testing sessions 7–10 days apart. Each participant performed 3 trials in each session, with a 2 min rest between trials. The mean time of the 3 trials was calculated and used for further analysis.
Fugl-Meyer lower extremity assessment. The FMA-LE is a reliable tool for assessing stroke recovery (ICC = 0.83–0.95) (13). It measures lower extremity impairments including of the reflexes, voluntary control of isolated movement, and coordination (14). The FMA-LE motor function component comprises 17 items, each scored on a scale of 0 to 2, giving a maximum possible score of 34, with higher scores indicating lesser impairment.
Five Times Sit-to-Stand. The FTSTS test is used to evaluate functional lower-extremity muscle strength (15). It has been shown to have excellent reliability (ICC = 0.99) and FTSTS times are significantly associated with muscle strength in people with stroke (15). A standard chair with a seat height of 45 cm and a backrest was used for this test. Initially, participant sat upright with the arms folded across the chest, leaning against the backrest. In response to a count of 3 the participant was required to stand up and sit down as quickly as possible 5 times, maintaining the arm position and leaning their back against the backrest at the end of every repetition. The time taken for completing the task was recorded in 3 trials at each session, with 2 min rest between trials. The mean time for the 3 trials was calculated and used for further analysis.
Limits of stability. Balance Master posturography was used to assess balance performance by measuring voluntary displacement of the centre of gravity (CoG) in a designated direction without instability (16). Participants were instructed to wear a safety vest that connected to a harness support. The participant stood barefoot on the testing platform facing a computer screen displaying any displacement of the CoG. The participant was first required to maintain the cursor in the centre of a small box before each trial started. The participant was required to maintain balance and keep the feet firmly on the platform throughout the test, while shifting the body weight to move the cursor towards a sequence of target positions after a “ding” sound was heard. Four movement directions were assessed: forward and backward, and to the affected and unaffected side. Two outcome variables were measured. Movement velocity (MVL), expressed in °/s, was the mean speed of CoG displacement during the first movement toward each target. Maximum excursion (MXE), measured as a percentage of the target distance, was the maximum displacement of the CoG in the course of reaching each target position. The LOS test has shown moderate reliability in a previous study in people with stroke (ICC = 0.84–0.88) (16).
Berg Balance Scale. The BBS is a 14-item assessment tool used widely for assessing static, dynamic and transfer balance. The assessment has shown high reliability (ICC = 0.98–0.99) with stroke participants in a clinical setting (12, 16, 17). The 14 items scored on a 0–4 scale give a maximum possible score of 56. Higher scores indicate better balance.
Activities-specific Balance Confidence Scale. The ABC was established to assess self-perceptions of balance efficacy in performing a series of activities involving walking and changing position in relation to community living (18). Moderate intra-rater reliability (ICC = 0.85) has been reported among people with stroke (19). This self-administered questionnaire consists of 16 items, each scored on a 0–100 scale. The Chinese translation of the instrument was used in this study. It has previously shown high test-retest reliability (ICC = 0.99) and moderate inter-rater reliability (ICC = 0.85) with elderly community-dwelling participants (20).
Timed “Up and Go”. The TUG test was first developed for assessing the functional mobility of frail elderly persons (21). Excellent reliability (ICC > 0.95) has been shown in a previous study of people after stroke (22). In this study each participant was required to stand up from sitting, walk forward 3 m at their usual walking pace, turn around, walk back and sit down with their back leaning against the backrest, all using any usual walking aid. The time taken for completing the task was recorded in 3 trials, with 2 min rest between trials. The mean time of the 3 trials was calculated for further analysis.
Statistical analysis
All statistical analysis was undertaken using SPSS version 16.0. Descriptive statistics were compiled to summarize the demographic data. A Shapiro-Wilk test was used to assess the normality of the entire dataset. Homogeneity of variance was tested with Levene’s test for quality of variance. As some of the data collected were not normally distributed, non-parametric statistics were computed.
Intra-class correlation coefficients (ICCs) were calculated to quantify inter-rater reliability (ICC3,2) of AST results for a single participant between the 2 trained and experienced assessors on days 1 and 2. An ICC3,1 compared the AST results of Assessor A and Assessor B across trials, while an ICC2,1 quantified the test-retest reliability of the AST between days 1 and 2. An ICC > 0.75 is indicative of good reliability and an ICC between 0.5 to 0.75 is indicative of moderate reliability (23). By using the test-retest reliability results, the minimal detectable change (MDC) was calculated using the following formula (23):
MDC = 1.96 × SEM ×√2

whereas the standard error of measurement (SEM) value of the AST times was calculated from the following formula (23):
SEM = Sx√1–rxx

where Sx is the SD of the AST times and rxx is the reliability coefficient.
Spearman’s rho correlation coefficients were used to assess the relationship between AST scores and the other test outcomes (FMA-LE, FTSTS, LOS, BBS, ABC-C and TUG). The strength of correlation was categorized as little or none for r < 0.25), fair for an r range of 0.25–0.50, moderate to good for r in the range 0.50–0.75 and good to excellent for r > 0.75 (23). A confidence level of 0.05 was set for all analyses.
RESULTS
Demographic data describing the participants and the mean values of all the outcome measures are shown in Tables I and II, respectively. Table III shows the inter-rater (ICC = 0.991–0.999), intra-rater (ICC = 0.946–0.955) and test-retest reliability (ICC = 0.909–0.952) of the AST times for the participants with stroke, respectively. A MDC value of 3.26 s was obtained.
The correlation between AST times and stroke-specific impairments are shown in Table IV. Highly significant positive correlation was found with FTSTS (r =0.52, p < 0.001) and TUG (r = 0.72, p < 0.001) times. Significant negative correlation was also found between AST times and FMA-LE scores (r =–0.69, p < 0.001), LOS-MVL in the forward, backward and affected side directions (r =–0.32, –0.53 and –0.32, respectively, p ≤ 0.05 in all cases), LOS-MXE in the forward and backward directions (r =–0.21 and –0.26, respectively, p ≤ 0.05 in both cases) and BBS scores (r =–0.55, p < 0.001).
|
Table I. Demographics in participants with stroke and healthy elderly subjects |
||
|
Parameters |
Stroke subjects (n = 45) |
Healthy elderly subjects (n = 41) |
|
Age, years, mean (SD) |
60.40 (5.54) |
61.56 (5.2) |
|
Sex, M/F, n |
32/13 |
5/36 |
|
Height, cm, mean (SD) |
160.52 (6.60) |
156.03 (7.40) |
|
Weight, kg, mean (SD) |
66.09 (9.73) |
59.02 (9.12) |
|
Body mass index, kg/m2, mean (SD) |
25.59 (2.97) |
24.17 (3.57) |
|
Fall in the past 6 months, mean (SD) |
0.18 (0.65) |
N/A |
|
Mobility status (unaided/stick/SBQ), n |
23/19/3 |
N/A |
|
Leg length, cma, mean (SD) |
46.03 (2.81) |
44.64 (3.09) |
|
aFrom fibular head to floor in sitting position and with feet on the ground. SD: standard deviation; M: male; F: female; SBQ: small-base quadripod; N/A: not available. |
||
|
Table II. Outcome measures in participants with stroke and healthy elderly subjects |
||||
|
Observation |
Stroke subjects |
Health elderly subjects Mean (SD) |
||
|
Mean (SD) |
Median (IQR) |
|||
|
AST, s |
15.53 (5.40) |
7.89 (2.81) |
||
|
FMA-LE |
24 (20, 26) |
N/A |
||
|
FTSTS, s |
15.79 (4.73) |
N/A |
||
|
LOS-MVL, °/s |
N/A |
|||
|
Forward |
2.10 (0.95) |
N/A |
||
|
Backward |
1.90 (1.14) |
N/A |
||
|
Unaffected side |
3.23 (1.30) |
N/A |
||
|
Affected side |
3.30 (1.24) |
N/A |
||
|
LOS-MXE, % |
N/A |
|||
|
Forward |
59.16 (14.72) |
N/A |
||
|
Backward |
50.14 (20.38) |
N/A |
||
|
Unaffected side |
76.56 (12.55) |
N/A |
||
|
Affected side |
65.01 (21.06) |
N/A |
||
|
BBS |
54 (50, 55) |
N/A |
||
|
ABC-C |
71.25 (61.25, 87.19) |
N/A |
||
|
TUG, s |
18.41 (6.64) |
N/A |
||
|
Aid used in TUG (Unaided/Stick/SBQ) |
44/1/0 |
N/A |
||
|
SD: standard deviation; IQR: interquartile range; AST: Alternate Step Test; FMA-LE: Fugl-Meyer Motor Assessment for the Lower Extremities; FTSTS: Five Times Sit-To-Stand test; LOS: limits of stability; MVL: movement velocity; MXE: maximum excursion; BBS: Berg Balance Scale; ABC-C: Chinese translated Activities-Specific Balance Confidence scale; TUG: Timed Up and Go Test; SBQ: small-based quadripod; N/A: not available. |
||||
|
Table III. Inter-rater reliability of Alternate Step Test (AST) for participants with stroke |
|||
|
Mean score, s (SD) |
|||
|
Reliability of AST |
ICC3,2 (95% CI) |
||
|
Rater A & B |
|||
|
Day 1 |
16.36 (5.82) |
0.999 (0.998–0.999) |
|
|
Day 2 |
14.70 (5.10) |
0.991 (0.984–0.995) |
|
|
Reliability between 3 trials |
ICC3,1 (95% CI) |
||
|
Rater A |
|||
|
Day 1 |
16.42 (5.85) |
0.948 (0.917–0.969) |
|
|
Day 2 |
14.66 (4.99) |
0.951 (0.921–0.971) |
|
|
Rater B |
|||
|
Day 1 |
16.30 (5.79) |
0.946 (0.914–0.968) |
|
|
Day 2 |
14.75 (5.23) |
0.955 (0.927–0.973) |
|
|
Reliability between Days 1 and 2 |
ICC2,1 (95% CI) |
||
|
Rater A |
15.54 (5.36) |
0.952 (0.770–0.982) |
|
|
Rater B |
15.52 (5.44) |
0.909 (0.626–0.966) |
|
|
AST: alternate step test; SD: standard deviation; ICC: intraclass correlation coefficient; CI: confidence interval. |
|||
|
Table IV. Correlation between Alternate Step Test (AST) and other tested variables |
|||
|
Correlation of AST |
p-value |
||
|
FMA-LE |
–0.69** |
< 0.001 |
|
|
FTSTS |
0.52** |
< 0.001 |
|
|
LOS-MVL |
|||
|
Forward |
–0.32* |
0.03 |
|
|
Backward |
–0.53** |
< 0.001 |
|
|
Unaffected side |
–0.11 |
0.483 |
|
|
Affected side |
–0.32* |
0.033 |
|
|
LOS-MXE |
|||
|
Forward |
–0.21* |
0.043 |
|
|
Backward |
–0.26* |
0.012 |
|
|
Unaffected side |
–0.28 |
0.065 |
|
|
Affected side |
–0.27 |
0.073 |
|
|
BBS |
–0.55** |
< 0.001 |
|
|
ABC-C |
–0.16 |
0.296 |
|
|
TUG |
0.72** |
< 0.001 |
|
|
*p < 0.05; **p < 0.001. AST: Alternate Step Test; FMA-LE: Fugl-Meyer Motor Assessment for the Lower Extremities; FTSTS: Five Times Sit to Stand test; LOS: limits of stability; MVL: movement velocity; MXE: maximum excursion; BBS: Berg Balance Scale; ABC-C: Chinese translated Activities-Specific Balance Confidence scale; TUG: Timed Up and Go Test. |
|||
DISCUSSION
This is the first study to investigate the intra-rater, inter-rater, test-retest reliability and MDC of the AST for people with chronic stroke, and the correlation between AST times and the results of other assessments (the FMA-LE, FTSTS, LOS, BBS, ABC-C and TUG).
Reliability of the AST in assessing people with chronic stroke
The AST is a well-known functional mobility assessment and 1 item of the BBS for determining the risk of falling in elderly subjects. In this study, standardized testing procedures were formulated for the assessors. Participants were given clear instructions, and 2 min of rest was provided between trials to avoid fatigue. This could explain the excellent inter-rater reliability observed when 2 different assessors timed the same individual in trials. Meanwhile, the test-retest reliability statistics show that a participant’s AST performance also had excellent stability when re-tested within 7–10 days. Thus, the 7–10-day interval was apparently sufficient to minimize learning effects without allowing too much change in body conditions. The MDC value calculated in the current study was 3.26 s, which represents the minimum change needed to reflect true change in AST times. This MDC value can be used to determine any true change in dynamic standing balance ability caused by the intervention protocol.
Taken together, the results show that the AST is reliable even when using different examiners. It can be recommended for testing people with chronic stroke in clinical practice.
Performance of the AST in assessing people with chronic stroke
It was surprising that these participants took longer to complete the AST (mean 15.53 s) compared with those people with stroke in previous studies (10.60 s) (24), despite the fact that these participants were younger (mean age 60.40 vs 80.10 years). There are several possible reasons for the difference. First, the severity of impairment was presumably different in the 2 studies. The participants in this study had a mean ABC-C score of 74.07, and 62.2% scored < 80. A previous study has demonstrated that participants with ABC scores < 80 have significant subjective balance deficits (25). These participants also had weaker lower limb muscle strength (a mean FTSTS time 15.79 s) than those people with stroke in previous study (12.10 s) (24).
The people with stroke, of course, took longer (15.53 s) to complete the AST than the healthy participants (7.89 s). Their stroke-specific impairments included spasticity and weakness of the lower limbs, which would be expected to affect their AST times. The impairments were presumably a result of abnormal motor recruitment and discharge firing rate for voluntary muscle control, which might result in decreased muscle strength, muscle control and stability (26). In addition, people with stroke tend to learn compensatory strategies, such as caution during stepping. In performing the AST this would lengthen the stance and swing times of 1 or both limbs (27).
By contrast, the healthy participants in this study took less time to complete the AST (mean 7.89 s) than those reported in the literature for community-dwelling participants (10.80–12.20 s) (6) and (9.70 s) (24). Many of these participants were still in the workforce and relatively young compared with the healthy participants of previous studies.
Tiedemann et al. reported mean AST times of 10.80 s and 12.20 s for elderly persons who had fallen once or not fallen, and elderly persons who had experienced multiple falls within the previous year, respectively. They also suggest a cut-off time of 10 s to discriminate single from multiple fallers (6). Whether this cut-off could be applied to the participants like those tested here requires further investigation.
Correlations between AST times and other assessment results
FMA-LE scores. Good negative correlation was found between AST times and FMA-LE scores (r =–0.69, p < 0.001). The FMA-LE is a common outcome measure for determining motor impairment level. It assesses the reflexes, voluntary control of isolated movement, and coordination. Unlike a unilateral stepping test, the AST requires both the paretic and non-paretic leg to step. During paretic leg stepping, coordination of the lower limb muscles of the paretic leg is required to perform a smooth movement sequence of knee and hip flexion and extension. During non-paretic leg stepping the paretic leg is maintained in single-leg stance. Similar correlation has been reported between FMA-LE scores and stair-walking times (28).
FTSTS times. Moderate positive correlation was found between AST times and FTSTS times (r = 0.52, p < 0.001). A previous study has reported strong negative correlation (r = –0.75 to –0.83, p ≤ 0.01) between FTSTS times and knee flexor strength. Moreover, balance ability is known to be an important determinant of FTSTS performance (29). It is therefore reasonable to expect significant correlation between AST and FTSTS times.
In the fast-paced AST, the participants were required to place alternate feet on the step as quickly as possible. Placing a foot on the step calls for adequate hip and knee flexor and ankle dorsiflexor strength in the stepping leg. Bringing it down again requires adequate hip and knee extensor and ankle plantarflexor strength in the stepping leg.
LOS. Modest, but significant, negative correlation was found between AST times and the LOS results (r = –0.21 to –0.53, p < 0.05). MXE and MVL are defined as the maximum distance achieved and the mean speed of the centre of gravity (CoG), respectively. In a complete stepping manoeuvre each foot is required to move forward and upward during stepping up, then backward and downward when stepping down again. This could explain why a significant correlation was found only with the forward and backward limits, but not sideways direction in the LOS measurements.
Since the AST calls for little displacement of the CoG compared with those in the LOS trials, the modest correlation between the AST times and the LOS MVL/MXE values is not surprising. Adequate visual perception and attention is required for a participant to effectively track the cursor when shifting the CoG to a specific direction in the LOS test. Whether visual perception and attention affected the observed LOS results needs further investigation.
BBS scores. The moderate negative correlation observed between AST times and BBS scores (r = –0.55, p < 0.001) was comparable with those of previous studies using a unilateral step test (r = 0.73, p ≤ 0.006) stair walking times (r = –0.68 to –0.70, p ≤ 0.001) with people with stroke (28, 30).
The AST involves balance-related tasks, including single- and double-leg stance and stepping. Rapid shifting of the CoG in different directions is also required in order to complete 8 steps safely and effectively. Moreover, the AST is similar to specific testing items in a BBS assessment. This could explain the close correlation between AST times and BBS scores. For example, items 3 and 14 of the BBS involve unsupported single- and double-leg stance, as in the AST. Item 12 is an alternate step test in which both the speed and quality of movement are examined.
ABC-C scores. It is surprising to note that there was no significant correlation between the AST times and ABC-C scores. Wong’s group also reported no significant correlation between ABC-C scores and figure-of-8 walk times involving curved path walking (31). However, a previous study has reported modest, but highly significant, positive correlations with both BBS scores (r = 0.36, p ≤ 0.001) and gait speed (r = 0.48, p ≤ 0.001) among people with stroke (19). Botner’s study indicated that a component in the ABC was a measure of balance self-efficacy as perceived during low-risk or high-risk activities (19). The discrepancy in correlation with ABC-C scores could be explained by the fact that the components of the ABC are rather closely related to the activities of daily living, which is somewhat different from the physical ability measured in the AST.
TUG times. Excellent positive correlation was found between AST times and TUG times (r = 0.72, p < 0.001). TUG is a complex task that involves standing up from sitting, walking, turning and sitting down again. The rising movement is similar to those of the FTSTS test, whereas the turning component requires adequate balance ability as reflected in the BBS. This could explain why AST times would have a stronger correlation with TUG times compared with those of the FTSTS (r = 0.52, p < 0.001) and BBS (r = –0.55, p < 0.001).
Limitations
The AST is a complex task and involves different abilities, some of which were not examined in this study, such as vision and attention. In addition, the AST only assesses speed in completing the task, not the quality of movement. It should be noted that the majority of the participants with stroke were men, while the majority of the healthy participants were women. Gender differences in muscle strength are well known, and strength and balance are highly related to the performance of such functional tasks (24). Strictly speaking, the results of this study can only be applied to people with stroke who satisfy the same inclusion criteria, and certainly not those with strong spasticity or much more severe stroke sequelae. Further investigation with a larger sample promises to yield more robust correlation results.
Conclusion
This study has shown that the AST has excellent intra-rater, inter-rater and test-retest reliability with an MDC value of 3.26 s for people with chronic stroke. Moreover, AST times were shown to be significantly correlated with FMA-LE scores, FTSTS times, LOS (in the forward and backward directions), BBS scores and TUG times. The AST is therefore a reliable and effective clinical assessment tool for assessing the functional balance in stepping of people with chronic stroke. Further study with a larger sample and participants with different degrees of impairment is warranted.
ACKNOWLEDGEMENTs
This study was supported by the General Research Fund (Ref: 562413) from the Research Grants Council, Hong Kong to Dr Shamay Ng and her team.
The authors would like to thank Dr Raymond C. K. Chung for statistical advice.
REFERENCES

