Åsa Nordin, MSc, Margit Alt Murphy, PhD and Anna Danielsson, PhD
From the Institute of Neuroscience and Physiology, Sahlgrenska Academy, University of Gothenburg, Gothenburg, Sweden
OBJECTIVE: To examine the intra- and inter-rater reliability of the Action Research Arm Test (ARAT) at the item level after stroke.
DESIGN: An intra-rater and inter-rater reliability study.
SUBJECTS: Thirty-five participants (median age 62 years, median time post-stroke 22 months) with impaired upper extremity function after stroke were included in the study.
METHODS: Two physiotherapists simultaneously, but independently, assessed the participants’ performance in all 19 items of the ARAT twice in 1 day. A rank-based statistical method for paired ordinal data, including calculation of percentage agreement (PA), systematic disagreements (relative position (RP), relative concentration (RC)) and individual variability (relative rank variance (RV)) was used.
RESULTS: Satisfactory intra-rater and inter-rater agreement was noted for all items except item 19, which was just below satisfactory level. Within and between raters, small but non-negligible systematic disagreements were found for items 11, 14 and 19 and for items 1, 4, 17 and 19, respectively. There was no disagreement due to random variance within or between raters.
CONCLUSION: The ARAT is a highly reliable observational rating scale at the item level after stroke. Awareness regarding the small systematic disagreements demonstrated in some items is, however, recommended when using ARAT.
Key words: cerebrovascular accident; psychometrics; outcome assessment (healthcare); upper extremity; statistics; nonparametric; reproducibility of results.
J Rehabil Med 2014; 46: 00–00
Correspondence address: Åsa Nordin, Rehabilitation Medicine, Institute of Neuroscience and Physiology, Sahlgrenska Academy, University of Gothenburg, Per Dubbsgatan 14, SE-413 45 Gothenburg, Sweden. E-mail: asa.nordin@neuro.gu.se
Accepted March 4, 2014; Epub ahead of print Jun 19, 2014
INTRODUCTION
Impaired upper extremity function after stroke has been reported in approximately 70% of survivors in the acute stage and in 40% 3 months after stroke onset (1, 2). This has a negative impact on activity levels (3), participation, and quality of life in individuals with stroke (4), and is reported as a problem by the vast majority 4 years after stroke among those who have participated in stroke rehabilitation (3).
The Action Research Arm Test (ARAT) (5) is an observational rating scale of upper extremity performance that is frequently used in research and clinical practice (6). It incorporates 4 basic movements: grasp, grip, pinch and gross movement, and is assessed on a 4-category ordinal scale (5). The reliability of the ARAT has been evaluated in several studies in persons with stroke (7–10), using reliability coefficients such as Spearman’s rank correlation coefficient (ρ) and intraclass correlation coefficient (ICC). These statistical methods are valid for measuring the strength of an association between 2 assessments, but are limited for evaluation of agreement between assessments (11). Mean difference and 95% limits of agreement (LOA), along with Bland Altman plots and weighted Kappa, have also been used to assess the reliability of the ARAT (12) in persons with stroke.
Thus, in previous studies, the reliability of the ARAT has been evaluated predominantly for the total and subtest scores using statistical analysis appropriate for continuous data (7–10). There is, however, one study of the reliability at item level, but the results were presented only for the subtests and total scores, which makes interpretation difficult. A greater knowledge of reliability at the item level is needed in order to identify problematic items that might need special attention. The aim of the study was to examine the intra-rater and inter-rater reliability of the individual items of the ARAT in persons with impaired upper extremity function after stroke.
METHODS
Subjects
Thirty-five participants were included in the study based on a sample of convenience. The participants were current or former patients at a rehabilitation clinic, or recruited through a patient organization. Inclusion criteria were: impaired upper extremity function; at least 6 weeks after stroke onset; and age 18 years or older. Exclusion criteria were: absence of active movement in the affected arm; other disorders not related to the stroke affecting upper extremity function; and inability to follow instructions or understand Swedish. Participant characteristics are summarized in Table I. This study was approved by the Regional Ethical Review Board. Informed written consent was obtained from all participants.
|
Table I. Demographic and clinical characteristics (n = 35) |
|
|
Characteristics |
|
|
Female/male, n |
8/27 |
|
Age, median (Q1–Q3) [range] |
62 (51–65) [31–79] |
|
Month post-stroke, median (Q1–Q3) [range] |
22(3–41) [2–120] |
|
Infarct/haemorrhagic/both, n |
14/17/4 |
|
Hemiparesis, left/right, n |
17/18 |
|
Visual inattention, n |
7 |
|
Language comprehension disorder, n |
6 |
|
FMA-UE, median (Q1–Q3) [range] |
45 (35–52) [15–66] |
|
Sensory disorder UE, n |
19 |
|
Pain UE, n |
14 |
|
Spasticity UE, n |
19 |
|
Degree of disability, MRS, n |
|
|
No significant disability |
2 |
|
Slight disability |
19 |
|
Moderate disability |
9 |
|
Moderate severe disability |
5 |
|
CI: confidence interval; FMA-UE: Fugl-Meyer Assessment of Upper Extremity (0–66); Q1–Q3: first and third quartile; MRS: Modified Rankin Scale. |
|
Action Research Arm Test
The ARAT, developed in 1981 by Lyle (5), is a performance test to assess upper extremity function and dexterity after stroke. Specifications regarding the original scoring of ARAT have been suggested by several authors in order to improve the test (12, 13). In 2008, Yozbatiran et al. (7) presented a standardized approach along with a detailed test manual. This ARAT protocol and manual was translated into Swedish according to a standard forward and backward translation protocol (14). The final Swedish version was discussed until consensus was reached, and approved by an expert group that comprised 3 experienced physiotherapists, 2 occupational therapists and a rehabilitation physician. This version was used in the present study.
The ARAT consists of 19 items and a standardized test kit (Sahlgrenska University Hospital, Gothenburg, Sweden) is used (Fig. 1). The person’s performance at every item is assessed on a 4-level ordinal scale (0 = unable to complete any part of the task within 60 s, 1 = the task is partially performed within 60 s, 2 = the task is completed but with great difficulty or takes an abnormally long time (5–60 s), or 3 = the task is performed normally within 5 s) (7). The ARAT is divided into 4 subtests; grasp (6 items; 0–18 points), grip (4 items; 0–12 points), pinch (6 items; 0–18 points) and gross movement (3 items; 0–9 points). Upper extremity function is assessed unilaterally, starting with the less affected side. Subtest scores are added to calculate a total score for each side, ranging from 0 to 57 points. Each subtest in the ARAT is arranged in a hierarchical order, in which the most difficult item is tested first, followed by the easiest item, then items with gradually increasing difficulty.
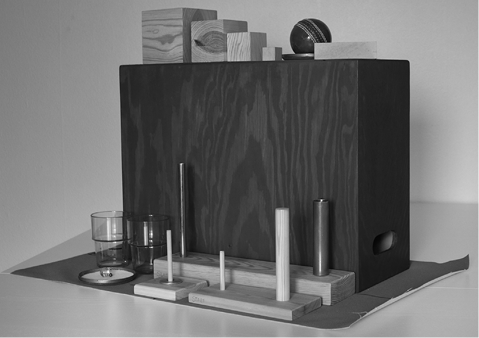
Fig. 1. The Action Research Arm Test (ARAT) test kit.
Previous studies, using the standardized version of ARAT (7), report very clear association within the same rater for the total score (ICC = 0.97–0.99, Spearman’s ρ = 0.99) and for the subtests (ICC = 0.93–0.98, ρ = 0.91–0.98) (7, 8). Association between raters has also been reported to be strong for the total score (ICC = 0.92–1.0, ρ = 0.96) as well as for the subtests (ICC = 0.98–0.99, ρ = 0.93–1.00) (7, 8).
Procedure
Two physiotherapists, with 4 and 30 years of clinical experience in stroke rehabilitation, respectively, and up to 1 year’s experience of using the ARAT, performed all assessments of the ARAT. To ensure uniform interpretation of the manual and scoring, 2 pilot assessments were conducted prior to the study. If disagreements occurred in scoring during these assessments, discussions between the raters took place until consensus was reached.
All 19 items were tested in the current study. In order to accelerate the test procedure, items in subtests “grasp” and “pinch” were assessed first, since the same set up was used in both of these subtests. Thereafter, the subtests “grip” and “gross movement” were tested. In order to facilitate understanding of the instructions for the subtest “pinch”, the items were presented in the following order: 14, 13, 11, 12, 16, 15 (see Table II).
The 2 raters (A and B) assessed the participants’ performance on the ARAT on 2 occasions (1 and 2) on the same day, separated by a 1-h rest. The raters observed and scored independently the participant’s performance during the same session. The role of being the test leader was altered between rater A and B, but the same therapist led the test on both occasions for one patient. The other therapist did not intervene during the test leader’s instructions of the items, while both therapists were allowed to ask the participant to repeat an item up to 3 times. The therapists did not communicate regarding the test procedure or the scoring, during and between the 2 test occasions. Upper extremity function was tested on both sides, but only data from the affected arm was used for analysis. If both arms were affected, data from the more affected side was used. The test took approximately 15 min to complete.
Additional clinical assessments
General level of disability was assessed using the Modified Rankin Scale (15). Motor function was examined with the Fugl-Meyer Assessment for Upper Extremity (FMA-UE) (16), in which the maximum score is 66. Sensory disorder and pain during passive joint motion was registered as present if the non-motor domain score of the FMA-UE (sensibility 0–12, pain 0–24) was ≤ 11 or ≤ 23, respectively. Muscle tone in the elbow, wrist and finger flexors was assessed using the Modified Ashworth Scale (0–4) (17) with a score ≥ l indicating spasticity. A language comprehension disorder was registered if the score on the language comprehension domain (0–2) of the Barrow Neurological Institute Screen for Higher Cerebral Functions was ≤ 1 points (18). Visual inattention was defined as a score of < 52 points on the Star Cancellation Test (0–54) (19).
Statistical analyses
The reliability within and between raters was examined both at the item, subtest and total score levels. The degree of total agreement, both within and between raters, was assessed with percentage agreement (PA) (20). Kadzin (21) suggested a PA ≥ 70% as satisfactory. The suggested minimal important difference for the total ARAT score is 6 points (22). For this reason, complete agreement for the total score was considered when the difference between assessments was no more than 5 categories. For the subtests “grasp” (0–18) and “pinch” (0–18), ± 2 categories was considered as complete agreement, and for the subtests “grip” (0–12), and “gross movement” (0–9), ± 1 category was used.
The reliability within and between raters was further investigated by using a method described by Svensson (23). This is an augmented ranking approach, particularly designed for analysis of disagreements in paired ordinal data. This rank-invariant method takes account of the information given about the pairs of assessments, and provides identification and estimates of systematic disagreements in assessments (relative position (RP) and relative concentration (RC)), separately from disagreements caused by individual variability in assessments, (relative rank variance (RV)) (23). RP expresses the extent to which the distribution of scores from one assessment is systematically shifted towards higher or lower scale categories, than scores from another assessment. RC expresses the extent to which the distribution of scores from one assessment is systematically more or less concentrated towards the central scale categories. Values of RP and RC can be interpreted as probabilities and are expressed in terms of percentage units. The random variance between 2 assessments (RV), expresses the level of dispersion in the observed distribution of pairs from the rank-transformable pattern (23).
RP and RC values may range from –1 to 1, where 0 means that there is no difference between assessments. RP and RC > –0.1 or < 0.1 were considered negligibly small with reference to the clinical relevance, while values ≤ –0.1 or ≥ 0.1 were considered clinically relevant. RV values may range from 0 to 1, and RV < 0.1 generally means that the difference is negligible. Statistically significant RP, RC and RV values are indicated by a 95% confidence interval (95% CI) that does not cover the zero value (23).
A free Excel software program was used to calculate the measures of agreement and disagreement and the 95% CI (24).
RESULTS
The median ARAT total score was 37 (3–54) and 38 (3–56) points for rater A and B respectively, on the first test occasion. Percentage agreement (PA), systematic disagreement in position (RP) and concentration (RC) and individual variability (RV), within each rater and between the raters are shown in Tables II and III.
Within-rater reliability
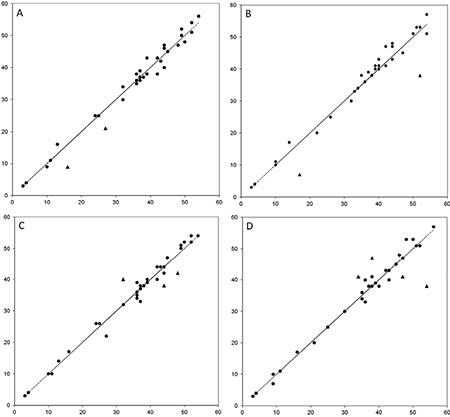
For the ARAT total score, complete agreement was demonstrated in 33 of the 35 repeated assessments for each of the raters (Table II). Scores from the paired assessments are shown in Fig. 2 and disagreements of more than 5 categories are marked. At the subtest level, a satisfactory level of agreement was found within each rater for all 4 subtests, ranging from 91% to 94% for the subtests “grasp” and “pinch”, and from 83% to 100% for the subtests “grip” and “gross movement”. The systematic disagreements noted for the total and subtest scores were all negligibly small and non-significant. A statistically significant, but negligibly small, individual variability (RV) was found for the subtest “grasp” (0.03) and for the total score (0.01) (Table II).
At the item level, a satisfactory level of agreement was found within each of the raters for all 19 items (Table II). The PA for item 13 (Ball 6 mm 2nd finger and thumb), demonstrated an almost total agreement within each of the raters (PA ≥ 97%). The lowest PA (74%) was noted for item 8 (Tube 2.25 cm) (Table II). A statistically significant systematic disagreement was found within each of the raters in item 11 (Ball 6 mm 3rd finger and thumb) (Table II). For rater A, the RP was 0.12, just above the cut-off level. The disagreements were caused mainly by shifts between categories 0 and 1 or 0 and 2 between the repeated assessments. The same shifts were noted by both raters and in the same participants. An asymmetrical 95% CI around the zero value indicated a tendency towards a non-negligible systematic disagreement, in items 10, 14 and 19 within one of the raters (Table II). For item 10 (Put washer over a bolt), the RC (0.11) originated mainly from a systematic shift between categories 3 and 2 between assessments. The same shifts were noted by both examiners for the same participants. For item 14 (Ball 6 mm 1st finger and thumb), the shift occurred between categories 2 and 3, resulting in a RC of 0.11. In item 19 (Hand to mouth), a systematic shift, primarily from category 3 to 2, was registered. The RVs at item level were all negligibly small and non-significant, showing no random variance within raters (Table II).
|
Table II. Percentage agreement (PA), systematic disagreement (RP and RC) and individual variability (RV) between test occasion 1 and 2 within each examiner, displayed separately for examiner A and B (n = 35) |
|||||||||
|
Examiner A |
Examiner B |
||||||||
|
PA % |
RP 95% CI |
RC 95% CI |
RV 95% CI |
PA % |
RP 95% CI |
RC 95% CI |
RV 95% CI |
||
|
Grasp |
|||||||||
|
1. Block 10 cm |
86 |
0.02 –0.070; 0.112 |
–0.03 –0.154; 0.100 |
< 0.01 0; 0.013 |
86 |
–0.02 –0.112; 0.070 |
0.03 –0.088; 0.140 |
< 0.01 0; 0.013 |
|
|
2. Block 2.5 cm |
97 |
–0.03 –0.075; 0.024 |
0.02 –0.016; 0.046 |
0d |
91 |
0.03 –0.060; 0.112 |
–0.02 –0.0769; 0.039 |
< 0.01 0; 0.003 |
|
|
3. Block 5 cm |
94 |
–0.03 –0.078; 0.021 |
< 0.01 –0.029; 0.029 |
0d |
91 |
0.03 –0.060; 0.113 |
–0.01 –0.054; 0.030 |
< 0.01 0; 0.003 |
|
|
4. Block 7.5 cm |
91 |
–0.02 –0.093; 0.056 |
–0.01 –0.067; 0.055 |
< 0.01 0; 0.001 |
83 |
–0.04 –0.154; 0.065 |
–0.01 –0.111; 0.089 |
< 0.01 0; 0.013 |
|
|
5. Cricket ball |
80 |
–0.06 –0.183; 0.055 |
–0.09 –0.203; 0.028 |
< 0.01 0; 0.009 |
86 |
–0.06 –0.158; 0.04 |
–0.09 –0.201; 0.019 |
< 0.01 0; 0.003 |
|
|
6. Sharpening stone |
89 |
0.05 –0.043; 0.135 |
0.01 –0.076; 0.101 |
< 0.01 0; 0.003 |
80 |
0.02 –0.094; 0.143 |
–0.02 –0.139; 0.104 |
0.01 0; 0.015 |
|
|
Subtest score |
57 |
< 0.01 –0.035; 0.040 |
0d |
0.01c 0.001; 0.019 |
57 |
–0.01 –0.045; 0.030 |
0d |
0.03dc 0.019; 0.03 |
|
|
Subtest score ±2 |
94 |
91 |
|||||||
|
Grip |
|
|
|
|
|
|
|
|
|
|
7. Pour water from glass to glass |
94 |
< 0.01 –0.055; 0.055 |
< 0.01 0.089; 0.089 |
< 0.01 0; 0.001 |
91 |
0.05 –0.006; 0.102 |
–0.04 –0.150; 0.080 |
0d |
|
|
8. Tube 2.25 cm |
83 |
–0.05 –0.166; 0.060 |
0.02 –0.086; 0.126 |
< 0.01 0; 0.008 |
74 |
–0.05 –0.180; 0.082 |
0.04 –0.087; 0.168 |
0.01 0; 0.022 |
|
|
9. Tube 1 cm |
80 |
0.07 –0.052; –0.191 |
–0.08 –0.202; 0.039 |
< 0.01 0; 0.011 |
86 |
0.02 –0.083; 0.124 |
–0.04 –0.133; 0.053 |
< 0.01 0; 0.005 |
|
|
10. Put washer over a bolt |
86 |
–0.04 –0.124; 0.049 |
0.08 –0.042; 0.203 |
< 0.01 0; 0.006 |
83 |
–0.06 –0.157; 0.037 |
0.11b –0.028; 0.244 |
< 0.01 0; 0.009 |
|
|
Subtest score |
57 |
< 0.01 –0.046; 0.050 |
0d |
0.01 0; 0.025 |
57 |
–0.01 –0.076; 0.062 |
0d |
0.03 0; 0.076 |
|
|
Subtest score ±1 |
83 |
|
89 |
||||||
|
Pinch |
|||||||||
|
11. Ball 6 mm 3rd finger and thumb |
83 |
0.12a 0.029; 0.201 |
–0.06 –0.199; 0.086 |
0d |
89 |
0.08b 0.001; 0.161 |
0.04 –0.059; 0.132 |
0d |
|
|
12. Marble 1st finger and thumb |
80 |
0.04 –0.060; 0.142 |
0.04 –0.058; 0.144 |
< 0.01 0; 0.007 |
77 |
0.07 –0.046; 0.178 |
0.01 –0.126; 0.137 |
0.01 0; 0.015 |
|
|
13. Ball 6 mm 2nd finger and thumb |
100 |
0 |
0 |
0 |
97 |
–0.02 –0.060; 0.019 |
0.03 –0.028; 0.090 |
0d |
|
|
14. Ball 6 mm 1st finger and thumb |
94 |
< 0.01 –0.048; 0.048 |
< 0.01 –0.036; 0.036 |
< 0.01 0; 0.001 |
83 |
0.08 –0.013; 0.170 |
–0.11b –0.259; 0.033 |
< 0.01 0; 0.010 |
|
|
15. Marble 3rd finger and thumb |
86 |
–0.02 –0.112; 0.068 |
–0.02 –0.137; 0.090 |
< 0.01 0; 0.01 |
91 |
–0.07 –0.140; 0.004 |
0.03 –0.055; –0.116 |
0d |
|
|
16. Marble 2nd finger and thumb |
86 |
–0.02 –0.116; 0.074 |
–0.03 –0.130; 0.077 |
< 0.01 0; 0.01 |
86 |
–0.02 –0.116; 0.074 |
–0.03 –0.129; 0.077 |
< 0.01 0; 0.008 |
|
|
Subtest score |
66 |
> –0.01 –0.083; 0.081 |
> –0.01 > –0.001; < 0.001 |
0.01 0; 0.028 |
54 |
< 0.01 –0.079; 0.086 |
0 –0.001; 0.001 |
0.01 0; 0.027 |
|
|
Subtest score ± 2 |
91 |
91 |
|||||||
|
Gross movements |
|||||||||
|
17. Hand behind head |
94 |
> –0.01 –0.064; 0.059 |
–0.05 –0.112; 0.017 |
0d |
91 |
–0.02 –0.089; 0.052 |
0.08 –0.007; 0.169 |
0d |
|
|
18. Hand on top of head |
91 |
–0.02 –0.092; 0.048 |
–0.02 –0.111; 0.063 |
< 0.01 0; 0.001 |
88 |
–0.02 –0.11; 0.07 |
0.08 –0.04; 0.20 |
< 0.01 0.00; 0.01 |
|
|
19. Hand to mouth |
80 |
–0.10b –0.199; 0.005 |
> –0.01 –0.143; 0.137 |
< 0.01 0; 0.01 |
89 |
0.01 –0.08; 0.10 |
–0.05 –0.13; 0.03 |
< 0.01 0.00; 0.003 |
|
|
Subtest score |
71 |
–0.05 –0.099; 0.003 |
0d |
< 0.01 0; 0.005 |
71 |
–0.02 –0.098; 0.054 |
0d |
0.02 0; 0.047 |
|
|
Subtest score ± 1 |
100 |
|
97 |
||||||
|
Total score |
20 |
–0.01 –0.044; 0.031 |
0d |
0.01c 0.002; 0.020 |
29 |
0.01 –0.050; 0.076 |
0d |
0.04 0; 0.100 |
|
|
Total score ± 5 |
94 |
|
94 |
||||||
|
RP/RC ≤ –0.1 or ≥ 0.1 are in bold. aStatistically significant non-negligible disagreement; RP ≤ –0.1 or ≥ 0.1 and 95% CI that do not cover zero. bTendency towards a non-negligible disagreement; RP/RC ≤ –0.1 or ≥ 0.1 with an asymmetric 95 % CI around zero. cStatistically significant negligible disagreement; RP/RV > –0.1 or <0.1 and 95% CI that do not cover zero. dCI could not be calculated by the asymptotic method implemented in the software program used (24). CI: confidence interval; PA: percentage agreement; RP: relative position; RC: relative concentration; RV: relative rank variance. |
|||||||||
Between-rater reliability
For the ARAT total score, complete agreement was found in 32 and 31 of the 35 paired assessments at the first and second test occasions, respectively (Table III). These paired assessments are shown in Fig. 2 and disagreements of more than 5 categories are marked. At subtest level, a satisfactory level of agreement was found between the raters at both test occasions, ranging from 81% to 91% for the subtests “grasp” and “pinch”, and from 86% to 100% for “grip” and “gross movement”. For the total and subtest scores, the RP and RC values were all non-significant and negligibly small, showing no systematic disagreements between the raters. A statistically significant, but negligibly small, RV (0.02) was found for the subtest “pinch” (Table III).
At the item level, a satisfactory level of agreement between the raters was noted for all items at both test occasions, except for item 19 (PA 69%) (Table III). Almost total agreement (PA ≥ 94%) was demonstrated between the raters at both test occasions for items 8, 9, 10 and 13 (Table III). A non-negligible statistically significant systematic disagreement was identified for items 1, 4, 17 and 19 (Table III). The RP (0.11) and RC (–0.14) reported for item 1 (Block 10 cm) originated from a different use of categories 2 and 3 between raters. This was also the major cause of the systematic disagreements found for items 4 (Block 7.5 cm), 17 (Hand behind head) and 19 (Hand to mouth). The RVs at item level were all negligibly small and non-significant, showing no random variance between the raters (Table III).
|
Table III. Percentage agreement (PA), systematic disagreement (RP and RC) and individual variability (RV) between examiner A and B, displayed separately for test occasion 1 and 2 (n = 35) |
|||||||||
|
Test occasion 1 |
Test occasion 2 |
||||||||
|
PA % |
RP 95% CI |
RC 95% CI |
RV 95% CI |
PA % |
RP 95% CI |
RC 95% CI |
RV 95% CI |
||
|
Grasp |
|||||||||
|
1. Block 10 cm |
86 |
0.11a 0.051; 0.198 |
–0.14a –0.266; –0.023 |
0d |
86 |
0.06 –0.027; 0.155 |
–0.08 –0.206; 0.040 |
< 0.01 0; 0.010 |
|
|
2. Block 2.5 cm |
79 |
–0.03 –0.158; 0.106 |
0.02 –0.067; 0.098 |
0.01 0; 0.036 |
74 |
0.03 –0.124; 0.176 |
–0.02 –0.109; 0.078 |
0.03 0; 0.071 |
|
|
3. Block 5 cm |
86 |
0.03 –0.086; 0.138 |
–0.01 –0.067; 0.043 |
< 0.01 0; 0.013 |
71 |
0.08 –0.068; 0.230 |
–0.03 –0.108; 0.057 |
0.02 0; 0.060 |
|
|
4. Block 7.5 cm |
89 |
0.10a 0.006; 0.190 |
–0.08 –0.163; 0.007 |
0d |
83 |
0.07 –0.037; 0.169 |
–0.09 –0.199; 0.028 |
< 0.01 0; 0.009 |
|
|
5. Cricket ball |
86 |
0.03 –0.086; 0.138 |
–0.01 –0.069; 0.045 |
< 0.01 0; 0.013 |
86 |
0.02 –0.078; 0.125 |
–0.02 –0.109; 0.069 |
< 0.01 0; 0.013 |
|
|
6. Sharpening stone |
86 |
0.07 –0.029; 0.170 |
–0.01 –0.105; 0.093 |
< 0.01 0.00; 0.01 |
89 |
0.05 –0.045; 0.143 |
–0.04 –0.109; 0.039 |
< 0.01 0; 0.006 |
|
|
Subtest score |
54 |
0.08 –0.015; 0.165 |
0d |
0.03 0; 0.062 |
57 |
0.06 –0.049; 0.178 |
0d |
0.05 0; 0.116 |
|
|
Subtest score ±2 |
81 |
83 |
|||||||
|
Grip |
|||||||||
|
7. Pour water from glass to glass |
89 |
–0.07c –0.135; –0.004 |
0.06 –0.062; 0.189 |
0d |
97 |
–0.02 –0.056; 0.018 |
0.02 –0.021; 0.058 |
0d |
|
|
8. Tube 2.25 cm |
97 |
> –0.01 –0.013; 0.004 |
–0.02 –0.055; 0.018 |
0d |
94 |
< 0.01 –0.067; 0.067 |
< 0.01 –0.0583; 0.0583 |
< 0.01 0; 0.001 |
|
|
9. Tube 1 cm |
94 |
0 –0.067; 0.067 |
< 0.01 –0.058; 0.058 |
> 0.01 0; 0.001 |
94 |
–0.05 –0.115; 0.017 |
0.04 –0.018; 0.096 |
0d |
|
|
10. Put washer over a bolt |
97 |
0.02 –0.020; 0.064 |
–0.03 –0.074; 0.024 |
0d |
94 |
0 –0.060; 0.060 |
0 –0.076; 0.076 |
< 0.01 0; 0.001 |
|
|
Subtest score |
77 |
–0.02 –0.066; 0.22 |
< 0.01 –0.001; <0.001 |
< 0.01 0; 0.002 |
86 |
–0.02 –0.076; 0.038 |
0d |
< 0.01 0; 0.015 |
|
|
Subtest score ± 1 |
100 |
97 |
|||||||
|
Pinch |
|||||||||
|
11. Ball 6 mm 3rd finger and thumb |
91 |
0.02 0.034; 0.067 |
–0.04 –0.160; 0.073 |
0d |
91 |
–0.02 –0.074; 0.039 |
0.03 –0.080; 0.146 |
< 0.0 0; 0.003 |
|
|
12. Marble 1st finger and thumb |
89 |
–0.09c –0.172; –0.008 |
0.05 –0.057; 0.153 |
< 0.01 0; 0.006 |
91 |
–0.07 –0.145; 0.004 |
0.01 –0.073; 0.099 |
< 0.01 0; 0.003 |
|
|
13. Ball 6 mm 2nd finger and thumb |
100 |
0 |
0 |
0 |
97 |
–0.02 –0.060; 0.019 |
0.03 –0.028; 0.090 |
0d |
|
|
14. Ball 6 mm 1st finger and thumb |
91 |
–0.06 –0.123; 0.005 |
0.08 –0.091; 0.174 |
0d |
91 |
0.02 –0.047; 0.088 |
–0.03 –0.130; 0.071 |
< 0.01 0; 0.003 |
|
|
15. Marble 3rd finger and thumb |
80 |
0.02 –0.088; 0.132 |
0.02 –0.105; 0.153 |
0.01 0; 0.022 |
86 |
–0.02 –0.112; 0.074 |
0.08 –0.040; 0.193 |
< 0.01 0; 0.006 |
|
|
16. Marble 2nd finger and thumb |
89 |
< 0.01 –0.088; 0.088 |
< 0.01 –0.088; 0.088 |
< 0.01 0; 0.007 |
83 |
< 0.01 –0.103; 0.103 |
> –0.01 –0.116; 0.116 |
0.01 0; 0.022 |
|
|
Subtest score |
54 |
< 0.01 –0.079; 0.086 |
< 0.01 –0.001; 0.001 |
0.01 0; 0.027 |
74 |
–0.01 –0.072; 0.042 |
< 0.01 > –0.001; <0.001 |
0.02c 0.013; 0.034 |
|
|
Subtest score ± 2 |
91 |
89 |
|||||||
|
Gross movements |
|
|
|
|
|
|
|
|
|
|
17. Hand behind head |
77 |
0.04 –0.082–0.156 |
–0.16a –0.308; –0.012 |
> 0.01 0; 0.014 |
91 |
0.02 –0.047; 0.088 |
–0.03 –0.123; 0.067 |
< 0.01 0; 0.003 |
|
|
18. Hand on top of head |
77 |
–0.04 –0.157–0.068 |
–0.05 –0.196; 0.99 |
0.01 0; 0.022 |
89 |
–0.04 –0.119; 0.037 |
0.06 –0.056; 0.170 |
< 0.01 0; 0.006 |
|
|
19. Hand to mouth |
71 |
–0.12b –0.257; 0.026 |
0.19a 0.031; 0.343 |
0.01 0; 0.025 |
69 |
< 0.01 –0.138; 0.143 |
0.14b –0.011; 0.285 |
0.02 0; 0.046 |
|
|
Subtest score |
60 |
–0.04 –0.141; 0.054 |
0d |
0.05 0; 0.108 |
57 |
–0.01 –0.106; 0.077 |
0d |
0.02 0; 0.048 |
|
|
Subtest score ± 1 |
86 |
|
91 |
||||||
|
Total score |
31 |
0.01 –0.052; 0.070 |
0d |
0.04 0; 0.08 |
34 |
0.03 –0.033; 0.089 |
0d |
0.08 0; 0.181 |
|
|
Total score ± 5 |
91 |
|
89 |
||||||
|
RP/RC ≤ –0.1 or ≥ 0.1 are in bold. aStatistically significant non-negligible disagreement; RP/RC ≤ –0.1 or ≥ 0.1 and 95% CI that do not cover zero. bTendency towards a non-negligible disagreement; RP/RC ≤ –0.1 or ≥ 0.1 with an asymmetric 95 % CI around zero. cStatistically significant negligible disagreement; RP/RV > –0.1 or < 0.1 and 95% CI that do not cover zero. dCI could not be calculated by the asymptotic method implemented in the software program used (24). CI: confidence interval; PA: percentage agreement; RP: relative position; RC: relative concentration; RV: relative rank variance. |
|||||||||
DISCUSSION
Findings from this study indicate that the ARAT is a reliable observational rating scale for assessing function and activity of the arm and hand in persons with stroke. Some items, demonstrating minor systematic disagreements may, however, require special attention. As expected, the reliability within the same rater was slightly better than between raters.
The high reliability demonstrated on item as well as subtest and total score levels supports the findings from earlier studies of the ARAT (7–10, 12). Some minor systematic disagreements occurred in items 10, 11, 14 and 19 within raters, and in items 1, 4, 17 and 19, between raters. Item 19 (Hand to mouth) demonstrated disagreements more frequently than the other items. The same item has been reported as problematic by van der Lee et al. (12) due to difficulties in distinguishing between category 2 and 3. Even though the ARAT manual has been revised and the time limits extended for this item (7), the systematic disagreements that were found in the present study indicate that this may still be a problematic item.
Most of the systematic disagreements found in this study originated from differences between categories 2 and 3, which were more frequently observed between than within the raters. The scale step between 2 and 3 extends from “great difficulty” to “normal”. Accordingly, a possible explanation to the noted disagreements could be related to the raters’ different perceptions of a “normally” performed task in persons with minor motor impairments. To distinguish between 2 and 3 might be increasingly difficult when assessing shoulder and elbow movements, since the ARAT manual is less specific with regard to shoulder and elbow movements than to finger movements. Another explanation for these disagreements might be differences in how rigorously the rater regards the 5-s time limit, since this discrepancy can cause different scores. Clarifications regarding time limits in the scoring manual, for instance 3 points: ≤ 5.0 s and 2 points: 5.1 to 60 s, may therefore further improve the reliability of the ARAT.
In the present study, the assessment within and between raters did not differ more than 1 category for any given item with the exception of item 11. Similar results were demonstrated by van der Lee et al. (12). Regarding item 11 (Ball 6 mm 3rd finger and thumb), systematic disagreements found within raters may be mainly due to a change in the participants’ performance rather than variation in the raters’ assessments. The same shift towards higher categories within each rater’s assessments might be explained by the fact that fine finger movements included in this task are rarely used in daily life. Thus, practicing these movements during the first test occasion may have caused an improvement in the participants’ performance on test occasion 2. The same shifts towards lower categories in each rater’s assessments were noted for some participants in item 10 (Put washer over a bolt). This observed deterioration might have been caused by fatigue or a change in muscle tone, since this item was the final hand and finger function task tested.
By assessing performance at the same time, discrepancies in the scores due to variation in patients’ performance were prevented. But, due to this, the reliability between examiners may have been positively affected compared with a clinical test situation. Furthermore, both test occasions were carried out on the same day, which decreases variation in patients’ performance. On the other hand, fatigue, or a learning effect may have affected performance on the second test occasion. The participants in this study performed all 19 items of the ARAT and the order between the subtest “grip” and “pinch” was altered in order to mimic a more practical procedure commonly used in clinical settings. Testing all items might have led to fatigue or change in muscle tone at test occasion 2. The reliability was examined only between 2 raters, but in clinical settings it is not uncommon that several different raters will perform the ARAT test. This design was, however, chosen for practical reasons and with the intention to control for some sources of variability, but might have affected the reliability of ARAT positively compared with a clinical situation.
PA was used in this study to provide information about the total agreement in assessments within and between raters. Since the number of categories influence the level of PA, a satisfactory PA is more difficult to obtain with an increase in the number of categories. Consequently, the PA reported for the subtest and total score in this study was lower than for the individual items. The advantage of PA is that it is expressed in percentage units, which is intuitively easy to interpret.
The advantage of using the rank invariant method is that it gives insight into the type and size of a noted disagreement, thus it provides a more detailed understanding of the origin of the disagreement and the possibility to evaluate whether these disagreements are large enough to affect reliability. We found that all the disagreements in the current study were minor and systematic. In contrast to random variations in assessments, systematic disagreements can be explained by investigating patterns in the data as, for example, different use of scale categories between raters. This statistical method may still be regarded as novel and therefore not widely used, which makes comparisons with other studies difficult. Another disadvantage with the method is its sensitivity to small sample sizes. As a result, several items demonstrate negligibly small estimates of systematic disagreements, but wide CIs covering values considered as non-negligible. Thus, caution should be exercised when interpreting the results.
We have analysed ARAT strictly as an ordinal scale. Since weighted kappa treat the distances between scale scores as equal when assigning weights, it ignores the ordinal properties of a scale (25). Thus, we considered the method used in the present study to be more appropriate for analysing ordinal scales, even though the weighted kappa is frequently used in reliability studies.
To our knowledge, no method exists to determine the sample size needed when using the method described by Svensson (23). As suggested by Lehmann & D’Abrera (26), we therefore calculated the sample size (22 participants) based on parametric statistics, adding 15% (3 participants) since using a non-parametric test. We added another 13 participants due to the method’s sensitivity to small sample sizes. Still, our results indicated that a larger sample size might have led to more conclusive findings. This information is important when planning future studies with the ARAT.
The study was conducted on persons in the chronic stage after stroke with impaired upper extremity function. The participants who were included were of both sexes, had a wide age range, and scored across almost the whole ARAT scale, thus showing a variety of upper extremity function. Therefore, it may be reasonable to assume that the results should be applicable for persons with stroke with comparable upper extremity impairment level. One limitation with this study was the skewed distribution on the ARAT scale. Many of the 19 items are too difficult for patients with severe stroke and we therefore found it unethical to expose more persons with severe hemiparesis than necessary to the test. Thus, our results should be interpreted with caution when it comes to patients with lower ARAT scores. ARAT is, however, mainly used in patients with mild to moderate stroke, and this distribution might therefore be a minor problem for the clinicians.
In conclusion, the findings of this study indicate that the ARAT is a highly reliable observational rating scale at the item level for persons with impaired upper extremity function after stroke. The minor disagreements found within and between raters in some items were all systematic and originated from changes in the participant’s performance or different use of scale categories between the raters. Thus, when using ARAT in clinical and research settings it is important to be aware of these small disagreements demonstrated in some items.
AcknowledgementS
Financial support was received from the Norrbacka-Eugenia Foundation, the Foundation of the Swedish National Stroke Association, Rune and Ulla Almlöv’s Foundation, Greta and Einar Asker’s Foundation and Reneé Eander’s Foundation.
The authors would like to thank the participants, colleagues at Högsbo Rehabilitation Hospital, the expert group: Katharina S. Sunnerhagen, Elisabeth Brodin, Lotten Liden, Ulla-Britt Bergström and, for statistical advice, Anna Ekman.
References

