Gunilla Stenberg, PhD1, Anders Lundquist, PhD2, Anncristine Fjellman-Wiklund, PhD1 and Christina Ahlgren, PhD1
From the 1Department of Community Medicine and Rehabilitation, Physiotherapy, 2Department of Statistics, Umeå School of Business, Umeå University, Umeå, Sweden
OBJECTIVE: To examine similarities and differences in problem areas reported by women and men who seek physiotherapy for back or neck pain.
METHODS: Principal component analysis (PCA) was used to analyse questionnaire data including demographics, pain, domestic work, stress, health status, physical disability, psychosocial and physical workload, kinesiophobia and self- efficacy. Most of the questions were recruited from a number of scales, e.g. EuroQol (EQ-5D), Neck Disability Index (NDI), Oswestry Disability Questionnaire (ODQ), Tampa Scale for Kinesiophobia, and Functional-Efficacy-Scale.
RESULTS: A total of 118 patients (84 women, 34 men) completed the questionnaire. Men and women scored similarly on physical disability, functional self-efficacy and kinesiophobia, but women scored higher on stress reactions and pain intensity. PCA showed that questions about physical disability and functional self-efficacy comprised the first component and explained most of the variance in this patient group. Questions about stress and social support at work constituted the second component. Questions about domestic workload and pain comprised the third component. Gender differences were found in the second and third components.
CONCLUSION: In general, women and men answered questions similarly, but there were differences: more women reported stress, pain and low support at work and more men reported a lower domestic workload.
Key words: gender; back pain; neck pain; primary healthcare; multivariate analysis; physiotherapy.
J Rehabil Med 2014; 46: 668–675
Correspondence address: Gunilla Stenberg, Department of Community Medicine and Rehabilitation, Physiotherapy, Umeå University, SE-90187 Umeå, Sweden. E-mail: gunilla.stenberg@physiother.umu.se
Accepted Feb 28, 2014; Epub ahead of print Jun 4, 2014
INTRODUCTION
Knowledge about differences between women and men in prevalence, care-seeking and recovery for back and neck pain is increasing. Higher prevalences for both low back pain and neck pain are found among women compared with men (1, 2). Women more often seek primary healthcare for low back (3) and neck pain (4) than do men. Women also consult physiotherapists more frequently than men, but men consult other caregivers at the same frequency as women (3). The most important factors for care-seeking in both women and men are pain intensity and high disability (3, 5). Kinesiophobia is another important factor. Almost half of patients who seek primary healthcare for musculoskeletal pain give positive answers to questions about kinesiophobia (6). The influence of work-related factors on care-seeking is conflicting. Individuals on an insurance register who had low education, low income and part-time jobs sought care for neck and low back pain more frequently than the rest of the group (5). In another study, different work-exposure factors influenced care-seeking for neck and shoulder disorders in women compared with men (7). Men who work with vibrating tools, who do not have a fixed salary, and who have low demands in relation to competence, exhibit increased care-seeking; for women, important factors were repetitive hand or finger movements, constrained sitting, no fixed salary, and solitary work (7). Such findings may represent a gendered labour market as well as real gender differences, and further study is required. In contrast to factors that influence care-seeking, Carroll et al. (8) found that ergonomic factors have no prognostic value for recovery from neck pain. Women have a less favourable course of recovery from back and neck pain compared with men (9). Factors associated with an unfavourable prognosis for low back pain are pain intensity, pain history, disability (Oswestry Disability Questionnaire, ODQ), poor general health, and dissatisfaction with the work-place (9, 10), depression and fear avoidance (10). Fewer variables are linked to recovery from neck pain. A low level of influence over the work situation predicts persistent neck pain (11). Self-efficacy is more important for reduced disability than are pain intensity and duration (12).
Variables that predict care-seeking and/or recovery from low back and neck pain are present at body, personal, and sociocultural levels. Studies of differences between women and men in pain mostly deal with biological mechanisms, such as gonadal hormones, endogenous pain modulatory systems and, to a lesser extent, the role of psychological and sociocultural factors (13). In most studies, analyses are not stratified by biological sex. In those that stratify, women have greater pain intensity, more disability and worse recovery rates.
In gender research, the focus is on social relations rather than the differences between men and women (14). There is a need to broaden our perspective to include social and cultural factors that impact on pain-reporting by women and men, as well as their consequences. For example, pain-reporting could be influenced by how social practices are shaped in social relations between men and women, among women, and among men. In rehabilitation with a bio-psycho-social perspective it is a matter of course that both biological and social factors should be included. However, there has been less research into how the distribution of those factors by gender affects the results. It is also important to focus not only on the differences between women and men, as similarities might then be disregarded. The aim of this study was to determine the similarities and differences in complaints and problem areas reported by women and men seeking physiotherapy treatment for back or neck pain in primary healthcare.
METHODS
Procedures and questions
This was an exploratory study, based on a clinical development project that aimed to elaborate an appropriate questionnaire for patients with back and neck pain. A working team of 11 experienced physiotherapists and 1 chiropractor prepared a comprehensive questionnaire with questions considered relevant for patients with back and neck pain. Most questions were chosen from frequently used questionnaires previously shown to be valid and reliable.
Questions covered the intensity, history and distribution of pain, physical disability (Neck Disability Index (NDI), ODQ) (15, 16), perceived health (EuroQol, EQ-5D) (17), kinesiophobia (Tampa Scale for Kinesiophobia) (18), stress reactions, (Shirom-Melamed questionnaire, tension dimension) (19), functional self-efficacy (20) and social factors related to employment (questions on physical work exposure 4 questions, Demand-Support-Control Questionnaire (DSCQ), General Nordic Questionnaire for Psychological and Social Factors at Work (QPS-Nordic, 8 questions) (21–23), and questions about the domestic work tasks normally carried out. An overview of the questionnaires and questions included in the analysis is shown in Table I.
Disorder-specific questions in the ODQ (problems with walking, standing and sitting) and NDI (problems with reading and headache) were distributed to patients with specific disorders. Questions on problems with concentration, work activities, car driving, leisure activities, sexual function, social life and travelling were distributed to all patients. The final, comprehensive, questionnaire included 130 questions. The questionnaire was distributed online or in paper form according to patient preference.
Subjects
The study was performed in 15 primary healthcare physiotherapy clinics in Västerbotten County in northern Sweden during 2 time-periods: between March 2009 and December 2010 (83 patients) and between May 2011 and December 2011 (35 patients).
Information and invitations were given to 173 patients seeking a physiotherapist appointment for neck or back pain. If patients agreed to participate, they were asked for written informed consent. Inclusion criteria were: back and/or neck pain; age between 18 and 65 years; and absence of cancer, rheumatoid arthritis, or other systemic diseases. Patients with a first episode of pain, concurrent pain or chronic pain were invited to participate when they were seeking primary healthcare. Irrespective of the pain duration the appointment was the first in an ordinary treatment period.
No doctoral or general practitioner (GP) referral for physiotherapy treatment was required during the time of data collection. Patients were assured that declining participation would not affect their physiotherapy treatment.
Non-participants. Fifty-five patients (32%) declined to participate. Those who declined were significantly younger than those who participated (p = 0.001), mean age 39 years (standard deviation (SD) 12) vs 46 years (SD 13) . There were no differences in pain location or gender between participating and non-participating patients.
This study was approved by the ethics committee of the Medical Faculty of Umeå University (Dnr 08-117M).
Data analysis
The Statistical Package for Social Sciences 18.0 (SPSS Inc., Chicago, IL, USA) and SIMCA-P 12.0 (Umetrics Inc., version 12.0.1, Umeå, Sweden) were used for statistical analyses.
Women and men were compared using χ2, Fisher’s exact, or Mann-Whitney U tests. A 95% significance level was used. An exploratory factor analysis (EFA) using principal component analysis (PCA) (24) was carried out in SIMCA. Each question was considered as a single variable for entry in the PCA. The estimation algorithm assigns zero weight to the missing observation. This corresponds to a missing completely at random (MCAR) assumption. The general goal of PCA for EFA is to reduce the dimension of the problem by turning a large number of observed variables into relatively few components using the pattern of correlations between the observed variables. Ideally, it is possible to identify groups of observed variables with high correlations between variables and to separate them from other groups of variables. For example, the correlation matrix has an approximate “block” structure with high within-block correlations and low between-block correlations. Each observed variable is assigned a loading or component weight to each of the extracted components. In the ideal case of a “block” correlation matrix, one component loading is high and all others are low. This indicates the component correlated with the variable. Factor rotation is not performed. Table I sets out the questionnaires used in the analysis.
|
Table I. List of questionnaires and questions used in the study (references) |
|
Demand-Control-Support Questionnairea (22) |
|
EuroQol rating scale, (EQ RS) (17) |
|
EuroQol 5 dimensionsa, (EQ-5D) (17) |
|
Functional Self-Efficacy Scalea (20) |
|
General Nordic Questionnaire for Psychological and Social Factors at Work (QPS- Nordic) (questions 38, 39, 40, 83, 103, 104, 105 and 106) (23) |
|
Neck Disability Indexa (NDI) (16) |
|
Oswestry Disability Questionnairea (ODQ) (15) |
|
Questions about current pain, worst pain experienced during the last 7 days, mean pain during the same period, and muscle symptoms. The ratings are on an 11-point scale, with 0 meaning no pain and 10 meaning pain as severe as possible |
|
Questions about time spent in domestic work: 8 questions about childcare, domestic work, helping relatives/friends, maintenance of residence, maintenance of car, grocery shopping, exercise, other than exercise. (Not available in English) (Appendix I) |
|
Questions on physical work exposure, (questions 2, 3, 9 and 11) (21) |
|
Shirom-Melamed questionnaire, tension dimension, 4 questions (19) |
|
Tampa Scale for Kinesiophobiaa (18) |
|
aWhole questionnaire included in the principal component analysis (PCA) analysis. |
To examine possible gender differences in the factors, factor scores were extracted and compared between groups using an ordinary 2-sample t-test. Variables with loadings ≤ –0.15 and ≥ 0.15 were chosen (the interval is arbitrary, but variables with loadings closer to 0 contribute less to the model), to represent the most important variables in the components, respectively, and to be visualized in Figs 1 and 2 and in Appendix I. A visual analysis of the loading plot determined which questions discriminated between women and men in components 2 and 3. Standard errors of the loadings were estimated using a jack-knife procedure (25), which is a method for obtaining the precision of an estimate, by iteratively excluding parts of the underlying data, making estimates from the subsets, and comparing these estimates. A loading was considered significant if the ratio (absolute loading)/(jack-knife standard error) exceeded 1.96. One question from DCSQ and 2 questions from NDI were excluded from the analyses because of > 50% missing values.
The Q2-value for a component is the fraction of the total variation in all X-variables that can be predicted by that component. Q2 is estimated using cross-validation.
RESULTS
A total of 118 patients (84 women, 34 men) completed the questionnaire around the time of their first physiotherapy appointment. Eighteen patients (15.3%) had a first episode of neck and back pain. Nine patients (7.6%) had had pain for 1–7 days.
Seventy percent of participants were women. The mean age among responders was 46.1 years (standard deviation (SD) 11.7). In women and men, the most urgent site of complaint and the most frequent reason for seeking care was back pain. Thirty-nine (33.1%) individuals had complaints of both neck and back pain. Women had significantly higher educational attainment (p = 0.029) than men. Women reported significantly higher pain intensity than men. Median pain during the last 7 days was 8.0 (interquartile range (IQR) 7.0–9.0) in women and 7 (IQR 5.0–8.0) in men (p = 0.032). More men than women had a medical history of an accident (p = 0.027). Patient descriptions of the characteristics of their pain are shown in Table II. No significant differences between women and men were found in concomitant diseases or family-related questions. Median values on the questionnaire instruments are given in Table III. Women scored higher than men on stress reactions (p = 0.055). Women and men had similar scores on the functional self-efficacy scale, Tampa Scale for Kinesiophobia, ODQ, NDI, EQ-5D rating scale and EQ-5D-index (Table III).
|
Table II. Background patient demographics, descriptions of pain, p-values refer to differences between women and men |
||||
|
Patients |
p-value |
|||
|
Women (n = 84) |
Men (n = 34) |
Total (n = 118) |
||
|
Age, years, mean (SD) |
45.9 (12.1) |
46.7 (10.8) |
46.1 (11.7) |
0.738b |
|
Site of pain complaint, n (%) |
||||
|
Back |
48 (57.1) |
23 (67.6) |
71 (60.2) |
0.291a |
|
Neck |
36 (42.9) |
11 (32.4) |
47 (39.8) |
0.291a |
|
Both back and neck pain |
32 (38.1) |
7 (20.6) |
39 (33.1) |
0.067a |
|
Radiating pain, n (%) |
43 (51.2) |
21 (61.8) |
64 (54.2) |
0.296a |
|
Daily pain, n (%) |
35 (41.7) |
13 (38.2) |
48 (40.7) |
0.731a |
|
Periods of pain once a year or more, n (%) |
64 (76.2) |
25 (73.5) |
89 (75.4) |
0.761a |
|
Pain (11-point numeric rating scale) last 7 days, median (Q1–Q3) |
8.0 (7.0–9.0) |
7 (5.0–8.0) |
7 (6.0–8.25) |
0.032*d |
|
Accident, n (%) |
12 (14.5) |
11 (32.4) |
23 (19.7) |
0.027*a |
|
Reported concomitant disease, n (%) |
40 (49) |
15 (44) |
55 (47) |
0.647a |
|
Married or cohabiting, n (%) |
55 (66.3) |
25 (75.8) |
80 (69.0) |
0.319a |
|
Children at home, n (%) |
33 (39.8) |
13 (39.4) |
46 (39.7) |
0.971a |
|
University education, n (%) |
38 (45.2) |
8 (23.5) |
46 (39.0) |
0.029*a |
|
Not born in Sweden, n (%) |
4 (3.4) |
|||
|
Medication use daily or several times a day, n (%) |
16 (19.3) |
7 (21.2) |
23 (19.8) |
0.814a |
|
Demands from work affect home and family fairly/very often, n (%) |
12 (16.4) |
4 (13.8) |
16 (15.7) |
1.000c |
|
Demands from home and family affect work in a negative way fairly/very often, n (%) |
3 (4.1) |
1 (3.4) |
4 (3.9) |
1.000c |
|
*p < 0.05. aχ2 test, bt-test, cFisher’s exact test, dMann-Whitney U test. |
||||
|
Table III. Data on Functional Self-efficacy Scale, Tampa Scale for Kinesiophobia, Oswestry Disability Questionnaire (ODQ), Neck Disability Index (NDI), EuroQol (EQ-5D) rating scale (RS), and EQ-5D Index, and Shirom-Melamed questionnaire, tension dimension. p-values refer to differences between women and men (n=118) |
||||
|
Women Median (Q1–3) |
Men Median (Q1–3) |
Total Median (Q1–3) |
p-valuea |
|
|
Functional Self-Efficacy Scale, n = 118 |
43.0 (34.0–53.0) |
45.5 (34.0–51.5) |
44.0 (34.0–53.0) |
0.975 |
|
Tampa Scale for Kinesiophobia, n = 117 |
32.0 (27.0–39.0) |
35.0 (30.5–40,.2) |
33.0 (28.5–40.0) |
0.344 |
|
ODQ, n = 68 (45 women, 23 men) |
30.0 (21.0–44.0) |
28.0 (12.0–36.0) |
28.0 (20.0–41.5) |
0.215 |
|
NDI, n = 45, (35 women, 10 men) |
26.0 (16.0–42.0) |
23.0 (17.0–37.0) |
24.0 (16.0–40.0) |
0.859 |
|
EQ-5D RS, n = 117 |
0.60 (0.40–75) |
0.60 (0.50–0.70) |
0.60 (0.40–0.75) |
0.817 |
|
EQ-5D Index, n = 118 |
0.73 (0.20–0.80) |
0.73 (0.72–0.76) |
0.73 (0.28–0.80) |
0.475 |
|
Shirom-Melamed questionnaire, tension dimension, n = 113 |
3.5 (2.5–4.5) |
2.9 (2.2–3.8) |
3.2 (2.4–4.2) |
0.055 |
|
aMann-Whitney U test. |
||||
The PCA identified 5 significant components (P1–P5). The full model explained 37% of the variance (R2cum) and the prediction value was 17% (Q2cum).
The first component (P1) captured the largest variation in the data and explained 17% of the variance. The 2 last components (P4 and P5) were excluded from the reported results because of negative prediction values, and they did not satisfy our stricter threshold for significance (according to cross-validation rules denoted R1 in SIMCA). The remaining 3 components (P1–P3) combined, explained 29% of the variance (R2cum) and the prediction value was 17% (Q2cum).
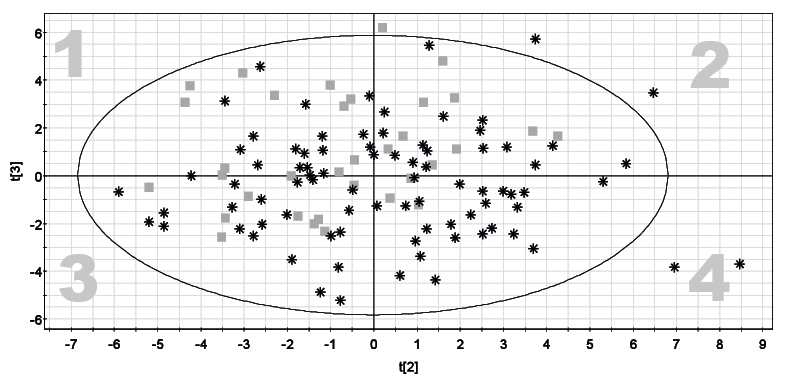
No significant difference in distance to t-scores was found between women and men in P1 (mean t-score difference = 0.75, p = 0.389, 95% confidence interval (CI) −0.97 to 2.6). In P2 (mean t-score difference = −1.13, p = 0.041, 95% CI −2.2 to −0.045) and P3 (mean t-score difference = 1.39, p = 0.003, 95% CI 0.47–2.3), there were significant differences in distance to t-scores between women and men (Fig. 1).
The first component (P1) was primarily explained by questions from the NDI and ODQ, and questions from the Functional Self-efficacy Scale (Appendix I).
The second component (P2) was primarily explained by questions about social support at work from DSCQ, and questions about stress reactions (Appendix I).
The third component (P3) was primarily explained by questions on reported pain and symptoms from muscles, and questions about domestic work and leisure activities (Appendix I). Reported pain was negatively correlated with current domestic work tasks/load, less opportunity to decide for oneself what should be done at work, and “fear of doing things other people do, because of the risk of injury”.
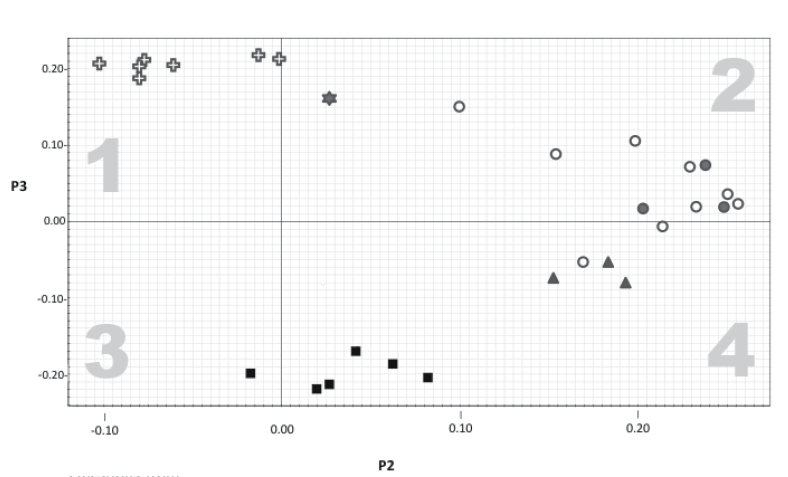
A visual presentation of the distribution of answers to the questions in P2 and P3 (Figs 1 and 2) reveals a large overlap in answers from women and men despite the significant gender differences in the analysis. An aggregation of women was found in the fourth quadrant (Fig. 2), in which questions about pain and musculoskeletal symptoms, stress reactions, and support at work are represented. An aggregation of men was found in the first quadrant, which corresponds to questions about home, family and leisure activities (Fig. 2). The large overlap in Fig. 1 indicates that small proportions of women and men account for the differences.
No significant differences were found between patients in the fourth quadrant and the other quadrants regarding age, profession, children at home, site of pain complaint, both back and neck pain, radiating pain or history of an accident. There was a difference in the proportion of subjects with university education in the fourth quadrant compared with the other quadrants (1–3), but the difference was not significant (p = 0.237) (Table IV).
|
Table IV. Frequency of university education and accident in quadrants 1–3 and quadrant 4. p-values refer to differences between quadrants |
|||
|
Quadrant 1–3 n = 89 |
Quadrant 4 n = 29 |
p-valuea |
|
|
University education n (%) |
32 (36) |
14 (48) |
0.237 |
|
Accident, n (%) |
18 (20) |
5 (18) |
0.783 |
|
aχ2 test. |
|||
DISCUSSION
There are similarities and differences when men and women report complains and problem areas by questionnaire. The questions that provide the most information came from NDI, ODQ, and the functional self-efficacy scale (identified in the first component). Women and men answered these questions in the same way. Similar levels of disability among women and men were also found in another Swedish study (12). Women reported higher disability than men who had long-lasting musculoskeletal pain in a US study (26). These divergent findings could be due to differences in willingness to report disability or pain that are associated with culture or different measurement methods. The lack of gender differences in functional self-efficacy is consistent with other studies of patients with low back pain (12) or chronic musculoskeletal pain (27).
In the second component, work environment factors (e.g. low support at work) were correlated with stress reactions, and women were more represented in those areas in the plots (Figs 1 and 2). Women also reported more stress reactions in the tension dimension of the questionnaire (p = 0.055). A positive relation between low social support at work and stress reactions is also found in other studies (28, 29). Similarly, low social support at work is a predictor for neck (29, 30) and back pain in women, but not in men (29). Women may be more sensitive to stress reactions and lack of social support. Some research shows that stereotyped patterns of femininity, such as caring for others, shape women to seek more social support (31). However, Nielsen et al. (28) showed that this could be due to the segregated labour market and the work environment in female-dominated workplaces, rather than specifically to female gender.
In the third component, high reported pain intensity correlated with less domestic work, less time spent on exercise, less time spent in leisure activities, less opportunity to decide for oneself what should be done at work, and “fear of doing things other people do, because of the risk of injury”. Women and men answered parts of those questions in different ways. Women reported more pain and symptoms from muscles. More men reported less domestic work, less time spent on exercise, less time spent in leisure activities, less opportunity to decide for oneself what should be done at work and “fear of doing things other people do, because of the risk of injury”. Willingness to report pain differs among cultures, and in some cultures differs among women and men (32). In western cultures, it is more acceptable for women to express pain (33). Gender differences could be due to many factors related to self-rated health measures, e.g. different living conditions. Women and men communicate differently through questionnaires. Sullivan et al. (33) studied protective and communicative pain behaviours among patients with musculoskeletal disorders. They found that communicative pain behaviours, such as self-reported disability and pain ratings, are reinforced by available opportunities in the social environment and are more often reported among women (33). The gender difference in domestic work, with men doing less work, was not a surprise. Women are known to do most domestic work in Sweden despite gender equality being strongly emphasized in political agendas. Swedish women spend an average of 28 h per week on domestic work; men spend 20 h (34). Women and men also differ with respect to which domestic work tasks they perform. Women are more engaged in routine tasks, such as food preparation and dish-washing, which need to be done daily, even if one is in pain. This is illustrated in Fig. 2 and in Appendix I, where the associations between pain and domestic work have opposite loadings in P3, and a shift can be seen between women and men on the t3 axis (Fig. 1); women and men report disability in relation to pain in a similar way, but are involved in domestic work to different extents. Questions in the ODQ do not specifically address difficulties in performance of domestic work and may therefore not be an accurate single measure for this relationship.
Report of less domestic work, less exercise, and fewer leisure activities in component P3 could indicate fear of physical activity. However, only one question from the Tampa Scale for Kinesiophobia correlated with other analysis questions in the component. This could be due to the small number of patients with kinesiophobia (mean 34). No gender differences in kinesiophobia were seen. These findings are consistent with previous results in primary healthcare (6, 35).
In the components (P2, P3) that showed significant gender differences, no sharply demarcated groups were found between women and men in responses to questions. However, there was a quite small number of males in quadrant 4, indicating some difference between men and women. On the other hand, there is great variation within the groups of women and men, and the differences could be due to interactions between sex and other factors. Gender research emphasizes that difference in age, social class and ethnicity need to be taken into account when studying gender (36). PCA could be a useful method in gender research, as it could assist with study of similarities and differences in groups of patients, as well as groups of women or men. The sample in this study was too small to allow further stratifications during the analysis and we may have missed asking questions that could reveal why women aggregated in quadrant 4 in Fig. 1. In Scherer & Dicowden’s (37) elaboration on the International Classification of Functioning, Disability and Health (ICF) model, they show that when gender is defined as a contextual factor, dependent on culture and social environment, different contexts could influence disability differently in women and men. They point out the importance of promoting these factors in order to strengthen women’s needs and illuminate them for different cultures.
Gender in the ICF is poorly defined and is referred to the Personal factor domain (38). This could imply that it is understood as equal with biological sex. Definitions of gender in accordance with gender theories (14) include social and cultural factors, for example that manliness and womanliness are differently shaped in different contexts.
The current study was performed in a Scandinavian context and the results might be different in another culture. In clinical practice, the body never exists without a context, and biological differences between women and men are not only due to genes. According to Fausto-Sterling, we must remember that anatomy limits function and function shapes anatomy (39).
This study has some limitations. First, it was an exploratory study of a clinical development project. The methods were evaluated and shown to be useful for exploration of gender differences and similarities; however, the sampling of patients was more difficult than expected because of reorganization of primary healthcare during the sampling period. The reorganization resulted in a smaller sample than initially planned.
Another limitation is that few patients were of non-Swedish origin. In nationwide statistics, patients of non-Swedish origin are more common than in our sample. However, the numbers in this study are consistent with the demographics of Västerbotten County. When comparing our sample with other studies in Swedish settings, we cannot find any other critical differences in personal demographics or other variables. There were more women than men in our sample, which reflects the reality of Swedish physiotherapy settings (3).
Our analysis used single questions from questionaires tested for reliability and validity. This does not mean that the single questions are automaticlly reliable or valid. However, grouped questions in the PCA were derived primarily from the same questionaires.
When studying differences between women and men, there is a danger of consolidating stereotypes about women and men. This, in turn, can lead to further differences. On the other hand, if one is not open to the possibility of differences, injustices or different needs will be neglected.
In conclusion, women and men mostly answered questions similarly, but there were differences: more women reported stress, pain and low support at work and more men reported doing fewer domestic work tasks. However, there was large variation between individuals within the groups of men and women.
References
APPENDIX I. Questions/variables loading ≤ –0.15 and ≥ 0.15 in the 3 components P1–P3 | |||
Questions from | Principal component analysis | ||
P1 (P1/P1SE) | P2 (P2/P2SE) | P3 (P3/P3SE) | |
Neck Disability Index, Oswestry Disability Questionnaire (a higher score indicates more disability) | |||
Pain intensity | –0.16 (–8.47) | 0.01 (0.18) | –0.09 (–2.28) |
Personal care | –0.16 (–5.42) | –0.07 (–2.98) | –0.01 (–0.31) |
Lifting | –0.16 (–9.16) | –0.07 (–2.56) | 0.01 (0.49) |
Sex life | –0.18 (–13.36) | –0.03 (–2.34) | –0.02 (–0.54) |
Social life | –0.18 (–13.81) | –0.03 (–1.01) | 0 (0.11) |
Travelling | –0.17 (–9.53) | –0.06 (–2.71) | –0.03 (–0.6) |
Driving | –0.16 (–9.5) | –0.06 (–2.41) | –0.04 (–1.62) |
Recreation | –0.19 (–21.19) | –0.04 (–1.39) | 0.03 (1.03) |
Work | –0.17 (–11.39) | –0.06 (–2.46) | 0.04 (1.62) |
Sittinga | –0.16 (–12.2) | –0.02 (–0.41) | –0.1 (–2.92) |
Standinga | –0.15 (–6.20) | 0 (0.07) | –0.06 (–1.76) |
Walkinga | –0.15 (–4.85) | –0.02 (–0.54) | 0 (0.05) |

APPENDIX I Contd. | |||
Questions from | Principal component analysis | ||
P1 (P1/P1SE) | P2 (P2/P2SE) | P3 (P3/P3SE) | |
Walking | –0.13 (–2.98) | –0.09 (–2.55) | –0.03 (–0.80) |
Running | –0.15 (–9.79) | –0.05 (–1.96) | 0 (–0.03) |
Carrying weights of 2 × 4–5 kg in both hands | –0.15 (–7.11) | –0.05 (–1.51) | –0.01 (–0.13) |
Standing | –0.16 (–16.42) | –0.05 (–2.29) | –0.04 (–1.17) |
Sitting at a desk | –0.16 (–8.69) | –0.06 (–2.06) | –0.05 (–1.65) |
Working in a forward leaning position | –0.15 (–12.34) | –0.08 (–1.65) | 0.04 (1.60) |
EuroQol (EQ–5D) (a higher score indicates more problems) | |||
Casual activities | –0.17 (–9.05) | –0.06 (–3.85) | 0.02 (0.68) |
Questions from Demand–Control–Support questionnaire (a higher score indicates more demands, less control, and less support) | |||
Does your job require too great a work effort? (demand) | –0.04 (–1.36) | 0.17 (3.79) | –0.05 (–0.84) |
Do you have the opportunity to learn new things in your work? (control) | –0.01 (–0.28) | 0.16 (4.07) | 0.09 (2.27) |
Do you have the possibility to decide for yourself what should be done in your work? (control) | 0.01 (0.16) | 0.1 (2.07) | 0.15 (3.49) |
There is a quiet and pleasant atmosphere at my place of work (support) | –0.05 (–1.12) | 0.23 (4.93) | 0.07 (1.51) |
There is good collegiality at work (support) | –0.07 (–1.84) | 0.21 (4.59) | –0.01 (–0.23) |
My co-workers (colleagues) are there for me (support me) (support) | –0.06 (–1.60) | 0.23 (4.50) | 0.02 (0.39) |
People at work understand that I may have a "bad" day (support) | –0.04 (–1.1) | 0.26 (8.56) | 0.02 (0.51) |
I get along well with my supervisors (support) | –0.06 (–1.55) | 0.2 (3.05) | 0.1 (4.17) |
I get along well with my co-workers (support) | –0.03 (–1.03) | 0.25 (5.38) | 0.03 (0.89) |
General Nordic Questionnaire for Psychological and Social Factors at Work QPS-Nordic (a higher score indicates negative effect on work-environment) | |||
At your organization are you rewarded (money, encouragement) for a job well done? | –0.01 (–0.18) | 0.21 (5.61) | 0.01 (0.24) |
Are workers well taken care of in your organization? | –0.06 (–1.16) | 0.25 (7.12) | 0.02 (0.62) |
To what extent is the management of your organization interested in the health and well-being of the personnel? | –0.03 (–0.52) | 0.24 (4.03) | 0.07 (1.87) |
Shirom-Melamed questionnaire, tension dimension (a higher score indicates more stress reactions) | |||
I feel tense | –0.08 (–1.88) | 0.19 (4.83) | –0.08 (–3.46) |
I feel relaxed (inverted) | –0.07 (–1.93) | 0.18 (6.12) | –0.06 (–1.95) |
I feel a strong inner tension | –0.08 (–2.64) | 0.15 (1.88) | –0.08 (–2.05) |
Pain and musculoskeletal symptoms (a higher score indicates more pain) | |||
Altogether, for how long have you had neck and back pain during the last 12 months? | 0.01 (0.32) | 0.08 (0.99) | –0.21 (–2.86) |
How strong is your neck/back pain at the moment? | –0.13 (–9.82) | 0.03 (0.27) | –0.22 (–6.74) |
How intense has your worst neck back/pain been the last 7 days? | –0.11 (–8.00) | –0.02 (–0.16) | –0.2 (–14.5) |
Mean pain intensity rating the last 7 days | –0.12 (–8.66) | 0.02 (0.21) | –0.22 (–9.02) |
The degree to which you are bothered by muscle stiffness/tightness in the back/neck | –0.11 (–5.92) | 0.04 (0.63) | –0.17 (–2.93) |
The degree to which you are bothered by fatigue in the back neck | –0.08 (–2.89) | 0.06 (0.55) | –0.19 (–3.67) |
Home, family and leisure timeb How much time do you spend in a week when in pain: | |||
Helping friends and family (more, as much or less in relation to when you do not have pain) | –0.07 (–2.82) | –0.1 (–1.11) | 0.21 (4.83) |
For maintenance and repair of dwelling (more, as much or less in relation to when you do not have pain) | –0.08 (–3.68) | –0.08 (–0.79) | 0.21 (5.62) |
Maintenance of car (more, as much or less in relation to when you do not have pain) | –0.06 (–3.56) | –0.06 (–0.65) | 0.2 (5.3) |
Grocery shopping (more, as much or less in relation to when you do not have pain) | –0.1 (–3.8) | –0.08 (–0.93) | 0.2 (6.42) |
Exercise (in hours) (a higher score indicates less time) | –0.1 (–5.48) | 0 (0.01) | 0.21 (9.78) |
Exercise (more, as much or less in relation to when you do not have pain) | –0.11 (–4.88) | –0.01 (–0.15) | 0.22 (4.31) |
Other leisure activities than exercise (more, as much or less in relation to when you do not have pain) | –0.08 (–3.06) | –0.08 (–1.19) | 0.19 (3.93) |
Do the neck and back pain affect your family in a negative way? | –0.15 (–9.36) | –0.02 (–0.52) | –0.05 (–1.13) |
Tampa Scale for Kinesiophobia | |||
I cannot do all the things normal people do because it is too easy for me to get injured | –0.05 (–2.87) | 0.03 (0.27) | 0.16 (3.3) |
Explanation of variance (R2X) | 0.17 | 0.07 | 0.05 |
R2X (cumulative) | 0.17 | 0.24 | 0.29 |
Prediction value (Q2) | 0.13 | 0.02 | 0.02 |
aAnswered only by back pain patients. bQuestions only available in Swedish. A loading was considered significant if the ratio (absolute loading)/(jack-knife standard error) exceeded 1.96. A ratio above 1.96 (irrespective of sign) corresponds to p < 0.05 and a ratio above 3.28 corresponds to p < 0.001. Significant loadings ≤ –0.15 and ≥ 0.15 are marked as bold. | |||

