Janneke Berecki-Gisolf, PhD1, Alex Collie, PhD2 and Rod McClure, PhD1
From the 1Monash Injury Research Institute and 2Institute for Safety, Compensation and Recovery Research, Monash University, Melbourne, Victoria, Australia
OBJECTIVE: To establish trends in whiplash-related health service use and cost in Victoria, Australia.
DESIGN: Administrative data analysis.
SUBJECTS: Whiplash patients claiming Transport Accident Commission (TAC) compensation for accidents dating between 1 January 2000 and 31 December 2009 (n = 51,263).
METHODS: Injury-related health service use during one year following the accident was determined from claim payment records. The incidence of whiplash claims in Victoria was calculated, as were inflation-adjusted health care costs.
RESULTS: In 2000–2009, the incidence of compensable whiplash decreased from 1.56 to 1.14 per 1,000 person-years. Physiotherapy, pharmaceuticals, general practitioner, chiropractic, radiology and osteopathy sessions were the most commonly claimed services. General practitioner, allied health and radiology services decreased, but analgesic use increased. Per person-years in the population, whiplash-related medical expenses were 71% greater for women than men. Overall, population burden decreased by 38%; the decline was most pronounced in persons aged 18–24 (54% decrease) and least pronounced in those aged ≥ 55 (23% decrease).
CONCLUSION: The population-based health service cost of whiplash decreased between 2000 and 2009. The overall reduction was related to a decrease in incidence and a reduction in service use per whiplash claim.
Key words: whiplash injuries; incidence; rehabilitation; epidemiology.
J Rehabil Med 2013; 45: 00–00
Correspondence address: Janneke Berecki-Gisolf, Monash Injury Research Institute, Building 70 Clayton Campus, Monash University, 3800 Melbourne, Australia. E-mail: janneke. berecki-gisolf@monash.edu
Accepted Apr 26, 2013; Epub ahead of print Aug 8, 2013
Introduction
Whiplash is an acceleration-deceleration mechanism of injury to the neck, typically resulting from motor vehicle accidents. Whiplash injury can lead to persistent pain and disability. The costs of medical care, work disability and other consequences of whiplash are considerable, affecting patients, families, employers and society in general. The incidence of whiplash injury as well as the cost associated with it varies considerably between countries, presumably due to differences in cultural attitudes and medical approach to the diagnosis and treatment (1).
The treatments advocated for whiplash injury have varied over the years, but the strongest supporting evidence is for exercise and mobilisation programs for treating acute and chronic whiplash (2). Currently recommended treatment guidelines include reassurance and advice to return to usual life activities as soon as possible, as well as active exercises (3). ‘Simple analgesics’ and short-term non-steroidal anti-inflammatory drugs (NSAIDs) are recommended to alleviate pain. Other treatment modalities are not routinely recommended due to insufficient or no evidence of its effectiveness.
Health service use for whiplash contributes substantially to the overall cost associated with the injury. The whiplash health service use burden in the population is driven by the whiplash incidence, the initial uptake of services per injury, and symptom persistence. If the current recommendation to resume normal activities as soon as possible, with an element of ‘self-management’, is indeed effective in preventing chronicity, a decrease in overall service use for whiplash can be expected. Ongoing improvements in whiplash protection systems in cars (4) can be expected to further reduce whiplash injury in the population (5). However, patterns of service use, and changes in injury-related service costs over time, are largely unknown. We therefore set out to establish the trends in use of services, and the total service cost, for whiplash injury resulting from road traffic crashes in Victoria, Australia. The purpose of this study is to provide (1) an overview of service use for whiplash injury, and trends in service use, and (2) a population-based estimate of trends in annual costs of whiplash related health services. Claims data were used to determine the population-based whiplash burden because in Victoria, health service costs resulting from a transport injury are compensated regardless of who caused the accident.
Methods
Setting
The Transport Accident Commission (TAC) is a state-government organisation established to pay for treatment and benefits for people injured in traffic accidents in the state of Victoria, Australia. It is a population-based scheme, funded from annual car registration payments by Victorian motorists. It uses a no-fault scheme, i.e. the injured person is eligible for benefits regardless of who caused the accident. Income replacement, medical, rehabilitation and lifetime care costs resulting from transport injury are compensated by the scheme. A medical excess applies to medical and paramedical treatment costs: the first AU$450–564 of medical expenses is not reimbursed by the scheme. (During the study period, the medical excess amount varied from AU$450 before 1 July 2004 to AU$564 after that date.) The medical excess does not apply to ambulance and hospital treatment: these services are reimbursed immediately. Also the medical excess does not apply to any patient who was admitted to hospital for one day or more. There are other exceptions to the medical excess policy (6).
Australia also has a universal healthcare programme that is funded by the Australian government: Medicare. Treatment by health professionals such as doctors and specialists is free or subsidised; allied health services are only subsidised under special circumstances. In addition to Medicare, Australians are able to purchase private health insurance. Although the TAC covers all reasonable medical expenses related to motor vehicle accidents, in some cases services such as General Practitioner (GP) visits might be charged to Medicare.
A fully de-identified research database containing Transport Accident Commission claims and payments records is held at the Institute of Safety, Compensation and Recovery Research (Melbourne, Australia) (7). This was the data source for this study. Institutional ethics approval was gained from Monash University Human Research Ethics Committee for use and disclosure of the claims information.
Sample
Compensation claims data for accidents dating between 1 January 2000 and 31 December 2009, for persons aged ≥ 18 years only, were analysed (n = 150,794). The injury specified on the claim refers to the most serious injury only. There were 52,263 claims for which whiplash was recorded as the most serious injury. The injury is coded by Transport Accident Commission claims managers on the basis of information provided to them on the claim form or in an interview with the injured person; or the information may come from a hospital.
Health service use outcomes
Injury-related health service use during one year following the accident date was determined from claim payment records. Types of commonly used services were determined by ranking all medical and paramedical service payments and selecting the most commonly used: 22% of payments were for physiotherapy; 14% for pharmaceuticals (‘chemist’); 10% for GP consultations; 8% for chiropractic; 5% for radiology and 3% for osteopathy. Together, these commonly used services accounted for 61% of the payments. Physiotherapy, chiropractic and osteopathy were grouped as ‘allied health services’.
Prescription medication use was determined from reimbursed prescriptions listed in the Pharmaceutical Benefit Scheme (PBS). The Australian Government subsidises medicines that are necessary to maintain the health of the community in a way that is cost effective: these drugs are listed in the PBS (8). To determine which categories of drugs were commonly prescribed, the first-year prescriptions were grouped according to the Anatomical Therapeutic Chemical (ATC) Classification System and ranked. The most commonly prescribed drug classes were analgesics (ATC code ‘N02’), followed by anti-inflammatory and antirheumatic drugs (‘M01’), all of which were non-steroidal anti-inflammatory and antirheumatic drugs (NSAIDs; ‘M01A’). The use of analgesics and/or NSAIDs was determined from the payments data and considered in further analyses.
The summed cost of reimbursed health services during follow-up was calculated for each claim. These amounts were adjusted for inflation by dividing by the quarterly Australian Consumer Price Index for “Health” corresponding with the service date (9). The results are given in constant (inflation-adjusted) dollars with January 2000 taken as the reference point. For modelling purposes the choice of reference point does not matter because changing the reference point multiplies the whole series by a constant.
Predictors
Information regarding age, gender, residential postcode, and role in the accident was available in the claims data. Residential postcodes were available for 97% of claims. Accessibility of the area of residence was derived from the postcode using the Accessibility/Remoteness Index of Australia (ARIA) (10); 3% were coded as ‘postcode missing’. The use of emergency services was defined as the use of an ambulance or use of hospital services within 7 days of the accident. This information was derived from the claims payment data; these services are exempt from the medical excess policy.
Statistical analysis
All analyses were carried out using SAS 9.2 software.
Incidence. The incidence of compensated whiplash injury among adults in the state Victoria, Australia was calculated by dividing the number of claims by the number of Victorian residents aged 18 years and over in the corresponding time period (2000–2009). The incidence was calculated by age, gender, area of residence and accident year. The number of residents in each ARIA, grouped as ‘highly accessible’/ ‘accessible’/‘moderately accessible’ was only available for age ranges 0–4, 5–9, 10–14, 15–19, 20–24, etc. (11) The incidence calculations per ARIA are therefore based on a residential population aged ≥ 15 years. Because persons aged 15, 16 and 17 years are included in the denominator (residential population) but not the numerator (limited to claimants aged 18 or more) of the incidence equation, the results are a slight underestimate of the true incidence.
Health service. Reimbursed health services for whiplash injury, within a year of the accident, were analysed. Service use is presented as a percentage (the number of users divided by the number of persons with a whiplash injury claim) as well as the mean number of sessions among users. Because the data was highly skewed, a median is also presented. Cervical spine imaging is only presented as percentage because repeated imaging is uncommon. The inflation-adjusted costs of reimbursed health services during follow-up were summed and presented as mean and median.
Factors associated with whiplash-related health service costs. The pattern of predictors (age, gender, area of residence, year of accident) and outcomes (health service use) followed a similar pattern for all outcomes with the exception of cervical spine imaging. Therefore, to determine the factors associated with health service use for whiplash injury, total cost was modelled. Because the cost data was highly skewed, and over-dispersed for a Poisson regression, a negative binomial model was used (PROC GENMOD in SAS). The model was stratified by use of emergency services, because emergency service use generates a claim immediately without the need to first reach the medical excess: this may result in a different case-mix.
Distribution of whiplash-related health service costs in the population. Whiplash incidence and medical services cost per claim were combined to calculate the whiplash-related health service burden in the population. The summed inflation-adjusted medical expenses were divided by the number of residents; the results are given as (year 2000) AU$ per 1,000 person-years.
Results
Between 1 Jan 2000 and 31 Dec 2009 there were 150,794 new Transport Accident Commission claims; 34% were for whiplash as the most serious injury. The incidence of compensable whiplash injury was 1.33 per 1,000 person-years (Table I). Incidence was higher for women than for men, and incidence decreased with increasing age. Persons living in highly accessible areas (which was the vast majority) had more whiplash injury.
During the study period the incidence of whiplash claims decreased by 27% (from 1.56 to 1.14 claims per 1,000 persons-years; Table I), whereas the incidence of all other TAC claims decreased by only 13% (from 2.81 to 2.44 claims per 1000 person years). Claims for whiplash as a proportion of all claims decreased from 36% in 2000–2001 to 32% in 2008–2009 (difference of 4%, 95% CI [3–5]).
|
Table I. Whiplash Injury claim incidence for adult residents of the state Victoria, Australia |
||||
|
Adult population |
||||
|
Claims for whiplash injury in 2000–2009 n |
Victorian adult residentsa n |
Whiplash claim incidence per 1,000 person-years [95% CI] |
||
|
All |
51,263 (100) |
3,864,088 |
1.33 [1.32–1.34] |
|
|
Gender |
||||
|
Male |
19,498 (38) |
1,886,883 |
1.03 [1.02–1.05] |
|
|
Female |
31,758 (62) |
1,977,204 |
1.61 [1.59–1.62] |
|
|
Age |
||||
|
18–20 years |
5,849 (11) |
210,189 |
2.78 [2.71–2.85] |
|
|
21–24 years |
6,421 (13) |
286,692 |
2.24 [2.19–2.30] |
|
|
25–34 years |
11,990 (23) |
738,586 |
1.62 [1.59–1.65] |
|
|
35–44 years |
9,953 (19) |
757,219 |
1.31 [1.29–1.34] |
|
|
45–54 years |
8,031 (16) |
683,021 |
1.18 [1.15–1.20] |
|
|
55–64 years |
4,927 (10) |
519,798 |
0.95 [0.92–0.97] |
|
|
≥ 65 years |
4,092 (8) |
668,584 |
0.61 [0.59–0.63] |
|
|
Area of residence |
||||
|
Highly accessible |
46,842 (91) |
3,721,941b |
1.26 [1.25–1.27] |
|
|
Accessible |
2,542 (5) |
246,882b |
1.03 [0.99–1.07] |
|
|
Moderately accessible |
223 (0.4) |
109,952b |
0.20 [0.18–0.23] |
|
|
Postcode missing |
1,656 (3) |
|||
|
Year |
||||
|
2000–2001 |
11,328 (22) |
3,621,173c |
1.56 [1.54–1.59] |
|
|
2002–2003 |
10,900 (21) |
3,730,708 |
1.46 [1.43–1.49] |
|
|
2004–2005 |
10,105 (20) |
3,844,150 |
1.31 [1.29–1.34] |
|
|
2006–2007 |
9,494 (19) |
3,980,535 |
1.19 [1.17–1.22] |
|
|
2008–2009 |
9,436 (18) |
4,143,873 |
1.14 [1.12–1.16] |
|
|
aMean over the years 2000–2009. bMean over the two-year interval. cPersons aged ≥ 15 years. |
||||
Seventy-five percent of claims included payments for emergency services (ambulance or hospital services within a week of the accident date). Thirty percent of claims included a cervical spine X-ray payment; 7% included a cervical computed tomography (CT) payment and 34% claimed at least one of these. The proportion of claims with cervical spine radiology tended to decrease during the study period; in particular, the use of X-rays decreased whereas the use of CT scans increased (Fig. 1). Cervical spine radiology was more common with younger age, and among persons who used emergency services such as an ambulance (Table II).
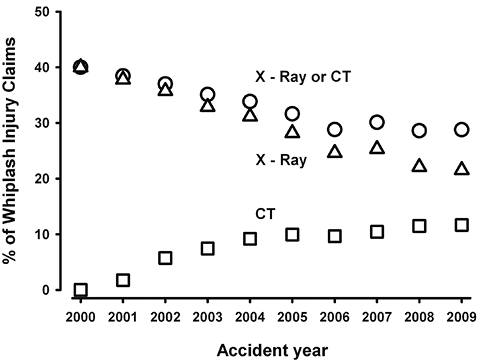
Fig. 1. Cervical spine radiology for whiplash injury due to road traffic accidents. Square= CT; triangle = X–ray; circle = X-ray or CT.
|
Table II. Health service use for which the costs were reimbursed via whiplash injury claims |
||||||||||||||||
|
X-Ray or CT Row % |
General practitioner visits |
Allied health servicea |
Analgesic or NSAID prescriptions |
Medical costs/Consumer Price Index (1990 AU$)b |
||||||||||||
|
Row % |
Among users |
Row % |
Among users |
Row % |
Among users |
|||||||||||
|
Mean |
Median |
Mean |
Median |
Mean |
Median |
Mean |
Median |
|||||||||
|
All |
34 |
17 |
6.2 |
3 |
19 |
25.5 |
19 |
4.9 |
4.9 |
3.0 |
673 |
176 |
||||
|
Gender |
||||||||||||||||
|
Male |
33 |
15 |
6.0 |
3.0 |
16 |
24.4 |
17 |
4.0 |
4.7 |
2.0 |
634 |
167 |
||||
|
Female |
34 |
17 |
6.3 |
3.0 |
21 |
26.0 |
20 |
5.4 |
5.5 |
3.0 |
697 |
180 |
||||
|
Age |
||||||||||||||||
|
18–20 years |
37 |
8 |
3.1 |
1 |
8 |
19.2 |
15 |
1.1 |
3.5 |
2.0 |
366 |
142 |
||||
|
21–24 years |
36 |
10 |
4.5 |
2 |
13 |
23.7 |
16 |
2.2 |
4.1 |
2.0 |
464 |
157 |
||||
|
25–34 years |
33 |
14 |
6.1 |
3 |
19 |
24.7 |
19 |
4.0 |
4.5 |
2.0 |
604 |
168 |
||||
|
35–44 years |
33 |
20 |
6.6 |
4 |
23 |
26.6 |
20 |
6.7 |
5.3 |
3.0 |
783 |
184 |
||||
|
45–54 years |
34 |
22 |
7.3 |
4 |
24 |
27.2 |
20 |
7.8 |
5.2 |
3.0 |
883 |
199 |
||||
|
55–64 years |
32 |
23 |
6.4 |
4 |
23 |
27.5 |
21 |
6.9 |
4.7 |
3.0 |
819 |
201 |
||||
|
≥ 65 years |
31 |
19 |
5.7 |
4 |
16 |
22.9 |
18 |
4.2 |
5.2 |
3.0 |
789 |
196 |
||||
|
Use of emergency services* |
||||||||||||||||
|
Any |
41 |
14 |
5.7 |
3 |
13 |
24.7 |
18 |
3.4 |
5.3 |
3.0 |
654 |
190 |
||||
|
None |
11 |
25 |
7.0 |
4 |
37 |
26.4 |
20 |
9.3 |
4.6 |
2.0 |
729 |
67 |
||||
|
Area of residence |
||||||||||||||||
|
Highly accessible |
34 |
16 |
6.3 |
3 |
19 |
25.9 |
19 |
4.9 |
4.9 |
2.0 |
678 |
179 |
||||
|
Accessible |
34 |
19 |
4.7 |
2 |
12 |
19.5 |
13 |
3.3 |
6.1 |
3.0 |
550 |
125 |
||||
|
Moderately accessible |
31 |
20 |
2.9 |
1 |
9 |
16.7 |
13 |
1.8 |
3.3 |
3.5 |
432 |
108 |
||||
|
Postcode missing |
28 |
21 |
5.5 |
3 |
23 |
22.4 |
17 |
5.9 |
4.8 |
2.0 |
742 |
158 |
||||
|
Role in accident |
||||||||||||||||
|
Driver |
35 |
17 |
6.3 |
3 |
20 |
26.2 |
20 |
5.0 |
4.9 |
2.0 |
672 |
176 |
||||
|
Passenger |
34 |
16 |
6.0 |
3 |
17 |
24.5 |
18 |
4.5 |
4.8 |
3.0 |
661 |
176 |
||||
|
Other/unknown |
24 |
16 |
5.4 |
3 |
18 |
22.7 |
16 |
4.9 |
5.1 |
3.0 |
707 |
178 |
||||
|
Year |
||||||||||||||||
|
2000–2001 |
39 |
19 |
6.8 |
3 |
21 |
29.4 |
22 |
3.4 |
3.7 |
2.0 |
761 |
210 |
||||
|
2002–2003 |
36 |
17 |
5.9 |
3 |
18 |
25.0 |
19 |
4.9 |
5.2 |
3.0 |
647 |
183 |
||||
|
2004–2005 |
33 |
16 |
5.8 |
3 |
17 |
24.3 |
19 |
5.5 |
5.0 |
3.0 |
628 |
169 |
||||
|
2006–2007 |
29 |
16 |
6.2 |
3 |
18 |
24.3 |
19 |
5.6 |
4.9 |
3.0 |
673 |
155 |
||||
|
2008–2009 |
29 |
14 |
6.1 |
3 |
19 |
23.2 |
17 |
5.1 |
5.5 |
2.0 |
647 |
148 |
||||
|
aAllied health service was defined as physiotherapy, chiropractic or osteopathy. bInflation-adjusted to 2000 AU$. cUse of emergency services: ambulance or use of hospital services within 7 days of the accident. NSAID: Non-Steroidal Anti-Inflammatory Drug; CPI: Consumer Price Index. |
||||||||||||||||
GP services were claimed by 17%. GP service claims increased with age to reach a maximum at ages 45–54 years (Table II). Those who did not use emergency services were more likely to claim GP services. GP service use gradually declined during the study period: use decreased from 14,850/11,328 = 1.31 visits per claim in 2000–2001 to 8,266/9,436 = 0.88 visits per claim in 2008–2009.
The most commonly used allied health service was physiotherapy (15%) followed by chiropractic (5%) and osteopathy (2%). Nineteen percent of persons used at least one allied health service. The pattern of use was similar to that of GP services, with greater use among persons in their late 40s and early 50s, and those without emergency service use. Use was greatest in highly accessible residential areas. Allied health service use gradually decreased over the study period: use decreased from 70,429/11,328 = 6.22 sessions per claim in 2000–2001 to 41,871/9,436 = 4.44 sessions per claim in 2008–2009.
Analgesics were claimed by 3.7% of persons; 85% of analgesic prescriptions were for opioids. Of the opioids prescriptions, 43% were for codeine. NSAIDs were claimed by 3.1% of persons. Overall, 4.9% of claims included a payment for either analgesics or NSAIDs. Factors associated with analgesic and/or NSAID prescriptions were similar to the patterns for GP visits and allied health services. Time trends in use, however, differed: analgesic and/or NSAID use increased from 920/11,328 = 0.08 reimbursed prescriptions per claim in 2000–2001 to 1195/9,436 = 0.21 in 2008–2009.
The results of multivariable models of factors associated with first-year medical expenses are shown in Table III. For claims without emergency services, female sex was associated with higher overall medical costs in the first year post-injury. Medical costs were highest in the age range 35–55 years and lowest in the age range 18–20 years. Living outside the ‘highly accessible’ areas was associated with less whiplash-related medical expenses. The total costs tended to be less in the years 2002–2009 compared to the years 2000–2001. For claims with emergency services, the factors associated with total medical costs in the first year were similar, with two noteworthy exceptions. First, the age range with the greatest cost was 45 years and over, and expenses did not go down after age 65. Second, the medical costs per claim were significantly less in 2008–2009 compared to 2000–2001, in this group.
|
Table III. Negative binomial modelling of summed medical expenses claimed for whiplash injury, within a year of the accident. The model is stratified by emergency services use, because these services can be claimed immediately and are exempt from the medical excess, thereby removing a claim threshold. All listed predictors are included in the model |
|||
|
Claims without emergency services (n = 12,900) IRR [95% CI] |
Claims with emergency services (n = 38,356) IRR [95% CI] |
||
|
Gender |
|||
|
Male |
1 (ref) |
1 (ref) |
|
|
Female |
1.19 [1.07–1.33] |
1.09 [1.05–1.13] |
|
|
Age |
|||
|
18–20 years |
0.73 [0.56–0.95] |
0.81 [0.76–0.87] |
|
|
21–24 years |
1 (ref) |
1 (ref) |
|
|
25–34 years |
1.42 [1.17–1.73] |
1.27 [1.20–1.35] |
|
|
35–44 years |
1.95 [1.60–2.38] |
1.62 [1.52–1.72] |
|
|
45–54 years |
1.95 [1.60–2.40] |
1.92 [1.80–2.05] |
|
|
55–64 years |
1.79 [1.43–2.24] |
1.81 [1.68–1.95] |
|
|
≥ 65 years |
1.32 [1.03–1.68] |
1.91 [1.77–2.06] |
|
|
Area of residence |
|||
|
Highly accessible |
1 (ref) |
1 (ref) |
|
|
Other |
0.79 [0.65–0.96] |
0.95 [0.90–1.01] |
|
|
Year |
|||
|
2000–2001 |
1 (ref) |
1 (ref) |
|
|
2002–2003 |
0.86 [0.74–1.00] |
0.83 [0.79–0.87] |
|
|
2004–2005 |
0.84[0.72–0.99] |
0.81 [0.77–0.85] |
|
|
2006–2007 |
0.87 [0.75–1.02] |
0.85 [0.80–0.90] |
|
|
2008–2009 |
0.83 [0.71–0.97] |
0.82 [0.77–0.86] |
|
|
IRR: incidence rate ratio; CI: confidence interval. |
|||
The population-based health services burden of whiplash injury was calculated by combining the health service costs per claim with whiplash claim incidence (Fig. 2(a)). The results only include cost to the insurance scheme and do not include the medical excess paid out of pocket. The expenses per 1,000 person years were similar for ages 18 to 54 and declined from the age of 55 years onwards. The medical expenses for women were 71% higher than for men. The overall burden of whiplash-related medical expenses in the population decreased by 38% between 2000 and 2009. Age- and gender stratified trends are shown in Fig. 2(b). During the study period, the burden decreased by 41% for women and 33% for men. The steepest decline was among persons aged 18–24 (54% decrease), followed by those aged 25–54 (37% decrease). Among persons aged 55 years or more, the whiplash health service use burden decreased by only 23%.
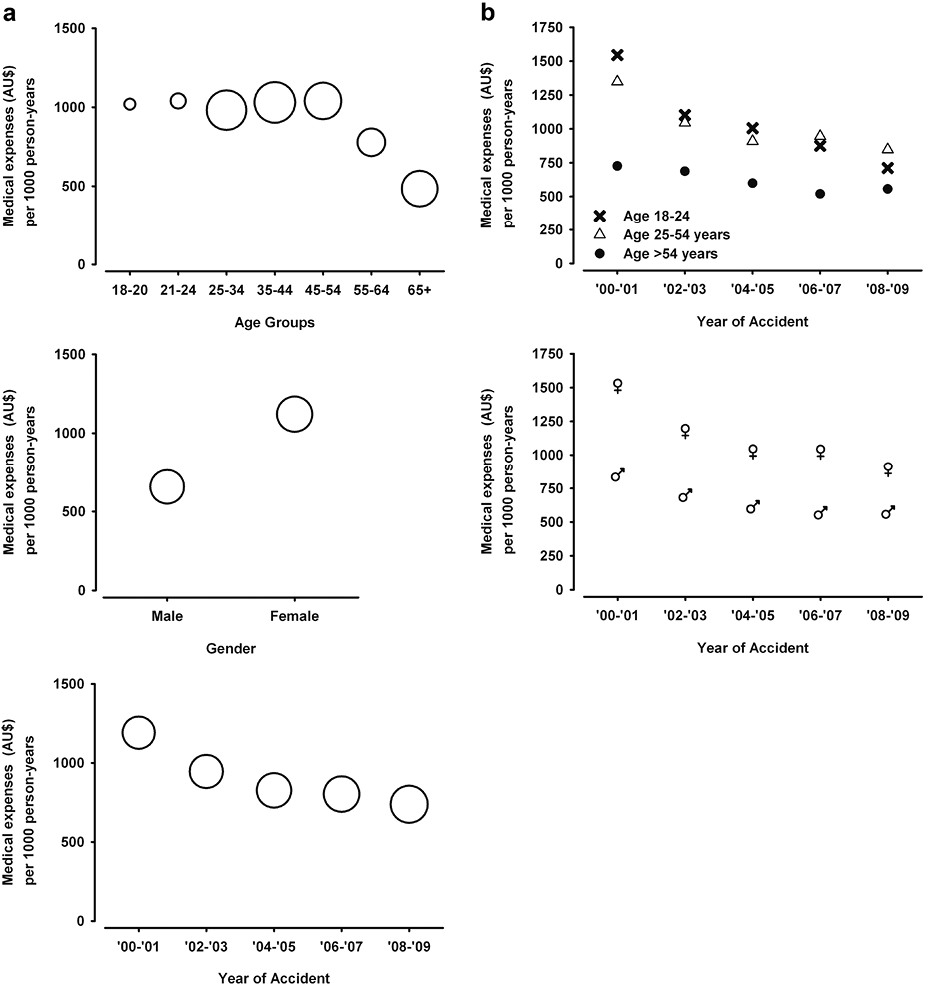
Fig. 2. Sum of whiplash-related health service expenses for which reimbursement was claimed, per 1,000 person-years in the state Victoria (Australia). Only expenses incurred within a year of the injury are included. Costs are inflation-adjusted to 2,000 AU$. (a) Results by age group (top), gender (middle) and year of the accident (bottom). Bubble size represents the number of adult residents in each category: the bubble size for women (middle figure) corresponds with 1,977,304 residents. (b) Age (top) and gender (bottom) stratified trends in whiplash-related health service expenses. Top: Crosses represent age group 18–24 years, triangles represent age group 25–54 years and circles represent age group above 54 years. Bottom: (♀) symbols show results of women, (♂) symbols show results of men.
Discussion
Whiplash claim rates decreased during the study period, as did the first-year health service cost per claim. The whiplash health service burden in the population was highest for women and for persons aged < 55 years. The overall service use burden decreased by 38% between the years 2000 and 2009.
Study strengths and limitations
The strength of this study is the population-based overview of the health services burden of whiplash injuries resulting from motor vehicle accidents. Being at fault in the accident does not impact study inclusion because a no-fault scheme operates in Victoria. The main weakness of the study is a selection bias resulting from the use of claims records. Observational health service use studies are sensitive to selection methods: for example if patients are recruited from the Emergency Department, those who present directly to the GP are not captured and this is likely to impact the observed subsequent service use. The claims data used in our study impact the selected sample in two ways. First, persons who do not have injury-related expenses are not captured (because they have nothing to claim). This leads to an underestimate of the injury incidence, but does not impact the population-based burden estimates (these are calculated as the whiplash-related service costs, divided by the adult population, regardless of whiplash injury incidence). Second, claims with non-emergency medical expenses only are not included if the accumulated medical costs are below the excess. The medical excess was AU$564 in 2005: in Victoria, this is equivalent to approximately 8–9 standard GP consultations. The medical excess policy results in an underestimation of the whiplash incidence and an underestimation of non-emergency service costs for whiplash. This study is based on claims records, and the results should be interpreted as such: reported incidence is the whiplash claim incidence; reported health service use refers to reimbursed health services; and the overall health services burden is the total health service cost to the compensation scheme.
This study is also limited by the hierarchical sorting of afflictions: motor vehicle accidents often result in multiple injuries, but in the compensation system relevant to the current study (the TAC), the injury ranked as ‘most severe’ is the primary basis of the claim. Persons suffering from whiplash as well as ‘more severe’ injuries are therefore not included in our study. This may have resulted in an underestimate of the overall whiplash incidence reported in this study. Halpin et al. (15) quantified the contribution of multiple injuries in estimates of motor vehicle occupant injuries and found that whiplash injury rates increased by 18% after multiple injuries were taken into account. There is a considerable range in the whiplash rates reported in other studies. In a 1994–1995 population-based study in Saskatchewan, Canada, the incidence was approximately 300 per 100,000 persons per 6 months (under a newly introduced no-fault scheme) (12). The rates were lower in some other studies: In Quebec, Canada, the incidence was 70 per 100,000 inhabitants in 1987 (13). The whiplash incidence in Northern Sweden in 2000–2009 was 235 per 100,000 inhabitants per year (14). To what extent these differences are due to study design, inclusion criteria and other factors remains to be determined.
Trend in incidence
Whiplash claim incidence decreased between 2000 and 2009 in our study conducted in Victoria, Australia. A recent study of whiplash injury after road traffic crashes for a defined population in Sweden did not show a similar trend: whiplash incidence determined from emergency department (ED) presentations remained stable during this time period (14). The authors also presented the incidence of whiplash insurance claims, which did not correlate: insurance claim incidence was lower (implying that not every ED whiplash presentation resulted in a claim) and decreased over time. In Victoria, Australia, ED presentations for road traffic crashes would automatically result in a claim. To compare our results to those of Styrke et al. (14), we selected only claims with a hospital presentation within 2 days of the accident (63% of claims). The results were not affected by this claim selection: the incidence decreased by 27% during the study period. The reduction in whiplash claim incidence observed in our study could be due to a range of factors: an overall state-wide reduction in kilometres driven per person; a reduction in crashes per kilometres driven; a decrease in neck injuries per crash; fewer whiplash diagnoses per neck injury; and fewer claims per whiplash diagnosis. Factors that might bring about these changes could include better access to public transport; high petrol prices; improved road safety; improved whiplash prevention systems in cars (5); changes in practice regarding the diagnosis and treatment of whiplash injury; and a decrease in attention for whiplash in the media. Any or all of these factors could have played a role in the reduction of whiplash claim incidence between 2000 and 2009 in Victoria, Australia. Studies of whiplash incidence in other regions and countries are needed to determine if the downward trend observed in our study is a local or an (inter)national phenomenon.
Trends in service use
During the study period, GP visits and allied health service use per whiplash injury claim decreased by 33% and 29% respectively, whereas the use of analgesics increased. In Australia, approved pharmaceuticals are subsidised under the Pharmaceutical Benefits Scheme. Although the remaining out-of-pocket costs can be reimbursed by the injury compensation scheme, these costs, if low, may be too trivial to be submitted. The increasing trend, and particularly the use of opioids for whiplash injury, is a concern but needs to be interpreted with caution as the full range of pharmaceutical use is not captured in this study because of the impact of the medical excess.
We have not been able to identify any previous reports of the trends in health service use for whiplash injury for comparisons. The use of physiotherapy, the most frequented service in our study, can be compared with a recent report of physiotherapy use by Motor Accident Commission claimants in South Australia (16). Of the whiplash claimants 60% used at least one physiotherapy service and the median number of sessions was 14. South Australian claims were therefore more than 3 times as likely to contain a physiotherapy payment as Victorian claims. This vast difference could be attributed to several factors. First, the South Australian scheme operates under an ‘at fault’ third-party insurance system: the injured person is only compensated if another insured person was at fault. In Saskatchewan, Canada, not being at fault was associated with delayed claim closure under the tort system, and switching from a tort system to a no fault system improved the prognosis of whiplash injury (12). The difference in physiotherapy use may therefore be partly explained by differences in the compensation scheme: the biopsychosocial model can be used to understand why not-at-fault drivers are more likely to have a delayed recovery from whiplash injury (17). Second, the South Australian system does not impose a medical excess such as applies in Victoria. In Victoria, scheme amendments introducing the medical excess and a Common Law initiation limitation between 1987 and 1991 lead to a marked reduction in whiplash claims (18). In claims data research, features of the compensation system are reflected in the results: health service use comparisons between different states or countries are confounded by scheme differences.
Gender and age
The whiplash health service burden in the population was 71% greater for women than for men. The majority of whiplash claimants were women; in previous studies women have been reported to be at greater risk of whiplash injury, but the evidence is inconsistent (19). In a Swedish insurance database follow-up study, Berglund et al. (20) reported a higher risk of whiplash injury among women; this was consistent across age groups, types of motor vehicle crashes and seating position. Women may be at greater risk of whiplash than men due to gender differences in seated posture and relative seat geometry: gender differences in the head-neck motion response to rear impact tests have been reported (21, 22). Current crash test dummies are modelled on men; future development of a crash test dummy modelled on a 50th percentile woman may be beneficial for further design and development of effective whiplash protective systems (22).
Women used more health services per claim in our study: in other studies, female sex has been associated with slower recovery and chronic injury (23, 24) which may lead to a greater need for (ongoing) health services. Slower recovery and chronic injury need not be the only explanation for increased service use: women have been reported to use more medical services and have more outpatient expenses than men, even after adjusting for health status (25). The relative contribution of health service use tendency vs. whiplash chronicity to the gender difference in service use remains to be investigated.
The whiplash incidence decreased with age; this is in agreement with a previous study showing a similar pattern in Saskatchewan, Canada (12). Our results also show an increase in service use per claim with increasing age, levelling out some of the age disparity; overall, the population-based service use burden is greater for persons aged < 54 years. Interestingly, this age disparity diminishes over time. If the overall reduction in whiplash service burden is due to improved whiplash protection systems in cars, this effect might be more pronounced among younger persons. If the overall reduction is due to the introduction of ‘self-management’ and ‘resume normal activity as soon as possible’ recommendations, this might be less effective in older persons. Biological effects of aging may lead to slower injury recovery and higher risk of comorbid health conditions complicating recovery.
Conclusions
The population-based first-year health service cost of whiplash claims decreased by 38% between 2000 and 2009 in Victoria, Australia. The overall reduction was related to a decrease in whiplash claim incidence as well as a reduction in the service use per claim. The costs were greatest for women and persons aged < 55 years, but the age gap as well as the gender gap narrowed over time.
Acknowledgements
Funding: This project is funded by WorkSafe Victoria and the Transport Accident Commission, through the Institute for Safety, Compensation and Recovery Research (ISCRR).
This study is based on administrative claims data from the Compensation Research Database held at the Institute for Safety, Compensation and Recovery Research (Victoria, Australia).
Disclosures: The research was funded, at least partly, by the Transport Accident Commission (Victoria, Australia).
REFERENCES

