|
Table III. Individual item fit statistics for the revised subscales of the World Health Organisation quality of life abbreviated scale |
||||
|
Scale/Item |
Location |
Fit residual |
χ2 |
p |
|
Physical |
||||
|
3 |
0.090 |
1.291 |
1.960 |
0.581 |
|
4 |
–0.270 |
2.490 |
0.655 |
0.884 |
|
15,16 |
–0.143 |
0.071 |
6.294 |
0.098 |
|
10, 17, 18 |
0.324 |
–2.645 |
2.236 |
0.525 |
|
Psychological |
||||
|
5, 6 |
–0.538 |
–2.051 |
2.531 |
0.470 |
|
7 |
–0.341 |
2.130 |
5.003 |
0.172 |
|
11 |
–0.037 |
1.958 |
2.770 |
0.428 |
|
19 |
0.668 |
–2.134 |
8.691 |
0.034 |
|
26 |
0.248 |
0.055 |
0.663 |
0.882 |
|
Environmental |
||||
|
8 |
0.276 |
1.336 |
4.904 |
0.179 |
|
9 |
–0.372 |
–0.487 |
2.196 |
0.533 |
|
12, 25 |
–0.043 |
–1.430 |
5.492 |
0.139 |
|
13 |
–0.437 |
–0.960 |
1.375 |
0.712 |
|
14 |
0.853 |
1.179 |
3.253 |
0.354 |
|
23 |
–0.487 |
0.823 |
2.282 |
0.516 |
|
24 |
0.209 |
0.576 |
1.164 |
0.761 |
|
Combined |
||||
|
Physical/Social |
0.379 |
–0.787 |
0.259 |
0.967 |
|
Psychological |
–0.198 |
0.476 |
2.521 |
0.474 |
|
Environmental |
–0.181 |
0.677 |
1.708 |
0.635 |
|
χ2 = Chi Squared, p = probability. |
||||
Physical health subscale
Initial analysis of the 6 item physical health subscale revealed good reliability, significant misfit to the Rasch model and significant multidimensionality (Table I, analysis 1). There was inter-item dependence seen between items 10, 17 and 18 and DIF by age group for item 15 (p < 0.0001) with younger persons with equivalent levels of QoL more likely to endorse the item at a higher level (how well are you able to get around). DIF by age group was seen in the opposite direction for item 16 (how satisfied are you with your sleep) with younger persons more likely to endorse the item although this did not reach significance when applying a Bonferroni correction (p = 0.034). There were no disordered thresholds. Combining items 15 and 16 into testlets cancelled out DIF by age group at the test level and combining items 10, 17 and 18 removed all positive residual correlations between items. The modified 3 testlet scale, which included all 6 original items (Table I, analysis 2) showed fit to the model and met the assumption of unidimensionality but reliability was low. The scale was well targeted in this population as only 1/271 patients were found to have a logit value outside of the range of the items (Fig. 2A).
Psychological subscale
Analysis of the psychological subscale showed good reliability but misfit to the model (Table I, analysis 3). There was a significant correlation between items 5 and 6 and DIF by gender for item 6 with women more likely to endorse the item (to what extent do you feel your life to be meaningful). Combining items 5 and 6 eliminated DIF and all positive correlations between the items. The modified 6 item scale (Table I analysis 4) showed fit to the model with sufficient reliability. There was no significant misfit between individual persons or items, no disordered thresholds and no evidence of multidimensionality. The scale was well targeted in this population as only 3/271 patients were found to have a logit value outside of the range of the items (Fig. 2B).
Social relationships subscale
The 3-item social relationships subscale (Table I, analysis 5) showed fit to the model with no modifications required but had insufficient reliability. The subscale met the other assumptions of the Rasch model with no positive correlations between individual items, no DIF by age group or gender and no evidence of multidimensionality. The subscale had only 3 items and consequently only 9 response thresholds and it was therefore not possible to reliably assess for multidimensionality. In practice the scale had poor coverage across the social relationship construct, with large gaps between thresholds and a ceiling effect (Fig. 2C).
Environment subscale
Rasch analysis of the 8-item environmental subscale (Table I, analysis 6) revealed initial overall fit to the model but there was evidence of multidimensionality, disordered thresholds in item 25 and DIF by age group in item 12 (p = 0.0002) with older people more likely to endorse the item (have you enough money to meet your needs). Older people were less likely to endorse item 25 (p = 0.0251) (how satisfied are you with transport) although this did not reach significance with a Bonferroni correction applied. The scale was modified by combining responses 2 and 3 in item 25 and by combining items 12 and 25, which then showed no DIF for the new combined items when a Bonferroni correction for a 7-item scale was applied (p = 0.0076). Reanalysis of the modified scale (Table I, analysis 7) revealed fit to the model and reliability remained acceptable. There were no significant positive correlations greater than 0.1 between items and no evidence for multidimensionality. The scale was slightly off target in this population as 10/271 patients were found to have a logit value above that of the highest item (Fig. 2D).
Combined 4-domain scale
An attempt to validate a higher order measure of QoL related to physical, psychological, social and environmental factors was made by combining all items from the 4 subscales. An analysis of the unmodified 24 items in this scale (Table I, analysis 8) showed significant misfit to the model. There was significant multidimensionality present and assessment of inter-item dependence showed 10 pairs of items with correlations greater than 0.2, 10/11 of these correlations were between items from the same subscales. In view of this, the scale was reanalysed by combining items into 4 testlets grouped according to their original subscale. This modified 4 item scale (Table I, analysis 9) showed overall fit to the Rasch model but there was significant uniform DIF by gender in the physical health testlet with men scoring higher than women for an equivalent level of QoL (p = 0.0033). This uniform DIF by gender was shown to cancel out at the test level by combining the physical health and social relationships domains. Reanalysis of this 3 item scale (Table I, analysis 10) showed no evidence of multidimensionality (there were no positive correlations between any of the items, there was no evidence of misfit to the model and the solution showed good reliability. The total score for the combined scale showed strong correlations with item 1 which assessed patient’s perception of overall QoL (Spearman’s Rho=0.64, p < 0.00001). The scale was very well targeted in this population as none of the patients were found to have a logit value outside of the range of the items (Fig. 2E).
These findings enable us to produce a nomogram to convert raw scores to transformed logit values, thereby converting the WHOQOL-BREF from an ordinal to a linear scale (Table IV). Since no items were removed or rescored, the raw score does not require any further transformation and is merely the sum of the scores for all individual items of the scale. Logit values corresponding to the raw scores obtained by subjects were determined using RUMM2030. The range of logit values was transformed back into the original range of 24–120 using a simple linear transformation.
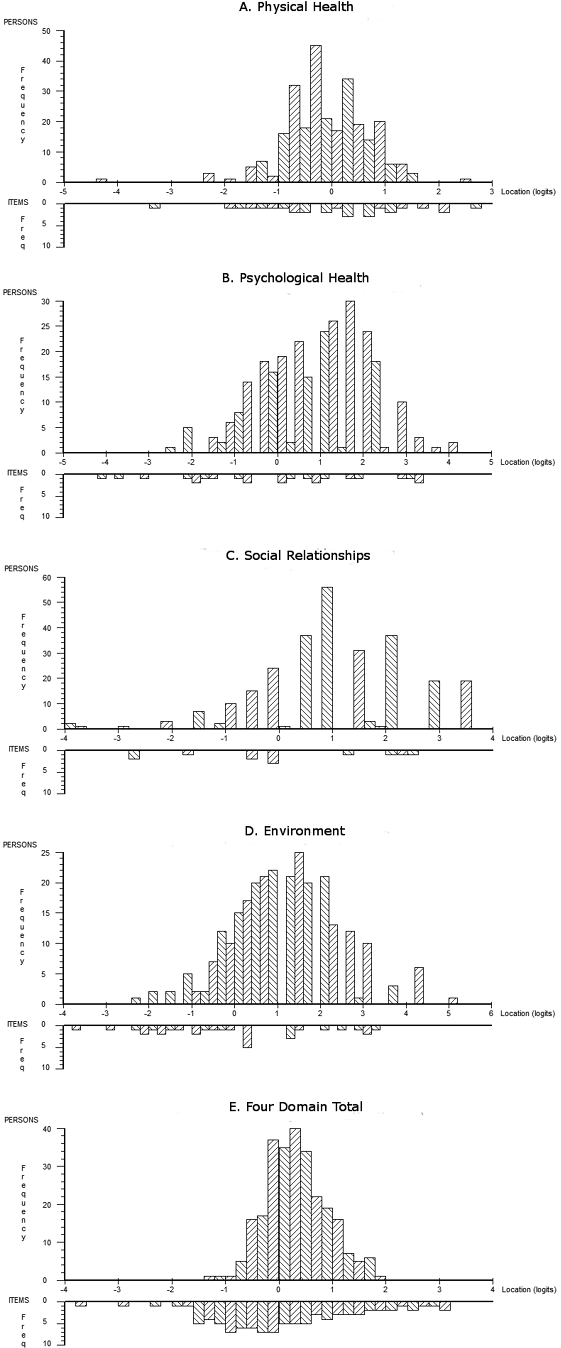
Fig. 2. Person–Item distribution plots comparing distribution of persons (upper plots) and items (lower plots) plotted on the same logit scales. The comparison between these two distributions illustrates the ability of each measure to cover the range of the latent trait (QoL) seen in the study population. Perfect matching of persons and items in a scale occurs when both distributions have a mean of zero logits and the distribution of persons does not fall outside the distribution of items.
|
Table IV. Nomogram to convert raw scores to transformed values |
||||
|
Raw score |
Transformed value |
Raw score |
Transformed value |
|
|
24 |
24.0 |
73 |
71.2 |
|
|
25 |
32.9 |
74 |
71.6 |
|
|
26 |
39.2 |
75 |
72.0 |
|
|
27 |
43.5 |
76 |
72.3 |
|
|
28 |
46.7 |
77 |
72.7 |
|
|
29 |
49.1 |
78 |
73.1 |
|
|
30 |
50.9 |
79 |
73.6 |
|
|
31 |
52.3 |
80 |
74.0 |
|
|
32 |
53.5 |
81 |
74.4 |
|
|
33 |
54.5 |
82 |
74.9 |
|
|
34 |
55.3 |
83 |
75.3 |
|
|
35 |
56.0 |
84 |
75.8 |
|
|
36 |
56.7 |
85 |
76.2 |
|
|
37 |
57.3 |
86 |
76.7 |
|
|
38 |
57.9 |
87 |
77.2 |
|
|
39 |
58.4 |
88 |
77.7 |
|
|
40 |
58.9 |
89 |
78.3 |
|
|
41 |
59.3 |
90 |
78.8 |
|
|
42 |
59.8 |
91 |
79.4 |
|
|
43 |
60.2 |
92 |
80.0 |
|
|
44 |
60.6 |
93 |
80.6 |
|
|
45 |
61.0 |
94 |
81.2 |
|
|
46 |
61.4 |
95 |
81.8 |
|
|
47 |
61.8 |
96 |
82.5 |
|
|
48 |
62.2 |
97 |
83.1 |
|
|
49 |
62.6 |
98 |
83.8 |
|
|
50 |
62.9 |
99 |
84.5 |
|
|
51 |
63.3 |
100 |
85.3 |
|
|
52 |
63.7 |
101 |
86.0 |
|
|
53 |
64.0 |
102 |
86.8 |
|
|
54 |
64.4 |
103 |
87.6 |
|
|
55 |
64.7 |
104 |
88.5 |
|
|
56 |
65.1 |
105 |
89.4 |
|
|
57 |
65.4 |
106 |
90.3 |
|
|
58 |
65.8 |
107 |
91.2 |
|
|
59 |
66.2 |
108 |
92.2 |
|
|
60 |
66.5 |
109 |
93.3 |
|
|
61 |
66.9 |
110 |
94.4 |
|
|
62 |
67.2 |
111 |
95.6 |
|
|
63 |
67.6 |
112 |
96.9 |
|
|
64 |
67.9 |
113 |
98.2 |
|
|
65 |
68.3 |
114 |
99.7 |
|
|
66 |
68.6 |
115 |
101.3 |
|
|
67 |
69.0 |
116 |
103.2 |
|
|
68 |
69.4 |
117 |
105.4 |
|
|
69 |
69.7 |
118 |
108.4 |
|
|
70 |
70.1 |
119 |
112.9 |
|
|
71 |
70.4 |
120 |
120.0 |
|
|
72 |
70.8 |
|||
|
This Table can be used to convert raw scores from the ordinal scale into transformed scores on a linear scale. This transformation is only valid where subjects have completed all items of the scale. |
||||
Discussion
This study has shown that the 4 domain structure of the WHOQOL-BREF is valid and it can be used to assess QoL in those with PPS. Each of the 4 subscales was shown to fit the Rasch model after accounting for local dependency and DIF. A total WHOQOL-BREF score has also been shown to be valid. The strategy of using testlets means that the WHOQOL-BREF can be used in its original format and summed to provide the subscale and total scores without deleting or rescoring items. As a consequence of this fit to the Rasch model, the WHOQOL-BREF scores can be transformed to interval-level latent estimates for use in parametric statistical methods, given distributional assumptions are met.
The application of these results is potentially limited by the fact that the study was performed in a single, developed country. However, the WHOQOL-BREF was designed to be applicable cross-culturally and further work is required to establish if the findings of this study are valid in different cultures, particularly in the developing world. Although the overall fit statistics were acceptable for each of the 4 subscales, other problems were highlighted by this analysis. Reliability was low in the social relationships and physical health domains and this is likely to be due to the short length of these subscales. The social relationships subscale consisted of only 3 items and the physical health subscale was reduced to 3 testlet-based items after items were combined to account for multidimensionality and DIF. DIF was seen in 3 items in this analysis although this was shown to cancel out at the scale level in all cases. This suggests that DIF may be a problem in different populations and in different versions of the scale. The targeting of the subscales to the latent trait of QoL in this study was generally good, but the spread of item difficulty was restricted in the short social relationships domain and the environment subscale did not cover some of the higher scoring subjects. This suggests that there may be problems with appropriate targeting of the subscales in other populations.
Recent attempts at applying the Rasch model to the WHOQOL-BREF in patients with depression and in normal subjects have differed in their methodology and in their interpretation of fit to the model. Liang et al. (26) applied the Taiwanese version of the scale to the normal, elderly population and found all 4 domains to be unidimensional and reliable but 3 items showed DIF thereby suggesting a potential bias when using the scale in different groups. Rocha & Fleck (27) used the Brazilian version in patients with depression and also demonstrated appropriate fit to the model in all 4 domains but 2 items showed dependency and 4 items needed to be rescored.
Two papers have applied Rasch analysis to investigate whether the WHOQOL-BREF can be used as a single unidimensional construct. Noerholm et al. (28) found evidence of significant multidimensionality when applying the Danish version of the scale to the general population. Wang et al. (29)demonstrated that the scale could be made to fit the model but this required the deletion of 8 items due to substantial DIF, thereby detracting from the original construct validity of the scale. No previous research has found the WHOQOL-BREF to fit the Rasch model without significant rescoring or deletion of items. It is possible that the strategy of using testlets to overcome the problems of local dependency may be the significant difference between the findings of the current study, and previous studies, as has been shown elsewhere with other scales (30). When the items are grouped into 3 or 4 testlets, as in our Total Score solution, this also enacts the bi-factor solution, and it is important to note that the latent (person) estimate is based upon this dominant common factor.
Thus in this study, the scale was shown to meet the model’s assumptions merely by combining items which were locally dependent. It did not require collapsing of thresholds, or deletion of items, and can therefore be administered in the field without modifications. This was reinforced by the finding of a strong correlation between the transformed scores and item one of the WHOQOL-BREF, which asked subjects to rate their overall QoL. Consequently the study provides a robust solution which overcame the problems of local dependency, and the targeting and reliability seen in analyses of the individual subscales, since the combined measures showed excellent reliability and a much wider coverage of the latent trait.
The summed 4-domain score is therefore a sufficient statistic and provides a simple ordinal estimate of QoL, reliable enough for individual use. In addition, where complete data is available for a subject, the raw scores can be converted using the nomogram into a linear measure of overall QoL in PPS thus providing a more appropriate quantitative outcome measure for service evaluation.
These findings show that the WHOQOL-BREF can be used to fulfil recommendations for further research in PPS which include measurement of QoL and the development of PPS-specific responsive, reliable and valid measures (2). The cross-cultural validity of the WHOQOL-BREF allow it to be used in the future for multicentre assessment of the efficacy of interventions in PPS, and to study further the factors that mediate the impact of health status upon QoL.
Acknowledgements
This work was supported by the British Polio Fellowship and the Neurological Disability Fund of the Walton Centre for Neurology and Neurosurgery. We would like to give special thanks to our participants who graciously gave their time to take part in this study.
References
Appendix I. Using testlets to accommodate local response dependency of items |
In some scales, and particularly in health, it is not uncommon to find items that are locally dependent (1). For example, ‘dressing upper body’ with ‘dressing lower body’ (2). When data from these scales are fitted to the Rasch model, then it is possible that items such as these will have a high residual correlation (3). That is, they are correlated conditional upon the trait being measured, after the effect of the trait itself has been removed. This breaches one of the main assumptions underlying the summation of a set of items. The effect of this is to inflate reliability and cause misfit to the Rasch model, as the probability of response to the item is often much higher than expected by the model (4). |
The issue is also not uncommon in certain educational tests where, for example, a comprehension test may have a single paragraph and several associated questions. This challenge to the local independence assumption has been dealt with by the use of testlets (5). A testlet is simply a summated set of items making a larger (super) item. It is a mechanism to deal with this problem, and does not affect the use, or scoring of the scale in any way. For example, the responses from 3 dichotomous walking items which ask about the distance walked can be added together to make one polytomous item, as if those questions had been asked as one question about how far a person can walk, with 3 response options reflecting distance (which may have been a better way to ask the question in the first place). |
The presence of local (response) dependency is determined by examination of the residual correlation matrix. There is no definitive value of a correlation that indicates dependency, but it is usual to take 0.2 or 0.3 as indicative (6). With small scales it is worth finding out the mean residual correlation, as this may be negative, and thus a value of 0.1 may be indicative in these circumstances (this can be found out by exporting the matrix into Excel, removing the ‘ones’ on the diagonal, blocking, and Excel will report the mean). In some Rasch programmes such as RUMM, this process of creating testlets can be done as part of the general process of Rasch analysis (the subtest procedure in RUMM)(7). In other software, after the initial investigation, it may be necessary to group items together in the primary data file (e.g. SPSS) and to re-enter the data. Once this has been done, and the data are re-entered, then the testlets just become the same as any other polytomous item. |
References |
1. Wright B.D. Local dependency, correlations and principal components. Rasch Measurement Transactions 1996; 10: 509–511. |
2. Lundgren Nilsson Å, Tennant A. Past and present issues in Rasch analysis: the functional independence measure (FIM™) revisited. J Rehabil Med. 2011; 43: 884–891. |
3. Rasch, G. Probabilistic models for some intelligence and attainment tests. Chicago: University of Chicago Press, 1960. |
4. Marais I, Andrich D. Formalizing dimension and response violations of local independence in the unidimensional Rasch model. J Appl Meas 2008; 9: 200–215 |
5. Wainer H, Kiely G. Item clusters and computer adaptive testing: A case for testlets. J Educ Meas 1987; 24: 185-202. |
6. Andrich D, Marais I. Effects of varying magnitude and patterns of response dependence in the unidimensional Rasch model. J Appl Meas 2008; 9: 105-124. |
7. Andrich, D, Sheridan BED, Luo, G. RUMM2030: Rasch unidimensional models for measurement. Perth, Western Australia: RUMM Laboratory, 2009. |

