OBJECTIVE: To investigate the recovery pattern of bilateral upper extremity muscle strength and to predict the recovery of strength early after stroke using a logarithmic regression model.
DESIGN: Longitudinal study.
SUBJECTS: Twenty-one inpatients with post-stroke hemiparesis were enrolled. The mean time after stroke event was 7.1 days (standard deviation (SD) 3.5 days).
METHODS: Bilateral elbow flexion and extension strengths were assessed separately with a hand-held dynamometer. Grip strength was also assessed with a Jamar dynamometer. These measurements were carried out on 4 occasions: baseline assessment within 2 weeks following stroke onset, and at weeks 1, 2 and 3 following baseline evaluation. Recovery of flexion and extension strengths was predicted using a logarithmic model using scores at the initial 2 evaluations.
RESULTS: The time course of recovery for bilateral upper extremities resembled a logarithmic function. Moreover, on the basis of a logarithmic regression model, baseline measures of bilateral strengths sampled from 2 time-points during recovery could be applied to predict the pattern of recovery accurately during the subacute stroke phase (R2 = 0.74–0.95, p < 0.0001).
CONCLUSION: Upper extremity muscle strength improved significantly in a similar pattern on the sides contralateral and ipsilateral to the brain lesion. Moreover, a logarithmic regression model accurately predicted both measures.
Key words: upper extremity muscle strength; activities of daily living; prognosis; rehabilitation; stroke.
J Rehabil Med 2011; 43: 935–943
Correspondence address: Makoto Suzuki, Faculty of Medical Technology, Niigata University of Health and Welfare, 1398 Shimami-cho, Niigata City, Niigata 950-3198, Japan. E-mail: mak-suzu@nuhw.ac.jp
Submitted December 10, 2010; accepted July 21, 2011
INTRODUCTION
Upper extremity muscle weakness is a major problem in patients after stroke. Annually, 795,000 people in the USA have a stroke (1). Upper extremity hemiparesis after stroke is considered the primary body dysfunction underlying stroke-induced activity limitation and is the body dysfunction treated most frequently by therapists (2). However, 6 months after a stroke, 88.4% of hemiplegic stroke patients still have a paretic arm without function (3). Recovery of arm movement is thought to be less than recovery of leg movement (4).
One of the main body dysfunctions after stroke is reduced muscle strength on the side contralateral to the brain lesion (2–5). However, there is an increasing body of evidence indicating that the dysfunctions are not only contralateral but also ipsilateral (6–10). Colebatch & Gandevia (11) found that unilateral damage to the motor cortex or its descending projections produced some weakness in the ipsilesional limb. The following possible mechanisms are indicated for deficits in ipsilateral limb movements: (i) the primary motor cortex may exert bilateral descending control over distal movements; (ii) damage to one hemisphere may alter callosal signals and disrupt neural processing in the opposite hemisphere; (iii) immobility after stroke; and (iv) weight loss due to malnutrition following swallowing and nutritional difficulties (9, 12, 13). Although there is no general consensus with respect to these possibilities, ipsilateral upper extremity muscle weakness may be considered as a factor leading to poor functional recovery in patients after stroke (10). However, very few studies have assessed the contribution to activity level of upper extremity muscle weakness on the side ipsilateral to the brain lesion. Furthermore, the existing findings are controversial. Jones et al. (14) reported that hemiplegic subjects were impaired in operating a steering wheel with their ipsilesional limb. Brodal (15) observed that his handwriting was less coordinated after a stroke in the internal capsule ipsilateral to his dominant hand. Meanwhile, Kwakkel et al. (16) found that intensive training for the arm on the side contralateral to the brain lesion did not affect the recovery of activity limitation, and they suggested that stroke patients compensated for the loss of function in the paretic arm by using the non-paretic arm during activities of daily living. Although they did not study the ipsilateral upper extremity deficit, the ipsilateral side might not relate closely to activity level.
Within the last 30 years, several investigators have studied the patterns of stroke recovery (17–22). Their results show that most recovery occurs within the first 30 days, but that improvement may continue as long as 6–12 months after stroke (23). The two best indicators of the potential for recovery from body dysfunction are the initial severity of the neurological deficits and the early patterns of improvement (22–24). Patients who experience early and quick changes in motor function generally achieve a much higher level of maximum recovery (22–24). Although there is some controversy, recovery from upper extremity paresis resulting from stroke is related to improvements in activity level (e.g. dressing, bathing, toileting) and ultimately to a reduction in the limitations in participation level (e.g. return to work, participation in society) (14–16, 25).
Despite the impact on activity level that muscle weakness may have on both the sides contralateral and ipsilateral to the brain lesion after stroke, little is known about the recovery patterns of muscle weakness in both upper extremities. It is still difficult to predict the extent or duration of body dysfunctions and activity limitation in patients after stroke. Goodwin & Sunderland (26) investigated the recovery pattern of upper extremity movement deficit on the side contralateral to the brain lesion and found that a logarithmic function was fitted to the recovery curves of the deficit of upper extremity movement. Meanwhile, Koyama et al. (27) examined the validity and applicability of logarithmic modelling using the Functional Independence Measure (FIM) (28) for predicting functional recovery of stroke patients with hemiparesis. A predictive model based on logarithmic regression can easily be scaled to fit each individual’s magnitude of recovery. Although body dysfunctions, such as impaired muscle strength and activity limitation as indicated by FIM score are different components, body dysfunction related to the upper extremities is closely related to activity limitation (25). If the prediction of recovery of upper extremity strengths on both sides and activity limitation in post-stroke patients with hemiparesis might be clarified by a simple logarithmic regression model, then this knowledge can help clinicians, patients and patients’ families to understand the prognosis for body dysfunction and activity limitation (4). In addition, accurate prediction facilitates proper definition of goals of intervention for individual patients, thus improving the quality and efficacy of rehabilitation services (29). For providers of services and for those paying for it, accurate prediction enables effective use of resources by allowing better estimation of such factors as length of hospitalization (30). Thus, accurate prediction of recovery from both upper extremity muscle weakness and activity limitation could provide important information.
Therefore, we conducted a longitudinal study to investigate the recovery patterns of bilateral upper extremity muscle strength and activity limitation, and to predict the recovery of strengths and activity limitation early after stroke using a logarithmic regression model. According to previous studies of functional recovery after stroke (17–27), we hypothesized that: (i) recoveries of upper extremity strength and activity limitation could be predicted by a logarithmic regression model; (ii) the time course for both strength and activity limitation would show similar logarithmic patterns; and (iii) body dysfunction in both upper extremities would induce lower independence levels for daily living. To our knowledge, this is the first study to demonstrate by mathematical modelling predictive values for recovery of bilateral muscle strength after stroke.
METHODS
Subjects
Eligibility criteria were as follows: first-ever stroke, hemiparesis (weakness and clumsiness on one side of the body), absence of severe consciousness disorder (eyes opening spontaneously and obeying commands), ability to sit up with a backrest for more than 30 min, a period of less than 2 weeks since the stroke event, absence of severe cardiorespiratory insufficiency, no history of dementia and neuromuscular disease, and willingness to participate in the study. All patients received conventional arm and leg rehabilitation training and activities of daily living training in conformance with Japanese guidelines for stroke rehabilitation (31) for 5 days per week by an occupational therapist and physical therapist. The study was approved by the Kawasaki Municipal Tama Hospital Institutional Committee on Human Research. Informed consent was obtained from each patient before his or her participation in the study. This study was performed in accordance with the Declaration of Helsinki 1975, as revised in 1983.
Between 5 January 2007, and 17 September 2008, 21 patients after stroke from the Department of Rehabilitation Medicine of Kawasaki Municipal Tama Hospital were enrolled in the study. The characteristics of the patients who met the inclusion criteria are presented in Table I. The mean age of participants was 73.5 years (SD 11.8).
| Table I. Baseline characteristics of the study group |
| Characteristics | |
| Participants, n | 21 |
| Age, years, mean (SD) | 73.5 (11.8) |
| Sex, n | |
| Males | 10 |
| Females | 11 |
| Diagnosis, n | |
| Infarction | 17 |
| Haemorrhage | 4 |
| Days post-stroke at assessment, mean (SD) | 7.1 (3.5) |
| Paralysis side, n | |
| Right | 17 |
| Left | 4 |
| Grip strength, kg, mean (SD) | |
| Paretic side | 7.6 (9.2) |
| Non-paretic side | 16.3 (8.7) |
| Elbow flexor strength, Nm, mean (SD) | |
| Paretic side | 12.1 (13.7) |
| Non-paretic side | 23.5 (14.1) |
| Elbow extensor strength, Nm, mean (SD) | |
| Paretic side | 9.6 (10.1) |
| Non-paretic side | 18.1 (9.7) |
| FIM motor item score, median (IQR) | 34 (23–70) |
| FIM: Functional Independence Measure; IQR: interquartile range; SD: standard deviation. |
Muscle strength measurement
Bilateral elbow flexion and extension strengths were separately assessed with a hand-held dynamometer (μTas MT-1, ANIMA, Japan). The dynamometer pad measures 55 × 55 mm, and its front side is curved to fit the shape of the areas to be measured on the extremities. The measurement range of this dynamometer is 0.1–999.9 Newtons (N), with a recording interval of 0.1 N. The hand-held dynamometer can be used to quantify maximal strength and may offer several advantages, including ease of transport, time efficiency, and low cost. The intraclass correlation coefficient (ICC), used to characterize the reliability of the strength tests using a hand-held dynamometer, ranged from 0.84 to 0.99, which is considered good (32, 33). The hand-held dynamometer provides a reliable and valid means of measuring muscle strength in patients with brain damage (34, 35).
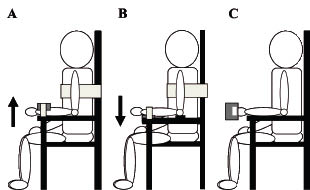
Subjects were seated in a hard chair with an armrest and high backrest, and a belt was applied around the upper trunk to prevent movement of the body (Fig. 1). The tested arm was held in a vertical position beside the body, with the elbow flexed and the forearm placed horizontally on the armrest. For elbow flexor assessment, the dynamometer was placed ventrally just proximal to the styloid process, whereas for the elbow extensor assessment, it was placed dorsally. During tests, the subject’s forearm and the dynamometer were fixed to the armrest by a belt to keep the joint in position. Prior to testing, the arm was guided in the appropriate direction in accordance with the testing protocol to familiarize the subject with the feeling of pushing against the dynamometer. Bilateral muscle strength was then assessed with the hand-held dynamometer. The strength of each subject was measured twice by an examiner, separated by a 3-minute interval, and the higher strength value was used as the strength value. Subjects were asked to press against the dynamometer pad gradually up to their maximum voluntary effort. They then maintained maximum effort for additional 5 s. Throughout the session, each subject was given consistent verbal encouragement. The limb selected to start the testing was chosen randomly. Torque (Nm) was determined by multiplying force (N) times forearm length (m). In addition, a Jamar dynamometer (Sammons-Preston, Bolingbrook, IL, USA) was used to evaluate grip strength. The reliability of the Jamar dynamometer is well documented (36). The subject’s arms were adducted at their sides with their elbows at 90º, and the dynamometer handle was set at position 2. Subjects were asked to squeeze the handle as forcefully as possible for 3–5 s. Bilateral strength measurements were carried out on 4 occasions: first within 2 weeks from onset of stroke (baseline assessment) and then at 1 week (second set of assessments), 2 weeks (third set of assessments) and 3 weeks (fourth set of assessments) after the baseline assessment.
Fig. 1. Muscle strength measurement. (A) Elbow flexion and (B) extension strengths for both the sides contralateral and ipsilateral to the brain lesion were assessed with a hand-held dynamometer. For elbow flexor assessment, the dynamometer was placed ventrally just proximal to the styloid process, whereas for the elbow extensor, was placed dorsally. Subjects were asked to press forcefully against the dynamometer pad. Arrows indicate the direction of pressing. (C) A Jamar dynamometer was used to evaluate grip strength. Subjects were asked to squeeze the handle forcefully.
Activity measurement
Activity limitation was evaluated according to the FIM motor items (28). The FIM motor score was chosen because of its widespread use at rehabilitation facilities and ease of scoring. Motor FIM involves the following items: self-care – eating, grooming, bathing, dressing the upper body, dressing the lower body, toileting; sphincter control – bladder management and bowel management; mobility – transferring to bed/chair/wheelchair, transferring to toilet, transferring to tub/shower; and locomotion – walking or wheelchair propulsion, stair climbing. Each item is graded on a 7-point scale: 1 = total assistance; 2 = maximal assistance; 3 = moderate assistance; 4 = minimal contact assistance; 5 = supervision or set-up; 6 = modified independence; and 7 = complete independence. The FIM motor scores can range from 0 to 91, with higher scores indicative of greater degrees of independence (28). The total sum of scores of the FIM motor items was used to assess the recovery pattern of activity limitation.
Mathematical modelling
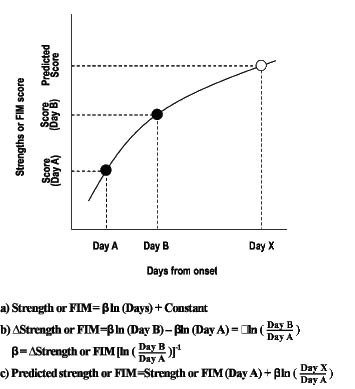
The strength scores and FIM values were regressed on the logarithm of time. A generic structure of logarithmic modelling was given in a simple natural logarithmic formula by Koyama et al. (27) (independent variable = days from onset) (Fig. 2). To tailor the generic structure to fit each patient’s degree of functional recovery, we performed calculations on the strength scores and FIM score obtained at the first 2 time-points after admission (baseline and second assessment). For each patient, the increase in strengths or FIM score between these 2 time-points (∆ strength or ∆ FIM) was used as the basis for scaling a coefficient (β) in the generic structure. Thus, using the scores at the initial 2 sampling points, a generic structure could be tailored to forecast each patient’s functional recovery (model formula shown in Fig. 2).
Fig. 2. Logarithmic modelling. A generic structure of logarithmic modelling was given in a simple natural logarithmic formula (independent variable = days from onset). FIM: Functional Independence Measure; ln: natural logarithm. ∆FIM indicates change in FIM scores between Day A and Day B. X can be calculated with this form.
Statistical analysis
Two-way repeated measures analysis of variance (ANOVA) was performed to compare differences in strength between sides (contralateral and ipsilateral to the brain lesion) and time (4 time assessments), whereas Friedman’s test was performed on the FIM score. For post-hoc analysis, differences in strengths were analysed by Dunett’s test and FIM scores by the Wilcoxon signed-rank test. Bilateral strength measurements were normalized using linear transformation, and the data were expressed as a Z score (37) to clarify the difference in bilateral strengths. Moreover, correlation of the recovery pattern of strengths and that of FIM score were examined by Spearman’s rank correlation coefficient to assess the relation between body dysfunctions and activity limitation.
To assess the fit of the time course of the model, the strengths and FIM score were, on an individual basis, plotted longitudinally with predicted values for each patient derived from the model formula. To assess the general applicability of logarithmic modelling, a conventional linear regression analysis using data from all patients was performed to compare the strengths and FIM scores that were actually obtained (from the third and fourth assessments) with the predicted values that were derived from the model formula. A p-value < 0.05 was considered statistically significant. All statistical procedures were carried out with PASW software (IBM, New York, USA).
RESULTS
Profile of recovery of bilateral muscle strength and activity
Time-series plots of both muscle strength and FIM data for a representative subject are shown in Fig. 3. For this subject, strengths and FIM score have been regressed on the logarithm of time. The pattern of increase in the predicted values that were derived from the logarithmic model formula was similar to both the strengths and FIM score that were actually obtained and was so close, in fact, that the correspondence of elbow flexor strengths on the side contralateral to the brain lesion was almost identical. For this subject, however, the predicted values overestimated the obtained grip strength on the side contralateral to the brain lesion, both in elbow extensor strength and FIM score. In contrast, the predicted values slightly underestimated the grip and elbow flexor strengths obtained on the side ipsilateral to the brain lesion.
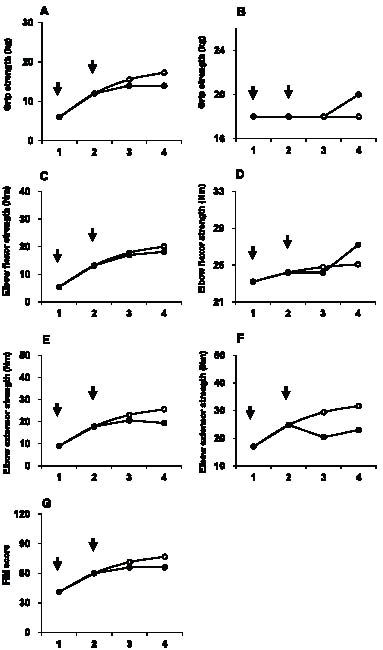
Fig. 3. Time course of actual and predicted strengths and Functional Independence Measure (FIM) score from a representative subject. Plots of grip strength on (A) the paretic side and (B) the non-paretic side, (C) elbow flexor strength on the paretic side and (D) non-paretic side, and (E) elbow extensor strength on the paretic side and (F) non-paretic side are shown. Arrows indicate the initial two sampling time-points to tailor the logarithmic model for each subject. ●: actual value; ○: predicted value for the logarithmic model. (G) The pattern of increase in the predicted values that were derived from the logarithmic model formula was similar and close to both the strengths and FIM scores that were actually obtained.
The characteristic patterns of changes in strength measures of the upper extremities of all 21 subjects are shown in Table II and Fig. 4. The time course for both strengths and activity limitation showed similar logarithmic patterns. Two-way ANOVA with repeated measures on sample time-points showed that the interaction effect of strength between the paretic and non-paretic sides was not significant in grip and elbow flexion and extension strength (grip strength: F3,60 = 0.819, p = 0.488; elbow flexor strength on the paretic side: F3,60 = 2.674, p = 0.055; elbow extensor strength: F3,60 = 0.700, p = 0.556). However, ANOVAs of time showed a significant main effect (grip strength on the paretic side: F3,60 = 4.45, p = 0.007; grip strength on the non-paretic side: F3,60 = 11.11, p < 0.0001; elbow flexor strength on the paretic side: F3,60 = 7.51, p < 0.0001; elbow flexor strength on the non-paretic side: F3,60 = 6.98, p < 0.0001; elbow extensor strength on the paretic side: F3,60 = 4.483, p = 0.007; elbow extensor strength on the non-paretic side: F3,60 = 4.45, p = 0.007). Muscle strength after the second or third assessment significantly increased in comparison with baseline strength. The changes in normalized strengths (Z score) of the paretic and non-paretic sides were similar (Fig. 2B, D and F). The FIM score was also significantly increased over the 4 assessment occasions (Friedman’s test, p < 0.0001; Fig. 5). The Wilcoxon signed-rank test showed that the FIM score significantly increased in comparison with the baseline FIM score.
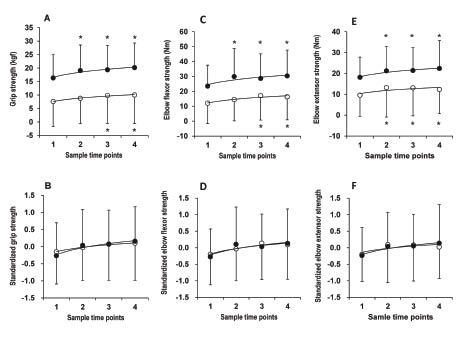
Fig. 4. Changes in upper extremity strengths. The characteristic patterns of changes in (A) actual grip strength, (B) normalized grip strength, (C) actual elbow flexor strength, (D) normalized elbow flexor strength, (E) actual elbow extensor strength, and (F) normalized elbow extensor strength are shown. ●: non-paretic side; ○: paretic side; *p < 0.05 in Dunnett’s test. Data are shown as mean and SD. The time course for both strengths and activity levels showed similar logarithmic patterns (grip strength: F3,60 = 0.819, p = 0.488; elbow flexor strength on the paretic side: F3,60 = 2.674, p = 0.055; elbow extensor strength: F3,60 = 0.700, p = 0.556). ANOVAs of time showed a significant main effect (grip strength on the paretic side: F3,60 = 4.45, p = 0.007; grip strength on the non-paretic side: F3,60 = 11.11, p < 0.0001; elbow flexor strength on the paretic side: F3,60 = 7.51, p < 0.0001; elbow flexor strength on the non-paretic side: F3,60 = 6.98, p < 0.0001; elbow extensor strength on the paretic side: F3,60 = 4.483, p = 0.007; elbow extensor strength on the non-paretic side: F3,60 = 4.45, p = 0.007). Dunnett’s post-hoc test showed muscle strength after the second, third or fourth set of assessments to be significantly increased in comparison with baseline strength (grip strength on the paretic side: third set, p = 0.012, fourth set, p = 0.005; grip strength on the non-paretic side: second set, p = 0.001, third set, p <0.0001, fourth set, p < 0.0001; elbow flexor strength on the paretic side, third set, p < 0.0001, fourth set, p = 0.001; elbow flexor strength on the non-paretic side, second set, p = 0.001, third set, p = 0.009, fourth set, p < 0.0001; elbow extensor strength on the paretic side, second set, p = 0.006, third set, p = 0.008, fourth set, p = 0.046; elbow extensor strength on the non-paretic side, second set, p = 0.038, third set, p = 0.027, fourth set, p = 0.003).
Correlation coefficients (r) between upper extremity muscle strength on the side contralateral to the brain lesion and motor FIM score were higher than the correlation coefficients between strengths on the side ipsilateral to the brain lesion and motor FIM score (Spearman’s rank correlation coefficients, grip strength on the paretic side, r = 0.741, p < 0.0001; grip strength on the non-paretic side, r = 0.419, p < 0.0001; elbow flexor strength on the paretic side, r = 0.676, p < 0.0001; elbow flexor strength on the non-paretic side, r = 0.316, p = 0.003; elbow extensor strength on the paretic side, r = 0.612, p < 0.0001; elbow extensor strength on the non-paretic side, r = 0.338, p = 0.002).
Assessment of model fit
For each individual, the pattern of increase in the predicted values that were derived from the logarithmic model formula was similar to the strengths and FIM scores that were actually obtained: so close, in fact, that model fit was assessed using group data. Regression analysis comparing actual data and predicted values from all 21 subjects revealed that the model formula accurately predicted the obtained strengths. The correlation coefficient (r) and R2 values between the actual and predicted strengths for the third set of assessments were high under a logarithmic regression model (Table II and Fig. 5), as were the correlation coefficient (r) and R2 values for the fourth set of assessments (Table II and Fig. 6). Similarly, the correlation coefficient (r) and R2 values between the actual and predicted FIM score for both the third and fourth set of assessments (Table II and Fig. 7) were also high for a logarithmic regression model.
| Table II. Profile of recovery on bilateral muscle weakness and disability |
| | Sample time-points | | Model fit |
| | Third set of assessments | | Fourth set of assessments |
| 1 | 2 | 3 | 4 | | r | R2 | p | | r | R2 | p |
| Grip strength, kg, mean (SD) | | | | | | | | | | | | |
| Paretic side | 7.6 (9.2) | 8.8 (9.4) | 9.8 (10.4) | 10.0 (10.6) | | 0.955 | 0.912 | < 0.0001 | | 0.971 | 0.944 | < 0.0001 |
| Non-paretic side | 16.3 (8.7) | 19.1 (9.5) | 19.4 (9.0) | 20.2 (9.1) | | 0.926 | 0.857 | < 0.0001 | | 0.913 | 0.834 | < 0.0001 |
| Elbow flexor strength, Nm, mean (SD) | | | | | | | | | | | | |
| Paretic side | 12.1 (13.7) | 14.5 (14.4) | 17.1 (16.3) | 16.3 (15.5) | | 0.976 | 0.953 | < 0.0001 | | 0.951 | 0.904 | < 0.0001 |
| Non-paretic side | 23.5 (14.1) | 29.9 (18.7) | 28.7 (16.4) | 30.4 (17.4) | | 0.908 | 0.825 | < 0.0001 | | 0.811 | 0.657 | < 0.0001 |
| Elbow extensor strength, Nm, mean (SD) | | | | | | | | | | | | |
| Paretic side | 9.6 (10.1) | 13.2 (14.1) | 13.1 (13.4) | 12.3 (11.7) | | 0.944 | 0.892 | < 0.001 | | 0.948 | 0.899 | < 0.001 |
| Non-paretic side | 18.1 (9.7) | 21.3 (11.8) | 21.4 (10.9) | 22.4 (13.3) | | 0.871 | 0.745 | < 0.0001 | | 0.901 | 0.812 | < 0.0001 |
| FIM motor item score, median (IQR) | 34 (23–70) | 36 (28–66) | 47 (34–72) | 50 (37–75) | | 0.885 | 0.783 | < 0.0001 | | 0.890 | 0.793 | < 0.0001 |
| FIM: Functional Independence Measure; IQR: interquartile range; SD: standard deviation. |
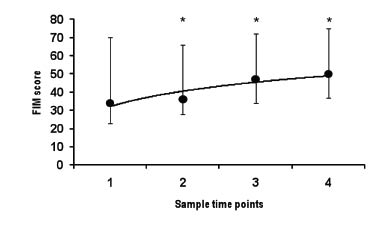
Fig. 5. Changes in Functional Independence Measure (FIM) score. Data are shown as median and quartile values. *p < 0.05 in the Wilcoxon signed-rank test. The FIM score was also significantly increased over the 4 sets of time assessments (Friedman’s test, p < 0.0001). The Wilcoxon signed-rank test showed that the FIM score significantly increased in comparison with the baseline FIM score (second set, p = 0.019; third set, p < 0.0001; fourth set, p < 0.0001).
Fig. 6. Scatterplots showing the relation between actual strengths and predicted strengths. Grip strength on (A) the paretic side and (B) the non-paretic side at the third set of assessments. Grip strength on (C) the paretic side and (D) the non-paretic side at the fourth set of assessments. Elbow flexor strength on (E) the paretic side and (F) the non-paretic side at the third set of assessments. Elbow flexor strength on (G) the paretic side and (H) the non-paretic side at the fourth set of assessments. Elbow extensor strength on (I) the paretic side and (J) the non-paretic side at the third set of assessments. Elbow extensor strength on (K) the paretic side and (L) the non-paretic side at the fourth set of assessments. The correlation coefficient (r) and R2 values between the actual and predicted strengths were high under a logarithmic regression model for the third and fourth assessments (grip strength on the paretic side: third set, r = 0.955, R2 = 0.912, p < 0.0001; fourth set, r = 0.971, R2 = 0.944, p < 0.0001; grip strength on the non-paretic side: third set, r = 0.926, R2 = 0.857, p < 0.0001; fourth set, r = 0.913, R2 = 0.834, p < 0.0001; elbow flexor strength on the paretic side: third set, r = 0.976, R2 = 0.953, p < 0.0001; fourth set, r = 0.951, R2 = 0.904, p < 0.0001; elbow flexor strength on the non-paretic side: third set, r = 0.908, R2 = 0.825, p < 0.0001; fourth set, r = 0.811, R2 = 0.657, p < 0.0001; elbow extensor strength on the paretic side: third set, r = 0.944, R2 = 0.892, p < 0.001; fourth set, r = 0.948, R2 = 0.899, p < 0.001; elbow extensor strength on the non-paretic side: third set, r = 0.871, R2 = 0.745, p < 0.0001; fourth set, r = 0.901, R2 = 0.812, p < 0.0001).
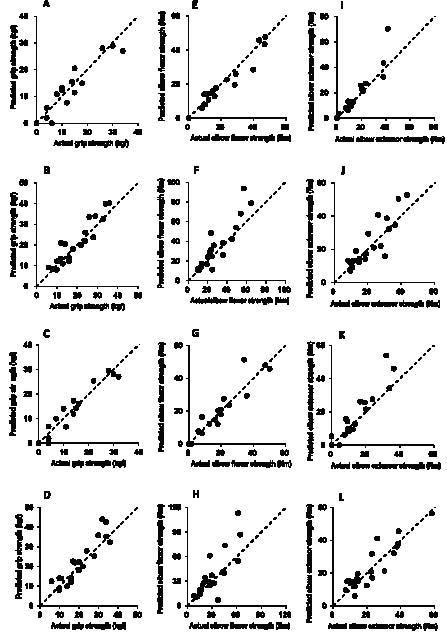
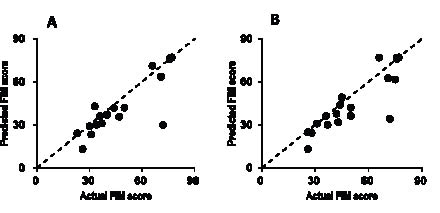
Fig. 7. Scatterplots showing the relation between the actual Functional Independence Measure (FIM) score and the predicted FIM score. (A) Predicted and actual FIM score at the third set of assessments. (B) Predicted and actual FIM score at the fourth set of assessments. The correlation coefficient (r) and R2 values between the actual and predicted FIM scores for the third and fourth assessments were high for a logarithmic regression model (third set, r = 0.885, R2 = 0.783, p < 0.0001; fourth set, r = 0.890, R2 = 0.793, p < 0.0001).
DISCUSSION
In the present study, recoveries of both upper extremity muscle strength on the sides contralateral and ipsilateral to the brain lesion and activity limitation early after stroke were predicted by a logarithmic regression model. Our results indicated that: (i) the time course of recovery for both upper extremities resembled a logarithmic function; (ii) the time course for recovery of both muscle strength and activity limitation showed similar logarithmic patterns; and (iii) body dysfunction in both upper extremities induced lower independence levels for daily living. However, upper extremity dysfunction on the side contralateral to the brain lesion affected activity limitation more than did that on the ipsilateral side.
Various mathematical models and other methods have been used to predict functional recovery (38–42). In particular, the natural logarithmic function (ln) has 3 advantages for modelling functional recovery (27). First, the progress curves resemble actual recovery patterns. Stroke patients typically show non-linear recovery patterns (43). In general, motor dysfunction and activity limitation show rapid recovery during the acute phase and reach a plateau or level off after several months following onset (27, 44). Secondly, based on scores sampled on 2 separate days, using simple mathematical procedures, the modelling formula can easily be scaled to fit each individual’s magnitude of recovery. Thirdly, owing to mathematical specificity of logarithms, the model formula can easily be calculated. Accordingly, any pair of periodic samplings is suitable for defining the coefficient (β) of the model formula. The flexibility of the model formula enables easy re-estimation if predictive and actual values deviate. This simplicity and flexibility means that the model formula is suitable for clinical applications. Goodwin & Sunderland (26) investigated the recovery pattern of active range and maximum velocity of wrist extension on the side contralateral to the brain lesion. They found a logarithmic function could be fitted to the data to produce recovery curves of wrist extension movement. Koyama et al. (27) examined the validity and applicability of logarithmic modelling for predicting the recovery of activity limitation after stroke. Their results show that the predicted values using logarithmic modelling enable powerful and accurate prediction of activity limitation. An additional new observation in our study was that the time course of recovery of bilateral upper extremity muscle strength and activity limitation resembled a logarithmic function. These results suggested that the model formula based on the logarithmic function could be a useful tool for predicting both strengths and activity limitation of stroke patients with hemiparesis. Thus, we believe that our results add to the knowledge of predicting recovery of body dysfunction and activity limitation after stroke provided by the Goodwin & Sunderland (26) and Koyama et al. (27) reports.
Because a unilateral cortical lesion can disrupt processing at multiple levels of the neural mechanisms, both muscle weakness on the sides contralateral and ipsilateral to the brain lesion that we observed is likely to have a complex explanation that involves multiple, interrelated neural mechanisms. One mechanism is that the deficits in ipsilesional limb movements might reflect the extent to which one hemisphere, and even the primary motor cortex, exerts bilateral descending control over distal movements (9, 45). Although some corticospinal fibres (descending on either side of the cord) cross at a spinal level, both ipsilaterally and contralaterally descending fibres may terminate in the ipsilateral grey matter (10). However, there is less information on the terminations of ipsilateral trajectories of corticospinal fibres. Another possible mechanism for the deficits in ipsilateral limb movements is that damage to one hemisphere may alter callosal signals and disrupt neural processing in the opposite hemisphere. There is evidence that the transcallosal connection between primary motor cortices is mainly inhibitory (46), such that activity in the M1 of one hemisphere inhibits activity in the other hemisphere. Thus the level of inhibition in M1 in the non-stroke hemisphere appears to be changed by the removal of callosal input. In addition to these possible mechanisms, immobility after stroke and weight loss from malnutrition due to swallowing and nutritional difficulties also may influence the deficits in ipsilateral limb movements (12, 13). Our study noted that the time courses for body dysfunctions and activity limitation show similar logarithmic patterns, and body dysfunction in both upper extremities induces lower independence levels for daily living. However, the correlation between upper extremity muscle strength on the side contralateral to the brain lesion and activity level was more significant than that between strength on the side ipsilateral to the brain lesion and activity level in our study. In a single-blind randomized controlled trial, Kwakkel et al. (16) investigated the effects of different degrees of arm and leg rehabilitation on the functional recovery of activity limitation. They found no differences in activity levels between the arm-training group and control group, and they suggested that stroke patients compensated for the loss of function in the paretic arm by using the non-paretic arm during activities of daily living. This implies the possibility that patients with severe body dysfunction within the unilateral upper extremity reach nearly full independence by using the opposite extremity. In marked contrast to the findings of the previously published study by Kwakkel et al., in the present study, body dysfunction of the upper extremity on the side contralateral to the brain lesion related closely to activity level. However, very few studies have assessed the contribution of body dysfunction on the side ipsilateral to the brain lesion to activity level. Therefore, further research is needed to investigate the relation between deficits of limb movements on the side ipsilateral to the brain lesion and learning to the use that arm to compensate for the weakness of the paretic arm in the process of gaining independence in the activities of daily living.
The size and location of the stroke, as assessed by computed tomography or magnetic resonance imaging, can give information about motor prognosis (47). In recent years, the possibility of transcranial magnetic stimulation (TMS) to directly investigate motor pathways after stroke has been exploited by many authors looking for both the possibility of predicting motor outcomes and for a better understanding of the recovery process in the central nervous system. In particular motor-evoked potentials by TMS are reported to give early information about residual integrity of the corticospinal tract with major specificity for clinical evaluation in the acute phase when the presence of oedema and diaschisis phenomena accounts for more severe motor conditions initially (48). However, Kwakkel et al. (49) reviewed the literature for studies on predictors of functional outcome after stroke and found major evidence for age, previous stroke, urinary continence, consciousness at onset, disorientation in time and place, severity of paralysis, sitting balance, admission activity limitation, level of social support and cerebral metabolism. Therefore, further research is needed to develop a more sensitive method for prediction of both strength and activity limitation based on a logarithmic model combined with brain images, motor-evoked potentials, demographic data, and coexisting body dysfunctions such as consciousness at onset and sitting balance.
The relationship between paretic lower extremity strength on the contralateral side and gait ability after a stroke has been investigated in many studies (5, 50). However, very few studies have assessed the contribution of lower extremity muscle strength on the ipsilateral side to gait performance. Future studies are needed to assess the relationship between lower extremity strengths on both the sides contralateral and ipsilateral to the brain lesion and gait performance in subjects with post-stroke hemiparesis.
Limitations
There are several limitations to this study. First, the sample size was small. Because of this, the study did not examine other covariates, such as age, consciousness at onset, and cognition. Therefore, a larger number of participants will be needed in future studies to investigate the relationship between recovery of bilateral muscle strength and activity limitation and other important covariates. With the addition of a detailed examination classifying participants by their covariates, and the inclusion of a large number of patients, the results of our study would be more generally applicable. Secondly, a logarithmic model might be useful even at earlier stages of illness and during shorter periods of hospitalization, but the recovery of bilateral upper extremity muscle strength over longer periods after stroke remains unclear. Therefore, further studies are needed to determine the applicability to strength data collected at later phases of the condition.
In conclusion, we investigated the recovery patterns of upper extremity muscle strength on both the sides contralateral and ipsilateral to the brain lesion and activity level early after stroke. Bilateral strength and activity limitation improved significantly in a similar pattern of change. Moreover, the recovery of both strength and activity limitation could be predicted accurately by a logarithmic regression model. However, although body dysfunction in both upper extremities induces lower independence levels for daily living, the upper extremity on the side contralateral to the brain lesion affected activity level more than did that on the ipsilateral side. Understanding recovery patterns of both limb muscle strength on the sides contralateral and ipsilateral to the brain lesion and activity limitation could be useful for improving the quality and efficacy of rehabilitation services, designing therapeutic strategies, and planning clinical research studies to evaluate the effectiveness of therapeutic interventions.
ACKNOWLEDGEMENTS
The authors would like to acknowledge Yukiko Kimizuka, Megumi Miyamoto, Seiko Sugano, Shotaro Sasaki, and Masami Suzuki for their general support in this study.
REFERENCES