OBJECTIVE: To review the development of Rasch analysis by examining the history of its application to the Functional Independence Measure (FIMTM), and highlighting current issues in the approach.
METHODS: All Rasch-based papers concerning the FIMTM were reviewed for their analytical strategy and results. Four analytical pathways were identified that accommodated the majority of these strategies. Data derived from secondary analysis of 340 in-patients undergoing rehabilitation following stroke, measured on the FIMTM Motor Scale, were fitted to the Rasch measurement model according to these 4 pathways, with 2 additional pathways to accommodate recent developments.
RESULTS: In the analytical pathway, where items are not re-scored, the fit to the Partial Credit parameterization was better than the Rating Scale version. Fit improved following re-scoring of disordered thresholds. When local dependency was accommodated by 4 testlets, the Partial Credit, re-scored testlet version achieved adequate summary fit with no misfit among items, and unidimensionality. All other pathways required item deletion.
CONCLUSION: The current study has shown that the FIMTM Motor Scale, as applied to a stroke rehabilitation sample, satisfies Rasch model expectations and the unidimensionality assumptions, having accommodated local dependency issues, and by using the partial credit parameterization with re-scored categories. Other analytical pathways gave less ideal solutions, and are consistent with the wide range of solutions found for the scale over the years. Consequently, the development of the Rasch approach in health outcomes can be traced in the history of analysis of the FIMTM, and that development continues to this day.
Key words: outcome assessment; patient; physiopathology; psychometrics; Rasch; Functional Independence Measure
J Rehabil Med 2011; 43: 884–891
Correspondence address: Åsa Lundgren Nilsson, University of Gothenburg, Institute of Neuroscience and Physiology, Department of Clinical Neuroscience and Rehabilitation, Per Dubbsgatan 14, 413 45 Göteborg, Sweden
Submitted July 12, 2010; accepted June 23, 2011
*This article has been fully handled by one of the Associate Editors, who has made the decision for acceptance, as it originates from the institute where the Editor-in-Chief is active.
INTRODUCTION
It is 50 years since Georg Rasch published his mathematical model, which has come to play such an important part in modern psychometric applications to health outcomes (1). While some early notable examples of such applications can be found (2–4), the real expansion of the method came with a series of seminal papers on the application of the Rasch model in rehabilitation outcomes in the late 1980s and early 1990s (5, 6). Since that time there has been a steady growth in the use of the approach, and one scale, the Functional Independence Measure (FIMTM), has been at the forefront of this development (7). The first publication bringing together the Rasch model and the FIMTM was in 1993, from a team from the Chicago MESA Psychometric Laboratory, the Rehabilitation Institute of Chicago, and the FIMTM developers at Buffalo, USA, led by Carl Granger. This work had been presented a year earlier at an outcomes meeting hosted by Granger in Buffalo. It was at this time that the two-domain FIMTM concept was introduced, with motor and cognitive components, discovered by the application of Rasch analysis (8). This involves taking data from a scale such as the FIMTM, and determining whether the pattern of responses accord with the Rasch model expectation, which is a probabilistic form of Guttman Scaling (9). This pattern of response has some very special properties that support the construction of fundamental measurement (10, 11). Thus, it is possible, when data satisfy the Rasch model expectations, to transform ordinal data, of the kind derived from the FIMTM, into interval scale measurement (5). The original version of the Rasch model was for dichotomous data (1), but, in the polytomous case, which is relevant for a scale like the FIM™, two different parameterizations were subsequently developed; the Rating Scale version (RS) (12) and the Partial Credit (PC) version (13). The principal difference between these two is the assumption of a common rating scale structure across all items in the former (the RS). This means that while the distances between any two response options within an item may differ (that is inter-threshold distance), those distances remain the same across all items. In the latter (PC), the inter-threshold distances may vary within and across items; that is, each item has its own rating scale structure.
Since the original Rasch-FIMTM paper, more than 50 further papers have been published applying data from the FIMTM to the Rasch model and these represent a wide variety of analytical practices. The first 5 and the most recent 5 papers are shown in Table I. All the relevant papers and references are shown in an expanded Table SI (available from: http://www.medicaljournals.se/jrm/content/?doi=10.2340/16501977-0871).
A whole series of currently relevant issues with respect to Rasch analysis can be traced through this work. For example, one issue is whether or not the FIM™ should be analysed by the RS or PC parameterizations. Another issue is that of disordered thresholds. This is where the transition between categories does not follow an increase in the underlying trait being measured. In the case of the FIM™ Motor Scale, where an increase in the response category is expected to imply an increase in the level of independence in motor activity, a disordered threshold occurs when the transition between, for example, categories 2 and 3 represents a higher level of independence than the transition between categories 3 and 4. Clearly, this is not how the scale was intended to work, and breaches the monotonicity assumption of the Rasch model; that is, the response level should increase as the level of the underlying trait increases.
Unidimensionality is another issue that is critical to Rasch analysis, as this is one of its assumptions (and most item response theory (IRT) models) (72). To add a set of item scores together the basic requirement is that they form a unidimensional scale (73). Historically, the assessment of unidimensionality within the Rasch framework has not been treated in a consistent manner, as the understanding of the unidimensionality has developed over the years. Early papers may not have raised the issue of unidimensionality, or may simply have assumed that fit to the Rasch model meant that the scale was unidimensional (5, 74).
More recently, attention has also been given to the local independence assumption. The assumption of local independence is an “umbrella” term, which incorporates two concepts described by Marias & Andrich as “response” and “trait” dependency (75), and implies that after the “Rasch construct” has been extracted, there should be no left-over (residual) association between items. In response dependency, items are chained together in some fashion; for example, 3 items asking about the distance walked. If someone can walk the farthest distance unaided, they must be able to walk all lesser distances. Consequently, these items are locally independent, and they artificially inflate reliability, and influence parameter estimates (75). Trait dependency is multi-dimensionality. Most FIMTM Rasch-based articles will not have addressed the issue of response dependency in any detail. It is identified by residual correlations, in the current example over 0.2, and it is dealt with by creating “testlets”, which are simple summary scores from the set of locally dependent items, making the set into one new “super” item (76, 77).
Another issue that has seen increasing application within the Rasch framework has been the concept of differential item functioning (DIF) (78). This occurs when, at the same level of motor ability, the response to a particular item differs by group, for example males and females. Different strategies have been used to identify DIF, partly reflecting the historical development of the various Rasch analytical packages, with emphasis switching from a primarily graphical interpretation of DIF, to those based upon statistical tests of the patterns of residuals (14, 66).
Deleting items, particularly from an existing published scale, should be considered a last resort for a variety of reasons. For example, some items may be important in the context of clinical management (see below), while the evidence for the validity of the scale will have included all items, and thus the revised scale would need to be re-validated. Nevertheless, over the years, different solutions have been obtained for the FIMTM Motor Scale that have involved the removal of certain items; for example, those concerned with sphincter control (23). The researcher’s choice of which items to remove has been based largely upon one of many fit statistics, which show whether data from the item accords with the model expectations. The interpretation of fit statistics is an area that perhaps has the greatest potential for variation in practice and is partly driven by the difference in fit statistics in the different software packages.
Finally, the sample size required for Rasch analysis has always been an issue. This can be based upon the degree of precision required for the item calibration. For example, Linacre reports that a minimum sample size of 243 subjects is required to provide accurate estimates of item difficulty where item calibrations are stable to within 0.5 logits with 99% confidence, irrespective of the targeting of the sample to the items (79). Sample size can be much smaller when subjects are well targeted to the scale (e.g. 108 for perfect targeting). However, in high stakes setting, which would be consistent, for example, with assessments influencing or contributing to clinical diagnosis, a minimum sample size of 250 is required, or 20 times the number of items, whichever is greater (79). This would mean that the FIM motor scale would require 260 cases at a minimum, if the intended use was for individual patient assessment.
Thus, in the published papers on the FIM™ using Rasch analysis to-date, almost every combination of analytical approach and sample size has been used (Table I). Early papers tended to be relatively straightforward, concentrating solely on individual item fit and little else. The first paper to examine DIF of any kind was published in 1993 (5); the first to test unidimensionality in any manner was also published in 1993 (15); the first to examine cross-cultural DIF was published in 1995 (20); the first paper to examine disordered thresholds was published in 1996 (23). Sample sizes have varied from 30 to 93,827 (22, 45). Solutions have varied, from those in which all items are retained, to where various items have been deleted, for example the sphincter control items (23, 56). The current paper is the first to examine the FIMTM Motor Scale by using the notion of testlets to adjust for local dependency (77).
| Table I. Rasch-based papers for the Functional Independence Measure (FIMTM) |
| Author, year (reference) | Sample | Number of cases | Measures | Model | Thresholds | Re-scored | Local dependency | DIF | Person fit | Item fit | Unidimensionality | Items deleted |
| Granger et al., 1993 (14) | Mi, O | 27,669 | T, M, C | NS | NS | NS | NS | Yes | NS | NS | NS | NS |
| Heinemann et al., 1993 (15) | Mi, O | 27,669 | T, M, C | NS | NS | NS | NS | Yes | NS | Yes | Yes | NS |
| Heinemann et al., 1994 (16) | Mi, O | 27,669 | M, C | RS | NS | NS | NS | Yes | NS | Yes | Yes | NS |
| Linacre et al., 1994 (8) | Mi | 14,799 | T, M, C | NS | NS | NS | NS | NS | NS | Yes | NS | NS |
| Cowen et al., 1995 (17) | Mi, O | 45 + 2,324 | M, C | RS | NS | NS | NS | NS | NS | NS | NS | NS |
| Johnston et al., 2006 (67) | TBI | 231 | FIM + Other | RS | Yes | NS | NS | NS | Yes | Yes | Yes | Yes |
| Cantagallo et al., 2006 (68) | TBI | 160 | M, C | RS | Yes | Yes | NS | Yes | NS | Yes | Yes | Yes |
| New et al., 2007 (69) | SCI | 70 | M, C | NS | NS | NS | NS | NS | NS | NS | NS | NS |
| Velozo et al., 2007 (70) | Mi | 236 | M | NS | NS | NS | NS | NS | Yes | NS | NS | NS |
| Tur et al., 2009 (71) | O | 134 | M, C | PC | Yes | Yes | Yes | Yes | NS | Yes | Yes | No |
| DIF: differential item functioning; Mi: mixed/other neurological disorders; O: other; TBI: traumatic brain injury; SCI: spinal cord injury; T: total; M: motor; C: cognitive; NS: not stated; RS: Rating Scale; PC: Partial Credit. |
METHODS
Data from the FIMTM Motor Scale, based upon secondary analysis of 340 in-patients undergoing rehabilitation following stroke, was fitted to the Rasch model (51). The data were collected by persons trained and accredited by the Uniform Data System (Buffalo, USA).
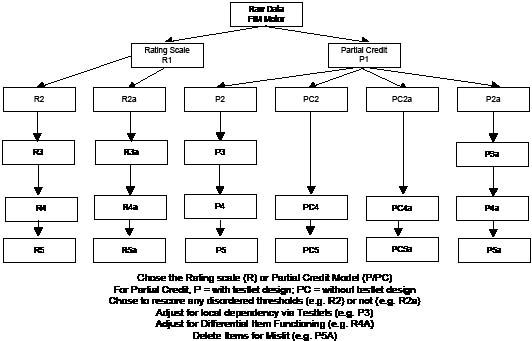
Further details of the process of Rasch analysis are now available in a number of publications (80–83). Briefly, we examined the category ordering of items (thresholds), local response dependency, fit of items, DIF and unidimensionality. Ideal values for these various aspects are given at the foot of the summary fit table. The analytical strategy is presented in Fig. 1, which indicates that a number of key choices can be made, for example, using the RS or PC parameterizations; re-scoring disordered thresholds or not. Consequently, there are 4 major pathways of analysis based upon these choices. In addition, for historical comparative purposes, the partial credit pathway was further disaggregated to provide one that ignores local (response) dependency and the associated testlet procedures; consequently, results are presented for 6 analytical pathways.
Fig. 1. Current study analytical strategies. FIM: Functional Indefendence Measure; DIF: differential item functioning.
The RUMM2030 programme (84) was used for the Rasch analysis in the present study.
RESULTS
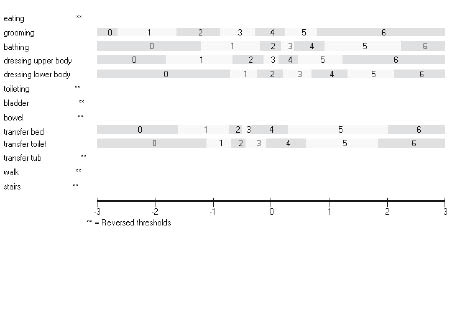
The distribution of responses to the 13 items of the FIMTM Motor Scale is shown in Table II. There are 3 items with 1 or more categories with less than 10 responses. A log-likelihood ratio test (available in RUMM2030) was used to determine if the assumptions of the rating scale version of the polytomous model hold. This indicated that the partial credit version of the polytomous model (called the unrestricted model in RUMM2030) was appropriate. Fig. 2 shows the threshold map for the 13 items under the partial credit parameterization. Two aspects are of note. First, some of the items do not appear in the diagram, as they have disordered thresholds. Secondly, where they do appear, the distances between thresholds vary both within and across items; for example, the width of category 5 is different across items. This is consistent with a failure of the rating scale assumption that such distances be the same across items.
| Table II. Frequency distribution of responses to Functional Independence Measure (FIMTM) Motor Scale |
| Item | Item name | Cat 1 | Cat 2 | Cat 3 | Cat 4 | Cat 5 | Cat 6 | Cat 7 |
| 1 | Eating | 3 | 21 | 23 | 40 | 142 | 45 | 44 |
| 2 | Grooming | 36 | 34 | 52 | 57 | 47 | 45 | 47 |
| 3 | Bathing | 97 | 65 | 51 | 36 | 19 | 32 | 18 |
| 4 | Dress upper | 71 | 57 | 55 | 42 | 20 | 38 | 35 |
| 5 | Dress lower | 117 | 59 | 40 | 41 | 20 | 23 | 18 |
| 6 | Toileting | 142 | 37 | 31 | 28 | 15 | 40 | 25 |
| 7 | Bladder | 80 | 28 | 23 | 20 | 39 | 40 | 88 |
| 8 | Bowel | 57 | 19 | 17 | 22 | 43 | 71 | 89 |
| 9 | Transfer bed | 70 | 49 | 39 | 45 | 32 | 57 | 26 |
| 10 | Transfer toilet | 89 | 37 | 47 | 46 | 23 | 52 | 24 |
| 11 | Transfer tub | 185 | 35 | 24 | 20 | 21 | 25 | 8 |
| 12 | Walk | 135 | 30 | 24 | 27 | 37 | 47 | 18 |
| 13 | Stairs | 230 | 7 | 14 | 15 | 19 | 28 | 5 |
| Cat: category. |
Fig. 2. Threshold map for Partial Credit model. In RUMM 2030 categories starts from 0 and ends with 6 instead of 1 to 7 as in the original FIMTM.
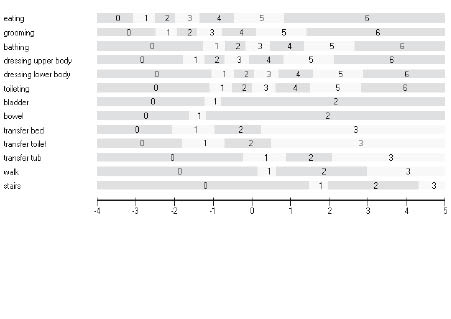
Fit to the model under the 6 analytical pathways is shown in Table III. In the pathway where items are not re-scored (NR), the fit of the PC parameterization (P2a) was somewhat better than the RS version (R2a). In particular, the standard deviation of the item residuals was worse in the latter, the χ2 value was much worse, and 11 items (out of 13) were flagged as misfitting compared with 8 items. Much the same patterns emerged when disordered thresholds were re-scored (R), but generally fit improved, and considerably so with PC-R (P2) where the number of misfit items had fallen to 5. For the rating scale analytical pathways, re-scoring allowed for different rating scale patterns within the 4 underlying domains of self-care, sphincter control, transfer and mobility (Fig. 3). In the PC model, 6 items retained the original structure of 7 categories, 1 item was reduced to 6 and another to 5 categories, and 5 items were reduced to 4 categories.
| Table III. Fit of the Functional Independence Measure Motor Scale items to the Rasch model |
| Analysis | Stream | Item fit residual Mean (SD) | Person fit residual Mean (SD) | χ2 interaction | PSI | Unidimensionality | Misfit itemsb | Items remaining (within testlets) |
| Value | DF | p | % tests | CI |
| PC-NR | P2a | –0.546 (2.773) | –0.306 (1.09) | 195.35 | 52 | < 0.0001 | 0.965 | 12.35 | 10.0–14.7 | 8 | 13 |
| PC-R | P2 | –0.692 (2.511) | –0.426 (1.137) | 146.09 | 52 | < 0.0001 | 0.964 | 11.76 | 9.4–14.1 | 5 | 13 |
| RS-NR | R2a | –0.887 (2.901) | –0.317 (1.152) | 345.16 | 52 | < 0.0001 | 0.964 | 12.06 | 9.7–14.4 | 8 | 13 |
| RS-R | R2 | –1.013 (3.105) | –0.346 (1.004) | 344.98 | 52 | < 0.0001 | 0.953 | 6.76 | 4.5–9.1 | 7 | 13 |
| RS-NR-T | R3a | –0.764 (1.892) | –0.398 (–0.874) | 24.35 | 16 | 0.0639 | 0.933 | 3.82 | 1.5–6.1 | 1 | (13) |
| RS-R-T | R3 | –0.905 (2.668) | –0.380 (0.818) | 26.385 | 16 | 0.0488 | 0.946 | 4.71 | 2.4–7.0 | 1 | (13) |
| PC-NR-T | P3a | –0.712 (1.812) | –0.377 (0.870) | 24.13 | 16 | 0.0866 | 0.934 | 3.53 | 1.2–5.8 | 1 | (13) |
| PC-R-T | P3/P5 | –0.304 (1.35) | –0.362 (0.851) | 23.26 | 16 | 0.1070 | 0.941 | 5.29 | 3.0–7.6 | 0 | (13) |
| RS-R-ID | R5 | –0.547 (1.590) | –0.318 (0.874) | 43.50 | 36 | 0.182 | 0.945 | 4.41 | 2.1–6.7 | 1a | 9 |
| RS-NR-T-ID | R5a | –0.100 (2.792) | –0.249 (0.742) | 20.932 | 12 | 0.051 | 0.842 | 2.65 | 0.3–5.0 | 1a | (10) |
| PC-R-ID | PC5 | –0.386 (1.593) | –0.359 (0.984) | 41.439 | 36 | 0.245 | 0.954 | 6.76 | 4.4–9.1 | 1a | 9 |
| PC-NR-ID | PC5a | –0.414 (1.433) | –0.363 (0.886) | 42.145 | 24 | 0.0124 | 0.941 | 3.82 | 1.5–6.1 | 0 | 6 |
| PC-NR-T-ID | P5a | –0.885 (2.387) | –0.344 (0.733) | 17.464 | 12 | 0.133 | 0.901 | 0.88 | –1.4–3.2 | 0 | (10) |
| aMarginally high negative fit residual, reflecting redundancy (local dependence). bA detailed list of the misfit items are shown in Table SII (available from: http://www.medicaljournals.se/jrm/content/?doi=10.2340/16501977- 0871). PC: Partial Credit; NR: not re-scored; RS: Rating Scale; T: testlet; R: re-scored; ID: item deletion; SD: standard deviation; DF: degrees of freedom; PSI: person separation index; CI: confidence interval. |
Fig. 3. Ordered thresholds under the Rating Scale model (with 4 groups of items sharing the same rating structure). Self-care; item 1–6, Sphincter control; item 7 and 8, Transfers; item 9–11, Locomotion; item 12 and 13. Categories start from 0 and not 1 as in the original FIMTM.
An examination of the residual correlation matrix highlighted that considerable local dependency existed in the data. This appeared to cluster within the 4 underlying domains of the FIMTM Motor Scale; that is, “self-care” (6 items); “sphincter control” (2 items); “mobility” (3 items) and “locomotion” (2 items). Consequently, the items from these underlying domains were made into 4 testlets, and the analysis repeated. This significantly improved fit and, as expected (because of local dependency), reduced reliability. However, the PC-R testlet analytical pathway (P3) achieved adequate summary fit with no misfit among items (subtests), whereas the rating scale pathways retained individual item misfit. Consequently, for P3, where the unidimensionality test showed the lower confidence interval for the number of significant tests to overlap 5%, an optimal solution was found for the FIM™ Motor Scale, retaining all items, adequate fit, and supporting all assumptions.
Examination of potential DIF by age and gender found no significant DIF (R4–P4 stream), and thus no adjustment was necessary. As PC-R-Testlet (P3) achieved adequate fit, this analytical pathway did not require moving to item deletion (P5). However, all other pathways displayed some misfit, and as such required further investigation and removal of items (R5–P5 stream). Indeed, the R5-A solution, that is the un-re-scored rating scale, was far from satisfactory, and it is easy to see how concerns about dimensionality, and removal of blocks of items would have come about using this analytical strategy.
DISCUSSION
The FIMTM has, over the years, provided a fertile ground for the development of the Rasch analysis in health outcomes. Almost every strategy that could be employed has been utilized, and Table I highlights that these have led to a wide variety of solutions for the motor scale, including a variable number of final items. Many of these solutions have been replicated in this analysis of a single data-set.
A number of issues and insights are raised by this analysis. The first is concerned with the choice of polytomous parameterization. The current study suggests that when the rating scale parameterization is chosen a priori, when the assumptions for the parameterization are not met, it will increase misfit and lead to unnecessary item deletion. Thus a priori-led choices about the use of the rating scale formulation may lead to erroneous conclusions about the internal construct (structural) validity of a scale.
The next issue is that of disordered thresholds. In this example, many items had disordered thresholds. Where order was achieved through collapsing categories, fit was much improved compared with the same analysis where disordered thresholds were ignored. Generally speaking, the analytical pathways where thresholds were left disordered resulted in fewer items being retained. Again, historically disordered thresholds have been treated differently; sometimes they are ignored altogether, other times the categories are collapsed to ensure proper ordering (51). The collapsing of categories is something that has been raised in many Rasch papers on the FIMTM over the years, and remains an open debate to this day (58). While the use of testlets has steadily increased in educational applications, its use has been limited to-date in health outcome assessment (77). Thus, one of the most important recent changes in the Rasch analysis has come about through the introduction of testlets as a mechanism to deal with local dependence. In the current example, the use of testlets in the re-scored PC stream resulted in maintaining the integrity of the entire motor scale. This has the advantage of retaining the clinical utility of the scale (clinimetric) for rehabilitation management, while at the same time satisfying modern (psychometric) measurement standards (85). An example of this is the 3 transfer items; these are flagged up as been highly local dependent in the analysis, but for clinical decision making these 3 items are of great importance. How much help is needed and when? There is a great difference in staff time spent with patients dependent on help in the transfer toileting situation, compared with transfer to a bath/shower, and this can influence the decision about discharge. Thus, these individual items are clinically important, yet can potentially bias parameter estimates, including fit, if not made into a single higher order item represented by a testlet. Thus, an increased understanding of the influence of local dependency upon fit and dimensionality derived from the current analysis suggests that the majority of misfit previously reported for the FIMTM Motor Scale may have been attributable to the effects of local dependency.
Local dependency can be considered to include both response dependency and multidimensionality (75). Traditionally, the test of the unidimensionality assumption has been dealt with independently, although in practice the two are related. Given that the Rasch model assumes unidimensionality it is now understood that this must either be determined a priori or, in most recent cases, post hoc, by looking at the pattern in residuals. For example, in RUMM2030, a test has been added recently following recommendations by Smith (86). This involves comparing, by a t-test, two estimates based upon different sets of items identified as loading at opposite ends of the first principal component of the residuals. This has been shown to be robust in identifying multidimensionality, although, as with all procedures, there are issues of power when relatively few items (thresholds) are involved in the comparison (87). In WINSTEPS, the first residual contrast of a principal component is a key element in determining unidimensionality. The WINSTEPS manual identifies that this should have a value < 2 to support the unidimensionality assumption. Recent work on simulated data-sets has suggested that, for example, some of the earlier practices of looking at residual analysis in the form of the proportion of variance observed for different factors as indicative of unidimensionality, is not very informative (87).
Although in the current analysis DIF was absent (at least on the contextual factors chosen), there are a number of issues with respect to DIF that need to be considered. Historically there has been a wide variety of strategies applied to deal with DIF, the presence of which renders comparisons between groups invalid, compromises fit, and contributes to multi-dimensionality (88). While the presence of DIF can be fully adjusted within the framework of the Rasch model (51), the potential for DIF cancellation, or even examining if DIF has a real effect upon person estimates, has led to variety of strategies for responding to the presence of DIF (89). For example, the “top down purification” approach involves identifying the “pure” set of unbiased items, and then re-entering, on a one-by-one, basis, the set aside items to determine whether they still display DIF (90). This is thought to be appropriate because some items may have displayed “compensatory” or “artificial” DIF (91). Thus, not all items may have true DIF, and this approach is designed to identify those that are. Also, it is possible for DIF to cancel out in a test; for example, where one item is biased for females, and another for males, so cancelling out the effect of the DIF (92, 93). A final solution can be to remove items showing DIF; this is used mostly when new scales are developed.
When all else fails, item deletion may be necessary, and there has been a wide variety of solutions for the motor scale. Item deletion will usually be based upon the fit indices for a given item. The fit statistics are designed to test if the observed pattern in the data approximates that expected by the model. In WINSTEPS the statistics are INFIT and OUTFIT residual mean squares, and their respective standardized values (which are interpreted as a t-distribution). The residual mean squares are often given a range, for example an INFIT mean square = 0.8–1.2 and an OUTFIT mean square = 0.6–1.4 (94, 95). However, it has been shown that the critical interval value for a 5% significance level will vary by sample size, so that the application of crude fit ranges in the presence of even medium size samples will mean that this significance level is compromised and misfit under-reported (96). Furthermore, it has been shown that such ranges are asymmetrical around the value of 1 (96). Historically a wide range of sample sizes have been reported for Rasch analyses of the FIM™ (22, 26).
In RUMM2030, fit statistics include both total χ2 probability and individual item χ2 probability values, which should be non-significant (97). More recent applications will have applied a 5% alpha with Bonferroni correction for the number of items (98). As all χ2 fit statistics are sample size dependent, this proves a challenge in the presence of large samples, as all items may show substantial misfit because of the power of the test.
In the current analysis, various levels of item deletion were necessary, depending on the analytical pathway. Sometimes there may be clear reasons for this, for example multidimensionality, but it may also be a function of constraining the data to an inappropriate parameterization, or failing to re-score.
Once a solution has been obtained, a transformation of the ordinal raw score to an interval scale measure is available, given sufficient cases. Although there is little published as yet about the sample size necessary for such a transformation, a current working solution is 250 cases or 20 times the number of items, whichever is the greater (personal communication, Mike Linacre, Winsteps.com). This gives a certain degree of precision of the estimate irrespective of the targeting of the scale. Note that this is the same sample size as for high stakes testing (79). To-date, few, if any, papers on the FIM™ have presented such a transformation, partly because most solutions have involved complex modifications to accommodate DIF and item fit and consequently a straightforward raw score-interval scale transformation for the original 13 items in their 1–7 category format has not been possible. Thus, it is perhaps the category structure which remains the principal problem with the FIM™, and the fact that, irrespective of the client group, wherever disordered thresholds are considered, one or more of the FIM™ items have to be collapsed in some fashion. As the failure to address this problem may lead to erroneous conclusions, and invalid parameter estimates, one of the last remaining tasks for the FIM™ user community is to provide a set of robust categories that appear to be consistently ordered in all settings.
In conclusion, the current study has shown that the FIMTM Motor Scale, as applied to a stroke rehabilitation sample, satisfies Rasch model expectations and the unidimensionality assumptions, having accommodated local dependency issues, and by using the partial credit parameterization with re-scored categories. No item deletion was necessary. This finding has considerable importance for the clinical setting, and supports the original concept of the FIM™ containing clinical important items. Other analytical pathways gave less ideal solutions, and are consistent with the wide range of solutions found for the scale over the years. At the time, many of these analyses might have represented state-of-the-art thinking on Rasch analysis, but some will have made a priori choices (e.g. to use the rating scale parameterization), which could not be justified by the empirical findings. Other studies may have chosen to ignore evidence about the influence of sample size on fit statistics, choosing rather to apply common ranges, irrespective of sample size. Consequently, the development of the Rasch approach in health outcomes, reflecting good and not-so-good practice can be traced in the history of analysis of the FIMTM. That development continues to this day in the quest to ensure the utility of scales for the clinical setting, while also seeking to meet the demands of fundamental measurement. As such, the findings from the current study will require replication, and a clear demonstration that they make a substantive difference to the clinical utility of the FIM™ in everyday practice.
REFERENCES