OBJECTIVE: To determine whether the International Classification of Functioning, Disability and Health (ICF) model is adequate for assessing disability patterns in stroke survivors in the sub-acute rehabilitation setting in terms of potential changes in functional profiles over time.
METHODS: Functional profiles of 197 stroke patients were assessed using the ICF Checklist and the Functional Independence Measure (FIMTM) at admission and discharge from rehabilitation hospital. The ICF Checklist was applied based on medical documentation and rehabilitation team meetings. Descriptive analyses were performed to identify changes in ICF categories and qualifiers from admission to discharge, and correlations between different improvement measures were calculated.
RESULTS: Mean rehabilitation duration was 60 days; patients’ mean age was 60 years, with mean FIM-score 75 at admission. Mean FIM-score improvement at discharge was 12.5. Within Body Functions, changes in at least 10% of patients were found regarding 13 categories; no categories within Body Structures, 24 within Activities and Participation, and 2 within Environmental Factors. Changes were mostly due to improvement in qualifiers, except for within Environmental Factors, where they were due to use of additional categories. Correlations between improvements in Body Functions and Activities and Participation (regarding capacity and performance), as well as between capacity and performance within Activities and Participation, were approximately 0.4.
CONCLUSION: Rating ICF categories with qualifiers enables the detection of changes in functional profiles of stroke patients who underwent an inpatient rehabilitation programme.
Key words: disability evaluation; rehabilitation; stroke; ICF; outcome.
J Rehabil Med 2011: 43: 590–601
Correspondence address: Nika Goljar, University Rehabilitation Institute, Republic of Slovenia, Linhartova 51, SI-1000 Ljubljana, Slovenia. E-mail: nika.goljar@ir-rs.si
Submitted December 24, 2010; accepted April 28, 2011
INTRODUCTION
Stroke survivors face long-term consequences that are usually complex and heterogeneous and may affect physical, emotional and social aspects of life (1). Functioning of the patient is the main concern in the rehabilitation process. Its measurement is therefore essential for effective patient care; for example, assessment of patient problems, setting of rehabilitation goals, choosing rehabilitation interventions and evaluation of intervention outcomes (2–4).
The International Classification of Functioning, Disability and Health (ICF) (5) supports understanding functioning and disability as multidimensional concepts that relate not only to physical and psychological features, but also to a person’s life situation and social role, which is influenced by external factors such as the physical environment, physical aids and appliances, societal attitudes and beliefs, and policies.
To facilitate the use of the ICF in clinical encounters, the World Health Organization (WHO) developed the ICF Checklist, which makes it possible to generate a profile of the patient using a restricted set of ICF categories (6). In addition, the clinical feasibility of the ICF has been facilitated through development of the ICF Core Sets (7–9), which have been developed for several chronic health conditions including stroke (9, 10). The ICF has become a framework for selection of an appropriate combination of outcome measures (11–14) or a useful tool for developing comprehensive measures (15–17). It was also found that implementation of the ICF in rehabilitation settings improves the quality of interdisciplinary work process (18–20) and contributes to goal setting (21). For describing patterns of disability, the ICF has so far been used in stroke survivors (22–25) and in patients with some other chronic conditions (26–33). The results of those studies enlarge the perspective of disability in different groups of people with chronic health conditions by considering symptoms of the disease together with activities and the role of environmental factors. However, none of the published studies on stroke patients used the ICF for demonstrating changes over time.
Although the ICF is primarily a framework and classification system rather than a tool for measurement, the description of functioning involves rating of ICF categories with the ICF qualifiers to estimate the severity of the problem. The ICF qualifiers can be useful as a direct measurement of human functioning, since the health professional assigning them integrates all the accessible and relevant information from the patient history, clinical examinations and technical assessment, in order to code a specified category according to the established coding guidelines (34, 35). Presenting the extent of problems and resources with the use of ICF qualifiers enables all team members to judge the extent of problems, facilitators or barriers even in areas of functioning where they are not specialists (36). Even though changes in patients’ functional profiles over time have so far been studied only through indirect use of the ICF, which served as the basis for in-depth interviews (37), the use of qualifiers shoud also be able to indicate the changes in patients’ functional profiles over time.
In the Measuring Health and Disability in Europe (MHADIE) project, a multi-centre longitudinal study of patients on 13 different health conditions was conducted. One of the objectives of the project was to show that the ICF model is adequate for describing and measuring patterns of disability in clinical samples of selected conditions over time. Within this context, the aim of this paper is to report the results of time-changes in functional profile of stroke patients as assessed by the extended ICF Checklist in a sample of stroke patients who concluded the rehabilitation programme in a post-acute rehabilitation setting.
MATERIALS AND METHODS
The MHADIE study design was longitudinal, with 3 evaluation time-points; baseline, 6 weeks and 3 months, except for stroke, where the third evaluation was performed at discharge from rehabilitation setting and second evaluation was not performed if the patient was discharged in less than 6 weeks. The results presented here refer to the evaluation of stroke patients at admission and discharge.
Participants
Patients were enrolled consecutively at the Stroke Rehabilitation Department of the University Rehabilitation Institute (URI) in Ljubljana, Slovenia, between September, 2005, and February, 2007. All patients underwent the standard multidisciplinary rehabilitation programme, which includes medical care, rehabilitation nursing, physiotherapy, occupational therapy, psychological assessment and support, social counselling and speech therapy on daily basis, as well as orthotic treatment and provision of assistive technology when appropriate.
In addition to a stroke diagnosis according to International Classification of Diseases (ICD-10), the inclusion criteria were: age at least 18 years; being medically stable (afebrile, with stable vital signs, without important changes in medical conditions or required changes in treatments within 48 hours prior to the interview, with neurological deficits unchanged or improving, being able to take adequate nutrition orally or having an enteral route for nutrition and hydration established); having at least two persistent disabilities (among mobility, performance of basic activities of daily living, bowel or bladder control, cognition, emotional functioning, pain management, swallowing and communication); mental status from normal or minimal deficit to moderate deficit; and having enough physical fitness to sit in a wheelchair for at least 1 h a day and to participate actively in rehabilitation. In total, 197 patients were enrolled. All patients completed the study.
The MHADIE project was approved by the EU ethics committee, and the presented study was approved by the ethics committee of the URI.
Procedures
Socio-demographic characteristics were collected using a common protocol across the MHADIE project, which is consistent with the one used by the WHO. Comorbidity was recorded according to ICD-10, and assessment with the Functional Independence Measure (FIM) (38) was performed. Baseline assessment was performed within 3 days of admission; discharge assessment was performed on the day of or the day before discharge.
The ICF Checklist (39), which represents a selection of only 128 categories from the whole ICF system, was applied to admission and discharge status of the patient. Its structure is identical to the ICF, whereby the Checklist contains 32 categories from the Body Functions component (i.e. approximately 25% of all Body Functions categories), 16 (29%) from Body Structures, 48 (41%) from Activities and Participation and 32 (43%) from the Environmental Factors component. Within the MHADIE project, 9 additional categories were applied (4 from Body Functions – b250, b460, b555 and b720; 4 from Body Structures – s220, s320, s570 and s580; and 1 from Environmental Factors – e165) in accordance with the specifics of the health conditions addressed by the project.
Each category was assessed using the ICF qualifiers, i.e. on a 5-point ordinal scale from 0 (no impairment) to 4 (complete impairment) with 2 additional possible values (8 for not specified, and 9 for not applicable). In addition, Body Structures categories were assessed with 2 different qualifiers (1 for nature of the change and l for location of the change, but we do not report these data because of lesser relevance and space constraints); Activities and Participation categories were assessed with 2 qualifiers, i.e. in terms of capacity (c) and performance (p); for Environmental Factors categories, ordinary qualifier values denote barriers, while qualifiers preceded by a plus sign denote facilitators. Within the ICF, capacity is defined as describing an individual’s ability to execute a task or an action, thus aiming to indicate the highest probable level of functioning that a person may reach in a given domain at a given moment, i.e. reflecting the environmentally adjusted ability of the individual (5); while performance is defined as describing what an individual does in his or her current environment, thus referring to the actual experience of people in the actual context in which they live (5).
Coding rules
Evaluation was carried out by a trained researcher on the basis of medical documentation and information obtained during rehabilitation team meetings, whereby all ICF domains were evaluated taking into account all the available information. The ICF Checklist was administered taking into account all the main ICF areas. MHADIE researchers completed the ICF Checklist following the Disability Italian Network’s coding rules (40). This implies that each ICF category has to be considered first in terms of its relevance and applicability for each single patient; in a second step, if the category is considered relevant for the patient, available information on the extent of the problem is evaluated and qualifiers 0–4 are applied; if no adequate information on the extent of an actual problem is available, qualifier 8 (not specified) is applied. If the ICF category is considered not applicable to the patient, qualifier 9 (not applicable) is applied.
Wherever no information was available at all, the corresponding ICF category was left blank, and the category was considered missing. When necessary, other ICF categories were added to the standard ICF Checklist to complement the functional profile with all the relevant information.
Statistical analysis
Frequencies at admission and discharge were tabulated for all the variables studied and percentages of changed, improved and worsened qualifiers at discharge were calculated, as well as percentages of ICF categories introduced at discharge. FIM scores at admission and discharge were compared using exact Wilcoxon matched-pairs test.
Two types of improvement measures were defined. For FIM, differences in score between discharge and admission were calculated for the total score and both sub-scores. For the 4 ICF components (considering capacity and performance separately within Activities and Participation), improvement score was computed as the number of categories where the qualifier decreased minus the number of categories where the qualifier increased, whereby qualifier 8 was considered as equivalent to 1. For Environmental Factors, the computation was reversed for barriers and the sub-scores for facilitators and barriers were added to obtain an overall score for the component.
Pearson correlations among the improvement measures were then estimated. Statistical significance level was set at α = 0.01 in order to eschew type I errors due to multiple tests and spurious significance due to outliers.
RESULTS
A total of 197 patients (mean age 60 years, range 21–82, median 61 years; 123 males) entered the study. The fact that approximately two-thirds of the participants were men reflects the gender structure of stroke patients in Slovenia (41). The mean duration of rehabilitation programme was 60 days (range 7–364, median 57 days). The mean time from the onset of stroke to the admission to rehabilitation was 5 months (range 1–26, median 4 months). The stroke was the first one ever for 86.8% of the patients. Cerebral infarction was the most frequent main diagnosis (69.4%), followed by intracerebral haemorrhage (19.7%). Aphasia was present in 18.3% of the patients. Additional diagnoses were present in 56.3% of the patients, the most frequent being arterial hypertension (representing 24.6% of all additional diagnoses and being present in 58.6% of the patients with at least one additional diagnosis). Further information on socio-demographic characteristics, risk factors, causes of stroke and co-morbidity was given in a previous article from the MHADIE project (25).
FIM scores at admission (maximum possible is 126) ranged from 19 to 120 (standard deviation (SD) 25.3) with a mean of 73.5 (median 73), whereby the motor sub-score (maximum possible is 91) ranged from 14 to 89 (SD 21.3) with a mean of 49.9 (median 49), and cognitive sub-score (maximum possible is 35) ranged from 5 to 35 (SD 6.4) with a mean of 23.6 (median 25). At discharge, mean total, motor and cognitive FIM (sub-)scores improved to 86.0 (SD 24.0), 60.8 (SD 19.8) and 25.2 (SD 6.0), respectively (p < 0.001 for all 3 comparisons). Therefore, the mean improvement in total, motor and cognitive FIM (sub-)score was 12.5 (SD 10.5), 10.9 (SD 9.8) and 1.6 (SD 2.2) points, respectively.
ICF categories with changed qualifiers (i.e. improved, worsened or newly introduced) from admission to discharge from the inpatient rehabilitation programme are presented in Tables I–IV for the Body Functions, Body Structures, Activities and Participation and Environmental Factors component, respectively. In at least one-tenth of patients (shown in bold in the tables), changes occurred in 13 categories among Body Functions, none in Body Structures, in 24 categories among Activities and Participation, and in 2 categories among Environmental Factors. Changes were mostly due to improvement in terms of the qualifiers, except in Environmental Factors where they were due to introduction of new categories at discharge assessment.
| Table I. Changes in the International Classification of Functioning, Disability and Health Body Functions categories from admission to discharge (qualifiers/categories changed in at least 10% of the patients are in bold) |
| Category | Admission n (%) | Discharge n (%) | Unchanged % | Improved % | Worsened % | Introduced % | |
| b1. MENTAL FUNCTIONS |
| b110 | Consciousness | 196 (99.5) | 197 (100) | 99.5 | | | 0.5 | |
| b114 | Orientation (time, place, person) | 197 (100) | 197 (100) | 100 | | | | |
| b117 | Intellectual (incl. retardation, dementia) | 5 (2.5) | 7 (3.6) | 99.0 | | | 1.0 | |
| b126 | Temperament and personality | 10 (5.1) | 11 (5.6) | 99.0 | | 0.5 | 0.5 | |
| b130 | Energy and drive functions | 73 (37.1) | 85 (43.1) | 90.4 | 1.5 | 2.0 | 6.1 | |
| b134 | Sleep | 37 (18.8) | 36 (18.3) | 95.9 | 0.5 | 1.0 | 1.0 | |
| b140 | Attention | 84 (42.6) | 99 (50.3) | 88.8 | 2.0 | 1.5 | 7.6 | |
| b144 | Memory | 197 (100) | 197 (100) | 87.3 | 12.2 | 0.5 | | |
| b147 | Psychomotor functions | 84 (42.6) | 93 (47.2) | 93.4 | 0.5 | 0.5 | 5.1 | |
| b152 | Emotional functions | 116 (58.9) | 121 (61.4) | 86.8 | 7.1 | 2.5 | 3.0 | |
| b156 | Perceptual functions | 18 (9.1) | 22 (11.2) | 97.5 | | 0.5 | 2.0 | |
| b160 | Thought functions | 20 (10.2) | 20 (10.2) | 95.4 | | 0.5 | 2.0 | |
| b164 | Higher level cognitive functions | 64 (32.5) | 76 (38.6) | 92.4 | 0.5 | | 6.6 | |
| b167 | Language | 83 (42.1) | 84 (42.6) | 98.0 | 0.5 | | 1.0 | |
| b172 | Calculation functions | 6 (3.0) | 8 (4.1) | 99.0 | | | 1.0 | | |
| b176 | Sequencing complex movements | 19 (9.6) | 12 (6.1) | 94.4 | | 1.0 | 0.5 | | |
| b180 | Experience of self and time function | 9 (4.6) | 10 (5.1) | 98.5 | | | 1.0 | | |
| b2. SENSORY FUNCTIONS AND PAIN |
| b210 | Seeing | 137 (69.5) | 140 (71.1) | 94.9 | | 1.5 | 2.5 | | |
| b215 | Function of structures adjoining the eye | 7 (3.6) | 7 (3.6) | 98.0 | | | 1.0 | | |
| b230 | Hearing | 47 (23.9) | 44 (22.3) | 98.5 | | | | | |
| b235 | Vestibular (incl. Balance functions) | 33 (16.8) | 35 (17.8) | 99.0 | | | 1.0 | | |
| b240 | Sensations associated with hearing and vestibular function | 12 (6.1) | 12 (6.1) | 99.0 | 0.5 | 0.5 | | | |
| b250 | Taste function | 2 (1.0) | 2 (1.0) | 99.0 | 1.0 | | | | |
| b255 | Smell function | 3 (1.5) | 4 (2.0) | 99.0 | 0.5 | | 0.5 | | |
| b260 | Proprioceptive function | 196 (99.5) | 197 (100) | 91.9 | 6.6 | 1.0 | 0.5 | | |
| b265 | Touch function | 197 (100) | 197 (100) | 90.9 | 8.6 | 0.5 | | | |
| b270 | Sensory functions related to temperature and other stimuli | 6 (3.0) | 6 (3.0) | 100 | | | | | |
| b280 | Pain | 196 (99.5) | 197 (100) | 77.2 | 17.8 | 4.6 | 0.5 | | |
| Table 1. contd. | | | | | | | |
| Category | Admission n (%) | Discharge n (%) | Unchanged % | Improved % | Worsened % | Introduced % | |
| b3. VOICE AND SPEECH FUNCTIONS |
| b310 | Voice | 29 (14.7) | 29 (14.7) | 97.5 | | 0.5 | 1.0 | | |
| b320 | Articulation functions | 48 (24.4) | 47 (23.9) | 94.9 | 2.0 | 1.5 | 0.5 | | |
| b330 | Fluency and rhythm of speech functions | 30 (15.2) | 31 (15.7) | 99.0 | 0.5 | | 0.5 | |
| b340 | Alternative vocalization functions | 2 (1.0) | 1 (0.5) | 99.5 | | | | |
| b4. FUNCTIONS OF THE CARDIOVASCULAR, HAEMATOLOGICAL, IMMUNOLOGICAL AND RESPIRATORY SYSTEMS |
| b410 | Heart | 197 (100) | 197 (100) | 100 | | | | |
| b415 | Blood vessel functions | 29 (14.7) | 25 (12.7) | 96.4 | 1.0 | 0.5 | | |
| b420 | Blood pressure | 197 (100) | 197 (100) | 100 | | | | |
| b430 | Haematological (blood) | 197 (100) | 197 (100) | 100 | | | | |
| b435 | Immunological (allergies, hypersensitivity) | 197 (100) | 197 (100) | 100 | | | | |
| b440 | Respiration (breathing) | 197 (100) | 197 (100) | 100 | | | | |
| b450 | Additional respiratory functions | 6 (3.0) | 5 (2.5) | 99.5 | | | | |
| b455 | Exercise tolerance functions | 121 (61.4) | 121 (61.4) | 75.1 | 21.3 | 1.5 | 1.0 | |
| b460 | Sensations associated with cardiovascular and respiratory functions | 2 (1.0) | 2 (1.0) | 100 | | | | |
| b5. FUNCTIONS OF THE DIGESTIVE, METABOLIC AND ENDOCRINE SYSTEMS |
| b510 | Ingestion functions | 45 (22.8) | 44 (22.3) | 95.9 | 3.6 | | | |
| b515 | Digestive | 1 (0.5) | 1 (0.5) | 100 | | | | |
| b525 | Defecation | 197 (100) | 197 (100) | 80.2 | 17.9 | 2.0 | | |
| b530 | Weight maintenance | 17 (8.6) | 19 (9.6) | 99.0 | | | 1.0 | |
| b535 | Sensations associated with the digestive system | 3 (1.5) | 1 (0.5) | 99.0 | | | | |
| b540 | General metabolic functions | 197 (100) | 197 (100) | 100 | | | | |
| b545 | Water, mineral and electrolyte balance functions | 6 (3.0) | 5 (2.5) | 99.5 | | | | |
| b550 | Thermoregulatory functions | 1 (0.5) | 1 (0.5) | 99.5 | | 0.5 | | |
| b555 | Endocrine glands (hormonal changes) | 2 (1.0) | 2 (1.0) | 100 | | | | |
| b6. GENITOURINARY AND REPRODUCTIVE FUNCTIONS |
| b610 | Urinary excretory functions | 4 (2.0) | 4 (2.0) | 100 | | | | |
| b620 | Urination functions | 197 (100) | 197 (100) | 79.2 | 18.8 | 2.0 | | |
| b640 | Sexual functions | 6 (3.0) | 6 (3.0) | 100 | | | | |
| b650 | Menstruation functions | 2 (1.0) | 2 (1.0) | 100 | | | | |
| b7. NEUROMUSCULOSKELETAL AND MOVEMENT RELATED FUNCTIONS |
| b710 | Mobility of joint | 196 (99.5) | 197 (100) | 85.3 | 9.6 | 4.6 | 0.5 | |
| b715 | Stability of joint functions | 28 (14.2) | 28 (14.2) | 98.5 | 0.5 | | 0.5 | |
| b730 | Muscle power | 196 (99.5) | 197 (100) | 85.8 | 13.7 | | 0.5 | |
| b735 | Muscle tone | 196 (99.5) | 196 (99.5) | 88.8 | 8.6 | 1.5 | 0.5 | |
| b740 | Muscle endurance functions | 7 (3.6) | 6 (3.0) | 99.0 | 0.5 | | | |
| b750 | Motor reflex functions | 99 (50.3) | 99 (50.3) | 96.4 | 2.5 | | 0.5 | |
| b755 | Involuntary movement reaction functions | 197 (100) | 197 (100) | 79.2 | 19.8 | 1.0 | | |
| b760 | Control of voluntary movement functions | 197 (100) | 197 (100) | 80.2 | 18.8 | 1.0 | | |
| b765 | Involuntary movements | 20 (10.2) | 25 (12.7) | 95.4 | 2.0 | | 2.5 | |
| b770 | Gait pattern functions | 177 (89.8) | 180 (91.4) | 55.3 | 39.6 | 2.5 | 2.0 | |
| b780 | Sensations related to muscles and movement functions | 1 (0.5) | 1 (0.5) | 100 | | | | |
| b8. FUNCTIONS OF THE SKIN AND RELATED STRUCTURES |
| b8 | Functions of the skin and related structures | 11 (5.6) | 11(5.6) | 98.5 | 0.5 | | 0.5 | |
| b820 | Repair functions of the skin | 1 (0.5) | 1 (0.5) | 100 | | | | |
| b830 | Other functions of the skin | 1 (0.5) | 1 (0.5) | 100 | | | | |
| Table II. Changes in the International Classification of Functioning, Disability and Health Body Structures categories from admission to discharge |
| Category | Admission n (%) | Discharge n (%) | Unchanged | Improved | Worsened | Introduced |
| s1. STRUCTURE OF THE NERVOUS SYSTEM |
| s110 | Brain | 190 (96.4) | 190 (96.4) | 100 | | | |
| s120 | Spinal cord and peripheral nerves | 3 (1.5) | 3 (1.5) | 100 | | | |
| s130 | Structure of meninges | 9 (4.6) | 10 (5.1) | 99.5 | | | 0.5 |
| s2. THE EYE, EAR AND RELATED STRUCTURES |
| s2 | The eye, ear and related structures | 1 (0.5) | 1 (0.5) | 99.0 | | | 0.5 |
| s220 | Structure of eyeball | 19 (9.6) | 21 (10.7) | 99.0 | | | 1.0 |
| s3. STRUCTURES INVOLVED IN VOICE AND SPEECH |
| s320 | Structure of mouth | 20 (10.2) | 20 (10.2) | 100 | | | |
| s4. STRUCTURE OF THE CARDIOVASCULAR, IMMUNOLOGICAL AND RESPIRATORY SYSTEMS |
| s410 | Cardiovascular system | 53 (26.9) | 55 (27.9) | 99.0 | | | 1.0 |
| s430 | Respiratory system | 4 (2.0) | 3 (1.5) | 99.5 | | | |
| s5. STRUCTURES RELATED TO THE DIGESTIVE, METABOLISM AND ENDOCRINE SYSTEMS |
| s5 | structures related to the digestive, metabolic and endocrine system | 1 (0.5) | 1 (0.5) | 100 | | | |
| s530 | Structure of stomach | 4 (2.0) | 4 (2.0) | 100 | | | |
| s560 | Structure of liver | 2 (1.0) | 2 (1.0) | 100 | | | |
| s570 | Structure of gall bladder and ducts | 1 (0.5) | 1 (0.5) | 100 | | | |
| s580 | Structure of endocrine glands | 1 (0.5) | 1 (0.5) | 100 | | | |
| s6. STRUCTURE RELATED TO GENITOURINARY AND REPRODUCTIVE SYSTEM |
| s610 | Urinary system | 7 (3.6) | 7 (3.6) | 100 | | | |
| s630 | Reproductive system | 13 (6.6) | 14 (7.1) | 99.5 | | | 0.5 |
| s698 | Structures related to the genitourinary & reproductive systems, other specified | 1 (0.5) | 1 (0.5) | 100 | | | |
| s7. STRUCTURE RELATED TO MOVEMENT |
| s710 | Head and neck region | 7 (3.6) | 4 (2.0) | 97.5 | | | 0.5 |
| s720 | Shoulder region | 70 (35.5) | 69 (35.0) | 95.9 | | 0.5 | 1.5 |
| s730 | Upper extremity (arm, hand) | 197 (100) | 197 (100) | 100 | | | |
| s740 | Pelvis | 6 (3.0) | 7 (3.6) | 99.0 | 0.5 | | 0.5 |
| s750 | Lower extremity (leg, foot) | 48 (24.4) | 52 (26.4) | 97.0 | | | 2.5 |
| s760 | Trunk | 9 (4.6) | 11 (5.6) | 99.0 | | | 1.0 |
| s8. SKIN AND RELATED STRUCTURES |
| s8 | Skin and related structures | 19 (9.6) | 21 (10.7) | 99.0 | | | 1.0 |
| s810 | Structure of areas of skin | 16 (8.1) | 15 (7.6) | 98.5 | | | 0.5 |
| Table III. Changes in the International Classification of Functioning, Disability and Health Activities and Participation categories from admission to discharge (qualifiers/categories changed in at least 10% of the patients are in bold) |
| Category | Admission n (%) | Discharge n (%) | Introduced | Capacity | Performance |
| Unchanged | Improved | Worsened | Unchanged | Improved | Worsened |
| d1. LEARNING AND APPLYING KNOWLEDGE | | | |
| d110 | Watching | 29 (14.7) | 30 (15.2) | 1.0 | 98.0 | | 0.5 | 97.5 | 1.0 | |
| d115 | Listening | 14 (7.1) | 13 (6.6) | | 99.5 | | | 99.5 | | |
| d130 | Copying | 4 (2.0) | 10 (5.1) | 3.0 | 94.9 | 2.0 | | 94.9 | 2.0 | |
| d135 | Rehearsing | 6 (3.0) | 8 (4.1) | 1.0 | 98.5 | | 0.5 | 98.5 | | 0.5 |
| d140 | Learning to read | 0 (0.0) | 1 (0.5) | 0.5 | 99.5 | | | 99.5 | | |
| d145 | Learning to write | 5 (2.5) | 9 (4.6) | 2.0 | 97.5 | | 0.5 | 97.5 | | 0.5 |
| d150 | Learning to calculate | 0 (0.0) | 2 (1.0) | 1.0 | 99.0 | | | 99.0 | | |
| d155 | Acquiring skills | 22 (11.2) | 40 (20.3) | 9.1 | 87.3 | | 3.6 | 87.8 | | 3.0 |
| d160 | Focusing attention | 59 (29.9) | 74 (37.6) | 8.1 | 86.3 | 1.0 | 4.1 | 86.3 | 2.0 | 3.0 |
| d166 | Reading | 79 (40.1) | 86 (43.7) | 5.1 | 84.3 | 5.1 | 4.1 | 84.8 | 5.6 | 3.0 |
| d170 | Writing | 68 (34.5) | 75 (38.1) | 4.1 | 85.3 | 7.6 | 2.5 | 84.8 | 8.1 | 2.5 |
| d172 | Calculating | 3 (1.5) | 3 (1.5) | 0.5 | 99.0 | | | 99.0 | | |
| d175 | Solving problems | 197 (100) | 197 (100) | | 76.1 | 23.9 | | 81.2 | 18.3 | 0.5 |
| d177 | Making decisions | 1 (0.5) | 0 (0.0) | | 99.5 | | | 99.5 | | |
| d2. GENERAL TASKS AND DEMANDS | | | |
| d210 | Undertaking a single task | 25 (12.7) | 30 (15.2) | 2.5 | 93.9 | 1.5 | 2.0 | 94.9 | 1.0 | 1.5 |
| d220 | Undertaking multiple tasks | 4 (2.0) | 3 (1.5) | | 99.0 | | 0.5 | 99.0 | | 0.5 |
| d230 | Carrying out daily routine | 15 (7.6) | 20 (10.2) | 2.5 | 95.4 | 0.5 | 1.5 | 95.4 | 0.5 | 1.5 |
| d240 | Handling stress and other psychological demands | 5 (2.5) | 6 (3.0) | 0.5 | 99.5 | | | 99.5 | | |
| d3. COMMUNICATION | | | |
| d310 | Communicating with – receiving – spoken messages | 197 (100) | 197 (100) | | 91.4 | 7.1 | 1.5 | 89.8 | 8.1 | 2.0 |
| d315 | Communicating with – receiving – non-verbal messages | 5 (2.5) | 4 (2.0) | 0.5 | 98.5 | | | 98.5 | | |
| d325 | Communicating with – receiving – written messages | 6 (3.0) | 6 (3.0) | 0.5 | 99.0 | | | 99.0 | | |
| d330 | Speaking | 196 (99.5) | 197 (100) | 0.5 | 76.6 | 21.8 | 1.0 | 78.7 | 18.3 | 2.5 |
| d335 | Producing non-verbal messages | 13 (6.6) | 12 (6.1) | 1.0 | 97.0 | 0.5 | | 97.0 | 0.5 | |
| d345 | Writing messages | 2 (1.0) | 1 (0.5) | | 99.5 | | | 99.5 | | |
| d350 | Conversation | 35 (17.8) | 33 (16.8) | 1.0 | 95.9 | 1.0 | | 95.9 | 1.0 | |
| d360 | Using communication devices and techniques | 4 (2.0) | 3 (1.5) | | 99.5 | | | 99.5 | | |
| d4. MOBILITY | | | |
| d410 | Changing basic body position | 197 (100) | 197 (100) | | 37.6 | 60.4 | 2.0 | 77.7 | 16.2 | 6.1 |
| d415 | Maintaining a body position | 197 (100) | 197 (100) | | 52.8 | 47.2 | | 57.4 | 40.1 | 2.5 |
| d420 | Transferring oneself | 42 (21.3) | 14 (7.1) | 0.5 | 79.7 | 5.1 | | 84.8 | | |
| d430 | Lifting and carrying objects | 12 (6.1) | 12 (6.1) | | 99.5 | 0.5 | | 99.5 | 0.5 | |
| d440 | Fine hand use (picking up, grasping) | 196 (99.5) | 196 (99.5) | | 91.9 | 8.1 | | 91.9 | 8.1 | |
| d445 | Hand and arm use | 197 (100) | 197 (100) | | 86.8 | 13.2 | | 88.8 | 11.2 | |
| d450 | Walking | 197 (100) | 197 (100) | | 47.2 | 50.3 | 2.5 | 34.0 | 65.5 | 0.5 |
| d455 | Moving around | 0 (0.0) | 14 (7.1) | 7.1 | 92.9 | | | 92.9 | | |
| d460 | Moving around in different locations | 197 (100) | 197 (100) | | 49.2 | 47.2 | 3.6 | 58.4 | 40.6 | 1.0 |
| d465 | Moving around using equipment (wheelchair, skates etc.) | 122 (61.9) | 115 (58.4) | 1.5 | 58.4 | 33.0 | 2.0 | 69.5 | 15.2 | 8.6 |
| d455 | Using transportation | 0 (0.0) | 2 (1.0) | 1.0 | 99.0 | | | 99.0 | | |
| d475 | Driving (riding bicycle and motorbike, driving car etc.) | 30 (15.2) | 28 (14.2) | | 97.5 | 1.0 | 0.5 | 98.0 | 1.0 | |
| Table III. Contd. |
| | | | | Capacity | Performance |
| Category | Admission n (%) | Discharge n (%) | Introduced | Unchanged | Improved | Worsened | Unchanged | Improved | Worsened |
| d5. SELF CARE | | | | | | | | | |
| d510 | Washing oneself (bathing, drying, washing hands etc.) | 197 (100) | 197 (100) | | 55.8 | 38.6 | 5.6 | 89.8 | 7.6 | 2.5 |
| d520 | Caring for body parts (brushing teeth, shaving etc.) | 197 (100) | 197 (100) | | 68.0 | 27.9 | 4.1 | 88.3 | 9.1 | 2.5 |
| d530 | Toileting | 197 (100) | 197 (100) | | 64.0 | 33.0 | 3.0 | 77.7 | 19.3 | 3.0 |
| d540 | Dressing | 197 (100) | 197 (100) | | 34.5 | 60.9 | 4.6 | 79.7 | 9.6 | 10.7 |
| d550 | Eating | 196 (99.5) | 195 (99.0) | | 82.2 | 11.2 | 6.1 | 86.8 | 11.2 | 1.5 |
| d560 | Drinking | 91 (46.2) | 91 (46.2) | 0.5 | 96.4 | 1.5 | 1.0 | 96.4 | 1.5 | 1.0 |
| d570 | Looking after one’s health | 11 (5.6) | 12 (6.1) | 0.5 | 99.0 | 0.5 | | 99.0 | | 0.5 |
| d6. DOMESTIC LIFE | | | |
| d620 | Acquisition of goods and services (shopping etc.) | 36 (18.3) | 35 (17.8) | 0.5 | 83.2 | 15.2 | | 83.8 | 14.7 | |
| d630 | Preparation of meals (cooking etc.) | 51 (25.9) | 52 (26.4) | 1.5 | 78.2 | 19.3 | | 78.2 | 19.3 | |
| d640 | Doing housework (cleaning house, washing dishes etc.) | 49 (24.9) | 49 (24.9) | 1.5 | 78.2 | 18.8 | | 76.6 | 20.3 | |
| d650 | Caring for household objects | 23 (11.7) | 29 (14.7) | 4.1 | 93.9 | 1.0 | | 93.9 | 1.0 | |
| d660 | Assisting others | 17 (8.6) | 12 (6.1) | 0.5 | 90.9 | 5.6 | | 94.9 | 1.0 | |
| d7. INTERPERSONAL INTERACTIONS AND RELATIONSHIPS | | | |
| d710 | Basic interpersonal interactions | 197 (100) | 197 (100) | | 68.5 | 31.0 | 0.5 | 78.2 | 20.8 | 1.0 |
| d720 | Complex interpersonal interactions | 39 (19.8) | 40 (20.3) | 0.5 | 97.5 | 2.0 | | 99.5 | | |
| d740 | Formal relationships | 4 (2.0) | 4 (2.0) | | 100 | | | 100 | | |
| d750 | Informal social relationships | 45 (22.8) | 47 (23.9) | 1.0 | 95.9 | 2.5 | 0.5 | 95.9 | 1.5 | 1.5 |
| d760 | Family relationships | 57 (28.9) | 57 (28.9) | | 99.0 | 0.5 | 0.5 | 98.5 | 1.0 | 0.5 |
| d770 | Intimate relationships | 22 (11.2) | 21 (10.7) | | 99.0 | | 0.5 | 99.0 | 0.5 | |
| d8. MAJOR LIFE AREAS | | | |
| d825 | Vocational training | 1 (0.5) | 1 (0.5) | | 100 | | | 100 | | |
| d830 | Higher education | 1 (0.5) | 1 (0.5) | | 100 | | | 100 | | |
| d850 | Remunerative employment | 68 (34.5) | 67 (34.0) | | 98.0 | 1.5 | | 99.0 | 0.5 | |
| d855 | Non-remunerative employment | 5 (2.5) | 6 (3.0) | 0.5 | 99.0 | 0.5 | | 99.0 | 0.5 | |
| d860 | Basic economic transactions | 2 (1.0) | 2 (1.0) | | 100 | | | 100 | | |
| d870 | Economic self-sufficiency | 3 (1.5) | 3 (1.5) | | 100 | | | 100 | | |
| d9. COMMUNITY, SOCIAL AND CIVIC LIFE | | | |
| d910 | Community Life | 19 (9.6) | 22 (11.2) | 1.5 | 97.0 | 1.5 | | 98.0 | | 0.5 |
| d920 | Recreation and leisure | 102 (51.8) | 99 (50.3) | 0.5 | 88.8 | 8.1 | 0.5 | 88.3 | 8.1 | 1.0 |
| d930 | Religion and spirituality | 13 (6.6) | 14 (7.1) | 0.5 | 98.0 | 1.0 | 0.5 | 98.0 | 1.5 | |
| d940 | Human rights | 1 (0.5) | 1 (0.5) | | 100 | | | 100 | | |
| Table IV. Changes in the International Classification of Functioning, Disability and Health (ICF)Environmental Factors categories from admission to discharge (qualifiers/categories changed in at least 10% of the patients are in bold) |
| Category | Admission n (%) | Discharge n (%) | Unchanged % | Improved % | Worsened % | Introduced, % |
| Facilitators | Barriers |
| e1. PRODUCTS AND TECHNOLOGY |
| e110 | For personal consumption (food, medicines) | 197 (100) | 197 (100) | 100 | | | | |
| e115 | For personal use in daily living | 100 (50.8) | 141 (71.6) | 77.7 | 0.5 | | 21.3 | |
| e120 | For personal indoor and outdoor mobility and transportation | 168 (85.3) | 175 (88.8) | 94.4 | 1.0 | 1.0 | 3.6 | |
| e125 | Products for communication | 115 (58.4) | 114 (57.9) | 97.5 | 0.5 | 0.5 | 0.5 | |
| e150 | Design, construct. & building products & technol. of buildings for public use | 2 (1.0) | 4 (2.0) | 99.5 | | | | 0.5 |
| e155 | Design, construct. & building products & technol. of buildings for private use | 59 (29.9) | 58 (29.4) | 96.4 | 1.5 | 1.5 | | |
| e165 | Assets | 9 (4.6) | 12 (6.1) | 98.5 | | | 1.0 | 0.5 |
| e2. NATURAL ENVIRONMENT AND HUMAN MADE CHANGES TO ENVIRONMENT |
| e225 | Climate | 9 (4.6) | 9 (4.6) | 99.0 | | | | 0.5 |
| e240 | Light | 28 (14.2) | 30 (15.2) | 99.0 | | | | 1.0 |
| e250 | Sound | 17 (8.6) | 19 (9.6) | 99.0 | | | | 1.0 |
| e260 | Air quality | 1 (0.5) | 1 (0.5) | 100 | | | | |
| e3. SUPPORT AND RELATIONSHIPS |
| e310 | Immediate family | 142 (72.1) | 147 (74.6) | 95.4 | | | 3.6 | |
| e315 | Extended family | 21 (10.7) | 18 (9.1) | 97.5 | | | 0.5 | |
| e320 | Friends | 25 (12.7) | 28 (14.2) | 96.4 | | | 2.5 | |
| e325 | Acquaintances, peers, colleagues, neighbours and community members | 14 (7.1) | 12 (6.1) | 99.0 | | | | |
| e330 | People in position of authority | 3 (1.5) | 3 (1.5) | 100 | | | | |
| e340 | Personal care providers and personal assistants | 18 (9.1) | 4 (2.0) | 92.4 | | 0.5 | | |
| e355 | Health professionals | 52 (26.4) | 197 (100) | 26.4 | | | 73.6 | |
| e360 | Other professionals | 1 (0.5) | 1 (0.5) | 100 | | | | |
| e4. ATTITUDES |
| e410 | Individual attitudes of immediate family members | 27 (13.7) | 29 (14.7) | 98.5 | 0.5 | | 0.5 | 0.5 |
| e415 | Individual attitudes of extended family members | 2 (1.0) | 2 (1.0) | 99.5 | | 0.5 | | |
| e420 | Individual attitudes of friends | 9 (4.6) | 9 (4.6) | 100 | | | | |
| e425 | Ind. att. of acquaintances, peers, colleagues, neighb. & community members | 1 (0.5) | 1 (0.5) | 100 | | | | |
| e430 | Individual attitudes of people in positions of authority | 1 (0.5) | 1 (0.5) | 100 | | | | |
| e440 | Individual attitudes of personal care providers and personal assistants | 2 (1.0) | 1 (0.5) | 100 | | | | |
| e455 | Individual attitudes of health-related professionals | 1 (0.5) | 1 (0.5) | 100 | | | | |
| E5. SERVICES, SYSTEMS AND POLICIES |
| e515 | Architecture and construction services, systems and policies | 1 (0.5) | 1 (0.5) | 100 | | | | |
| e525 | Housing services, systems and policies | 2 (1.0) | 2 (1.0) | 100 | | | | |
| e570 | Social security, services, systems and policies | 10 (5.1) | 10 (5.1) | 100 | | | | |
| e575 | General social support services, systems and policies | 9 (4.6) | 9 (4.6) | 99.0 | | | | 0.5 |
| e580 | Health services, systems and policies | 22 (11.2) | 20 (10.2) | 98.5 | | 0.5 | | |
| e585 | Education and training services, systems and policies | 1 (0.5) | 1 (0.5) | 100 | | | | |
| e590 | Labour and employment services, systems and policies | 2 (1.0) | 2 (1.0) | 100 | | | | |
Changes in Body Functions categories were the most frequent in Gait pattern functions (b770), where they were registered in more than 40% of the patients. In approximately one-fifth of the patients, changes were detected in Exercise tolerance functions (b455), Sensation of pain (b280), Involuntary movement reaction functions (b755), Control of voluntary movement functions (b760), Urination (b620) and Defecation functions (b525). As expected, very few changes were registered regarding Body Structures.
The most frequent changes within Activities and Participation were found regarding capacity. In half or more of the patients, capacity qualifiers were changed in Dressing (d540), Changing basic body position (d410), Maintaining a body position (d415), Walking (d450) and Moving around in different locations (d460). Additionally, in more than one-third of the patients, capacity qualifiers changed in Washing oneself (d510), Moving around using equipment (d465), Toileting (d530), Caring for body parts (d520) and Basic interpersonal interactions (d710).
Regarding performance qualifiers, changes were the most frequent in Walking (d450), where they were registered in more than 60% of the patients. In addition to that, changes were registered in more than one-third of the patients regarding Moving around in different locations (d460) and Maintaining a body position (d415), while changes in other categories were less frequent. Among Environmental Factors, the most frequent changes were registered regarding Products and technology for personal use in daily living (e115) and Health professionals (e355).
The number of newly introduced categories at discharge per patient is summarized by ICF component in Table V. As expected, the largest proportion of patients had at least 1 category introduced among facilitators within Environmental Factors. The next most frequent changes were observed within Activities and Participation, where approximately 40% of the patients had at least one category introduced. Within Body Functions, approximately 30% of the patients had at least one category introduced, yet the largest individual change was observed (a patient with 10 categories introduced from this component). Predictably, the number of introduced categories was the lowest within Body Structures, where change occurred in less than 10% of the patients.
| Table V. Distribution of number of categories introduced at discharge per patient, by International Classification of Functioning, Disability and Health (ICF) component |
| ICF Component | Number of categories | Frequency | Proportion |
| Body Functions (b) | 0 | 136 | 69.0 |
| | 1 | 37 | 18.8 |
| | 2 | 11 | 5.6 |
| | 3 | 6 | 3.0 |
| | 4 | 5 | 2.5 |
| | 5 | 1 | 0.5 |
| | 10 | 1 | 0.5 |
| Total introduced | 61 | 31.0 |
| Body Structures (s) | 0 | 177 | 89.8 |
| | 1 | 18 | 9.1 |
| | 2 | 2 | 1.0 |
| Total introduced | 20 | 10.2 |
| Activities and Participation (d) | 0 | 119 | 60.4 |
| | 1 | 47 | 23.9 |
| | 2 | 15 | 7.6 |
| | 3 | 10 | 5.1 |
| | 4 | 4 | 2.0 |
| | 5 | 1 | 0.5 |
| | 7 | 1 | 0.5 |
| Total introduced | 78 | 39.6 |
| Environmental Factors (e) – Facilitators | 0 | 30 | 15.2 |
| 1 | 123 | 62.4 |
| 2 | 44 | 22.3 |
| Total introduced | 167 | 84.8 |
| Environmental Factors (e) – Barriers | 0 | 189 | 95.9 |
| 1 | 7 | 3.6 |
| 2 | 1 | 0.5 |
| Total introduced | 8 | 4.1 |
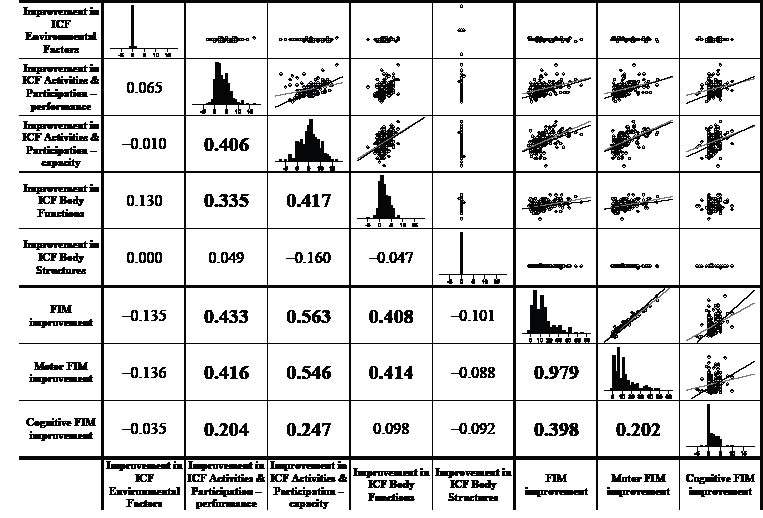
Correlations within the improvement measures are presented in Fig. 1. Three groups of significant associations can be identified: (i) within Activities and Participation (r = 0.406) and between Activities and Participation and Body Functions (r = 0.335, 0.417); (ii) of Activities and Participation (r = 0.433, 0.563, 0.416, 0.546, 0.204, 0.247) and Body Functions (r = 0.408, 0.414) with FIM; and (iii) within FIM (r = 0.979, 0.398, 0.202). Lower regression slope for aphasic patients indicating lower correlation for those patients was observed regarding association of capacity and performance within Activities and Participation, and regarding association of capacity and performance and total and motor FIM with cognitive FIM.
Fig. 1. Augmented scatter-plot matrix of improvement measures. Histograms showing the distributions are in the diagonal; the lower left part contains correlations (those statistically significant at p < 0.01 are in bold); the upper right part contains scatter-plots, where patients with aphasia are represented by black circles and patients without aphasia are represented by grey circles; for pairs of variables with statistically significant association, separate regression lines are added for patients with aphasia (black line) and patients without aphasia (grey line). The following examples facilitate interpretation: there was a significant positive correlation of improvement in ICF Body Functions with improvement in Total FIM, but not with Cognitive FIM (see cells at the intersection of rows 6 and 8 with column 4); distribution of improvement in ICF Activities & Participation – capacity was fairly symmetrical arround the score of 6–7 (find the histogram either searching rightwards from the heading of row 3 or upwards from the heading column 3), while the improvement in ICF Body Structures was zero for nearly all patients (find the histogram either searching rightwards from the heading of row 5 or upwards from the heading column 5); the positive association between Motor FIM improvement and Total FIM improvement was practically the same for patients with and without aphasia (the raising regression lines in the scatterplot at the intersection of line 6 and column 7 coincide), while the positive association between improvement in performance and improvement in capacity within ICF Activities & Participation was higher for non-aphasic than for the aphasic patients (in the scatterplot at the intersection of line 2 and column 3, the black regression line has higher positive slope than the grey regression line).
DISCUSSION
The study sought to determine whether the ICF model is adequate for describing and measuring patterns of disability in stroke patients in clinical settings over time. Our results suggest that rating the ICF categories with the ICF qualifier enables one to detect the changes in functional profiles of stroke patients who underwent an inpatient rehabilitation programme in a rehabilitation hospital.
The use of the ICF qualifiers is not yet fully operational, although there have been attempts to validate the use of the rating scale of the ICF qualifiers (42–44). Inter-rater reliability was found to be moderate to good (42, 44), while intra-rater reliability performed by experienced raters showed excellent agreement (44). One study (42) found better test-retest reproducibility in the institutional settings for geriatric care and attributed this to more information available in the institutional settings, including medical records. To further alleviate such concerns, direct coding of the ICF qualifier was performed in our study by a specially trained single rater.
Summing up qualifiers is not recommended for a number of theoretical and statistical reasons, so our synthesis is based on counts. Difference in extent of functional limitation was assessed by counting and combining positive and negative changes (representing improvement and worsening, respectively) across categories regardless of their degree, while introduction of new categories was considered as a separate indicator of change (because either incorporating it into the improvement score or including it into correlation analyses would require unrealistic assumptions).
The most frequent changes were found in the ICF categories of Activities and Participation regarding capacity, whereby half or more of the patients improved capacity in 4 categories and at least one-third of the patients improved in 5 categories. These are the ICF categories that reflect the main challenges in the post-acute stroke rehabilitation to achieve optimal functioning of the patients. Among the changes of Activities and Participation categories regarding performance, the most frequent changes in the 3 ambulation-related categories probably reflect the environmental impact of the hospital rehabilitation setting with provided care and adapted areas.
In our sample of stroke patients, improvement in Body Functions was more modest, most frequently registered in 7 categories. The findings are in accordance with the neurological recovery pattern after stroke as well as with the impact of the rehabilitation procedures. As expected, we found no relevant time-changes among Body Structures categories, because stroke is not a progressive health condition unless a patient has a recurrent stroke or some other health complication.
One of the reasons that the improvement was most frequently registered in Activities and Participation may be the reliance on specific validated scales for outcome measurement in rehabilitation. The constructs of those instruments mostly fit into the Activities and Participation component and to a lesser extent address categories of Body Functions (12). Accordingly, our results show a correlation of approximately 0.55 between improvement in FIM scores and improvement in capacity of Activities and Participation, and a correlation of approximately 0.4 between improvement in performance and FIM. A correlation of approximately 0.4 was also observed between improvement in FIM and improvement in Body Functions. Similarly, agreement about a link between ICF categories and FIM items has been found in previous studies (11, 12, 45).
To some extent, changes in one ICF component reflect changes in another component. We found moderate association between the improvement in Body Functions and the improvement in Activities and Participation regarding capacity and performance, and a moderate association between the improvement in capacity and performance within the Activities and Participation component. Other associations between ICF components were not significant.
As rehabilitation is a continuous process, it is expected that new patient’s needs and rehabilitation goals turn up with time. Therefore, one of the change measures can also be the number of categories introduced (i.e. newly applied) during the rehabilitation process. In this regard, our findings that the largest proportion of the patients had at least one category introduced among facilitators within Environmental Factors at discharge, and that the next most frequent such changes were observed within Activities and Participation (where approximately 40% of patients had at least one category introduced), are expected.
Among Environmental Factors, the most frequent changes were registered in terms of facilitators in two categories. The opening of the first one (e115, Products and technology for personal use in daily living) reflects the selection of adaptive devices to assist patients in becoming more independent, while opening of the second (e355, Health professionals) reflects good relations between patients and health professional as well as planning of the continuation of rehabilitation after discharge.
In general, changes in FIM score after rehabilitation were numerically much larger than the changes in the measures derived from the ICF, thus FIM can be considered as more sensitive in this respect. Additionally, instructions for FIM scoring are easier to follow than those for the ICF, which, albeit detailed and comprehensive, must be accompanied by a longer assessor training. Furthermore, ICF qualifiers have known deficiencies, most notably non-linearity and insufficient sensitivity. However, in addition to providing a common language for rehabilitation professionals, the ICF gives a much broader view of the patient than FIM or any other scale of similar scope, since FIM and related scales cover only a small subset of what the ICF addresses. Hence, we consider the ICF Checklist to be useful in clinical practice with stroke patients, but it may be preferable to use it only for recording presence or absence of problems and then the rehabilitation team would decide which areas require in-depth assessment considering the rehabilitation goals, so that specialized instruments would then be used for these areas.
The limitations of our study related to limited representativeness of the sample, arising from the fact that we used a convenience sample limited to one centre (albeit the only one providing comprehensive stroke rehabilitation in the country), which only admits relatively severe stroke patients, were already addressed in a previous report (25). The same applies to the lack of detailed information obtainable by interviewing the patient, arising from the fact that ICF coding was performed based on medical documentation and rehabilitation team meetings (25). On a further note, the use of the ICF qualifiers is not yet fully operational and there is no evidence of invariance across time. For statistical testing of causal surmises of associations between improvement (deterioration) regarding capacity or performance and changes in facilitator qualifiers in Environmental Factors, structural equation modelling (SEM) would be necessary, but validity of performing such statistical procedures in our sample would be questionable because all categories were not consistently registered. That problem could have been avoided by using the ICF Core Set for stroke (9, 10, 46), but it should be borne in mind that a study on younger stroke patients based on the ICF Core Set revealed that assessed and perceived problems are not always the same (22). A viable analytical option to assess causality could be graphical models (47), which remain a possibility for further research.
In conclusion, our results are in line with previous observations (8, 18, 19) suggesting the potential advantages of implementating the ICF Checklist in rehabilitation practice. Despite the deficiencies of the ICF qualifiers, rating the ICF categories with the qualifiers at the start and end of the inpatient rehabilitation programme in a rehabilitation institute can reflect the changes in functional profiles of stroke patients. Comprehensive assessment of patient’s functioning based upon the ICF model enables planning of rehabilitation goals and interventions, and to some extent it also enables assessment of the outcome of inpatient stroke rehabilitation. Our future research might therefore focus on a more detailed psychometric assessment of quantitative measures derived from the ICF, as well as on obtaining ICF-based functional profiles at admission and discharge for further groups of inpatient rehabilitation patients.
ACKNOWLEDGEMENT
This study was funded by EC contract no. SP24-CT-2004-513708 (MHADIE).
REFERENCES

