OBJECTIVE: To analyse the number of musculoskeletal pain sites in adults with spastic cerebral palsy, to correlate these with physical and mental components of health-related quality of life, and to describe changes in pain site prevalence over 7 years and the factors improving or worsening the pain.
DESIGN: Seven-year follow-up of a national survey of adults with spastic cerebral palsy (CP).
SUBJECTS/PATIENTS: A total of 149 persons: 46% spastic bilateral CP, 54% unilateral CP, 51% females, mean age 40 years.
METHODS: Pain sites were recorded and physical and mental component summaries computed using Short Form 36.
RESULTS: The median number of pain sites was 3. The mental components showed little, if any correlation (r = –0.08), but the physical components correlated negatively with the number of pain sites (r = –0.36). Back, neck and foot/ankle pain were most common, with an increased prevalence of neck pain. A higher prevalence of hip and foot/ankle pain was found in spastic bilateral CP, and for all pain sites in females. Exertion and physiotherapy were the most important factors for increased and reduced pain, respectively.
CONCLUSION: In contrast to the general population, there was hardly any correlation between the number of pain sites and psychological health. Improved pain management, evidence-based physiotherapy and rehabilitation programmes with a life-span perspective are recommended.
Key words: cerebral palsy; musculoskeletal; pain; adult; health-related quality of life; psychological health.
J Rehabil Med 2011; 00: 00–00
Correspondence address: Arve Opheim, Sunnaas Rehabilitation Hospital, NO-1450 Nesoddtangen, Norway. E-mail: arvei.opheim@sunnaas.no
Submitted October 15, 2010; accepted January 13, 2011
*Parts of this study were presented at the 3rd International Cerebral Palsy Conference, Sydney, 18–21 February 2009, and its abstract was published in Developmental Medicine and Child Neurology, 2009, 51 suppl 2: 71. Other parts of the study were presented at the American Academy of Cerebral Palsy and Developmental Medicine Congress in Washington, 23–25 September 2010, and its abstract published in Developmental Medicine & Child Neurology, 2010, 52 suppl 5: 21–22.
Introduction
Musculoskeletal pain is common in adults with cerebral palsy (CP) and the prevalence of chronic pain is higher than in the general population (GP) (1–5). While the brain lesion that caused CP is unchanging, its consequences are not, which leads to increasing secondary health problems, including pain (6–10). Secondary musculoskeletal problems are consequently part of the latest definition of CP (11).
In adults with CP, several authors have reported a reduction in functional skills, such as walking, at an earlier age than would be expected due to normal ageing. Gross motor function, fatigue and musculoskeletal pain, referred to in this article as “pain,” are reported as the main causes of reduced functional skills (1, 4–7). Studies on pain intensity, duration, frequency, and the most common pain sites are difficult to compare because of differences in categorizations, definitions of chronic pain, and the samples of the CP population. Schwartz et al. (1) found a 67% prevalence of chronic pain (> 3 months duration), with the most common pain sites being the lower extremities (66%) and back (63%), and a mean of 3 pain sites. Murphy et al. (6) found that cervical pain was most prevalent (nearly 50%), especially in dyskinetic CP, followed by back pain (43%), and pain in weight-bearing joints.
In the GP in Norway, the prevalence of chronic pain, defined as daily pain for more than 1 year, was found to be 15% (12). Jahnsen et al. (4) used the same definition in a cross-sectional study of adults with CP in Norway in order to compare results with the GP. Jahnsen (4) found the prevalence of chronic pain to be 28%, twice that of the GP. Schwartz et al. (1) reported a prevalence that was more than twice as high, mainly due to a different definition of chronic pain and a study group consisting mainly of non-ambulatory persons. Jahnsen et al. (4) found that the back was the most common pain site (59%), followed by the neck (44%) and the foot/ankle (44%). Foot and ankle pain was more frequent in spastic bilateral CP. Hip and arm pain was distributed equally between the subgroups, while back pain was less prevalent in spastic unilateral CP than in the other groups. Headache, back pain and hip pain were most frequently reported by females. The mean number of pain sites was 3.6 in females and 2.9 in males. Andersson & Mattsson (7) found that 18% reported daily pain, but as duration was not reported, chronic pain cannot be compared. Fifty percent reported pain at 2–3 sites, the most frequently reported being the back (9%), shoulder, and hip (both 5%). The stability of pain in CP has been studied by Jensen et al. (3) and Malone & Vogtle (13), who found that pain intensity was stable over 2 years and 3 months, respectively. Our 7-year follow-up study (5) showed that pain intensity and the median number of pain sites were unchanged, but pain frequency and the impact of pain on daily life and activities increased. Stability in the prevalence of pain at different body sites has not been studied.
Pain at one site was found to be a predictor for development of pain at other sites, and pain at additional sites increased the likelihood that the pain syndrome would become chronic (14). When pain is seen as a continuum from localized to widespread, the number of pain sites can be used as a simple measure of “widespread” pain (15, 16). In the GP, the number of pain sites was found to be associated with reduced overall health, sleep quality, female gender, and psychological health (15), and was a strong predictor of work disability (17). The literature on psychological health in CP is scarce, but Engel et al. (2) found poorer health in a group of mainly non-ambulatory adults with CP than in the GP. A Dutch study (18) found the mental components of health-related quality of life (HRQoL) in CP to be at the same level as in the GP, and women with CP scored better than women in the GP. Higher scores on mental and physical components of HRQoL were also found to be associated with the effort subscale of self-efficacy (18). Engel et al. (2) found the relationship between pain intensity and psychological distress in persons with CP to be weak. The relationship in mainly ambulatory adults with CP is to our knowledge not known.
Studies of pain in persons with CP and its interference with activity, social life, and work have shown conflicting results. Schwartz et al. (1) found a fairly minor interference of pain with daily activities, while Jahnsen et al. (4) found significantly higher pain intensity and impact of pain on work and daily activities in persons with CP than in the GP. In a recent article, Malone & Vogtle (13) found a significant correlation (r = –0.62, p = 0.03) between the number of pain sites and increased disability resulting from pain in ambulatory adults with CP and chronic pain. Our previous study (5) showed that pain was associated with deteriorated walking function, but whether the number of pain sites is related to the physical and/or mental components of HRQoL is to our knowledge not known.
The aims of this study were to analyse the number of pain sites and the correlation with the physical and mental components of health-related quality of life, and to describe the changes in pain site prevalence over 7 years and the factors improving or worsening the pain, in a group of adults with spastic unilateral and bilateral cerebral palsy.
Methods
This study follows up Jahnsen et al’s (4) multi-dimensional cross-sectional study of 1999, of adults with CP without intellectual disability in Norway. The present follow-up study was conducted in 2006 and included the subgroups with spastic unilateral (hemiplegic) and bilateral (diplegic) CP from the 1999 survey (n = 288).
Inclusion criteria were: > 18 years of age in 1999, Gross Motor Function Classification System (GMFCS) (19) level between I and IV in 1999, and having at least been a household walker. Exclusion criteria were: dyskinetic and ataxic CP, GMFCS levels IV–V in 1999 who had never been a household walker. There were 288 persons with spastic unilateral and bilateral CP in the original study by Jahnsen et al. (4). Sixty-two persons could not be reached, had died, or had earlier declined to participate in further studies, making 226 persons eligible for the study. They received a postal version of the same questionnaire as in 1999. There were 73 non-responders, and 4 were excluded because of self-reported additional diagnoses such as multiple sclerosis (n = 3) and psoriatic arthritis (n = 1). Therefore, 149 persons (66%) were included. A non-responder analysis included all the eligible and not-excluded participants with spastic uni- or bilateral CP in the 1999 survey. There were no significant differences between responders and non-responders regarding age, gender, type of CP, and GMFCS level.
CP are classified into 3 categories according to the Surveillance of Cerebral Palsy in Europe (SCPE) (20): spastic (uni- and bilateral), dyskinetic, and ataxic. Sub-types (uni- or bilateral), gender, age, body weight and height were obtained through self-report, and body mass index (BMI) was calculated. Functional level was classified according to the 5 GMFCS gross motor function levels, level I being the highest and V the lowest (19). The GMFCS scores were obtained through self-reports, which have shown excellent agreement with professional ratings (21). The scoring was also checked against other information about motor function, i.e. data from the HRQoL instrument Medical Outcome Study Short Form 36 (SF-36) (22) and from available medical records when in doubt. Demographic and clinical characteristics of the study participants are presented in Table I.
| Table I. Demographic and clinical characteristics of 149 adults with spastic uni- and bilateral cerebral palsy (CP). Age and body mass index (BMI) is presented as mean and standard deviation (SD), while the other variables are presented as numbers |
| | Male | Female | Total |
| Subjects, n (%) | 76 (51) | 73 (49) | 149 |
| Age, mean (SD) | 40 (10.9) | 41 (10.6) | 40 (10.7) |
| BMI, mean (SD) | 26.1 (5.1) | 24.5 (4.7) | 25.3 (5.0) |
| GMFCS, Level I | 44 | 24 | 68 |
| Level II | 9 | 27 | 36 |
| Level III | 9 | 14 | 23 |
| Level IV | 13 | 6 | 19 |
| Level V | 1 | 2 | 3 |
| Spastic unilateral CP | 47 | 34 | 81 |
| Spastic bilateral CP | 29 | 39 | 68 |
| Education, n First level (9 years) | 11 | 13 | 24 |
| Second level (12 years) | 45 | 34 | 79 |
| Third level (> 12 years) | 20 | 26 | 46 |
| Living situation, n Alone | 40 | 27 | 67 |
| With children | 0 | 6 | 6 |
| With parents | 6 | 3 | 9 |
| Married/cohabitant | 29 | 35 | 64 |
| With others | 1 | 2 | 3 |
| Source of income, n Paid job, > 20% | 42 | 25 | 67 |
| Studying | 1 | 4 | 5 |
| Disability benefit | 34 | 49 | 83 |
| Others | 12 | 22 | 34 |
| Old age pension | 5 | 2 | 7 |
| GMFCS: Gross Motor Function Classification System. |
Pain site(s) (n) for “usual” pain were recorded using check-boxes: head, neck, shoulders, arms, back, hips, knees, feet, and other, with the possibility of reporting several sites. The prevalence (%) of pain at each site in 1999 and 2006 was calculated and compared. Factors that increased (exertion, movements/activity, inactivity or other) or reduced (medication, physiotherapy, movements/activity, rest or other) the pain were suggested in the questionnaire and more than one response alternative could be chosen. Pain intensity during the last month in those reporting pain was assessed with a 100-mm visual analogue scale (VAS), with the anchor point “no pain” or “worst possible pain” (23). Pain duration was assessed with the question: “How old were you when the pain started?”
The aggregated Physical (PCS) and Mental Component Summary Scale (MCS) of HRQoL was obtained from the SF-36 questionnaire, which was a part of the postal questionnaire (24). Due to missing data on 1 or more of the SF-36 subscales, PCS and MCS were calculated from 131 persons. PCS and MCS were computed with weighted scores from the 8 physical and mental subscales from SF-36 (0–100, where 0 = largest and 100 = no reduction in HRQoL in this domain). MCS and PCS were standardized with a linear T score transformation to norm-based scores from the GP in Norway (22, 25). The norm-based scores have a mean of 50 points, and a standard deviation (SD) of 10 points. Scores higher than 50 are better than the GP mean. MCS has been found to be a valid measure for mental health (26), and can therefore be used as an indicator of psychological health, and PCS has been found to be associated with impairments in the lower extremities (27).
Approval for the study was obtained from the regional ethics committee in south-eastern Norway and the Commissioner for the Protection of Privacy in Research. All participants gave written informed consent.
Statistics
Descriptive statistics for ordinal variables and continuous variables without normal distribution were presented with median and inter-quartile (Q1–Q3) range, while continuous variables with normal distribution were presented with mean and SD. The distribution of PCS and MCS was tested with the Kolmogorov-Smirnov test of normalcy. PCS were compared with the norm-based scores in the GP with a one-sample t-test. The relationship between PCS, MCS, and the number of pain sites were assessed with scatter plots and Pearson’s product moment correlation coefficient (r). Correlation coefficients were interpreted according to Domholt (28): 0.00–0.25: Little, if any; 0.26–0.49: Low; 0.50–0.69: Moderate; 0.70–0.89: High; 0.90–1.00: Very high. Since PCS and MCS can be argued to be ordinal data, the above analyses were also performed with non-parametric statistics. When hardly any difference between the results of parametric and non-parametric statistics were present, the results from the parametric statistics were chosen.
The non-responder analysis was performed with independent samples t-test, and χ2 tests. The distribution of the number of pain sites in 1999 vs 2006 was tested using a χ2 test. The difference in prevalence of pain at the different sites between 1999 and 2006 was tested using a paired-samples t-test (29). The differences in pain prevalence at the different sites in 2006 between the sub-types and between the genders were tested using the independent samples t-test. The data were analysed statistically in SPSS 15.0.
Results
Pain was reported by 83% of the 149 individuals in 2006. Thirty-two persons reported no pain sites in 1999, and 26 persons reported no pain sites in 2006. The χ2 test showed a changed distribution, with fewer persons reporting 0, 1, and 5 pain sites, and more persons reporting 2, 3, 6, and 8 pain sites (χ2: 23.074, df: 9, p = 0.006) (Table II). Pain intensity was reported by 111 (74%) participants, and the median was 49 (Q1–Q3: 29–67) mm on the VAS. Pain duration was reported by 96 (64%) and the median was 16 (Q1–Q3: 7–25) years.
| Table II. Number of persons with different number of pain sites in 1999 and 2006 in 149 adults with spastic uni- and bilateral cerebral palsy |
| Number of pain sites | 1999 n (%) | 2006 n (%) |
| 0 | 32 (22) | 26 (17) |
| 1 | 25 (17) | 18 (12) |
| 2 | 28 (19) | 32 (22) |
| 3 | 17 (11) | 28 (19) |
| 4 | 13 (9) | 13 (9) |
| 5 | 20 (13) | 11 (7) |
| 6 | 6 (4) | 10 (7) |
| 7 | 4 (3) | 3 (2) |
| 8 | 3 (2) | 7 (5) |
| 9 | 1 (1) | 1 (1) |
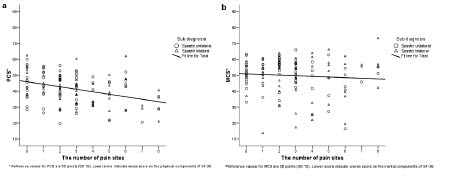
PCS had a normal distribution, while MCS had more persons reporting 1 SD above the mean, and more persons reporting 2 and 3 SD below the mean in the GP (Z: 1.48, p < 0.025), thus being statistically different from the GP. One-sample t-test showed that mean PCS (41.5 points SD 9.7) were significantly lower than in the GP, with a mean difference of –8.5 points (95% confidence interval (CI): –10.2 to –6.9) (t: –10.1, df: 130, p < 0.001). PCS had a low negative correlation with number of pain sites (Pearson’s r: –0.36, p < 0.001), indicating that a higher number of pain sites was associated with lower scores on the physical components of HRQoL (Fig. 1a). Median MCS were 53 points (Q1–Q3 45–57) points, and there was little, if any, correlation between the number of pain sites and psychological health (Pearson’s r: –0.08, p = 0.38) (Fig. 1b). Both spastic bilateral and unilateral CP showed the same relations between the number of pain sites and both MCS and PCS. Pain intensity had a low negative correlation with PCS (Pearson’s r: -0.34, p = 0.001), and little, if any, correlation with MCS (Pearson’s r: –0.05, p = 0.63).
Fig. 1. (a) Physical component summary scale (PCS) of health-related quality of life in (HRQoL) relation to number of number of pain sites in a group of adults with spastic unilateral and bilateral cerebral palsy (n = 131). (b) Mental component summary scale (MCS) of HRQoL in relation to number of number of pain sites in a group of adults with spastic unilateral and bilateral cerebral palsy (n = 131). The regression line for PCS and MCS, respectively, is drawn. Norm-based score of PCS and MCS, respectively, is on the Y-axis, with the mean norm score in the general population being 50 points with a standard deviation of 10 points, and higher scores than 50 are better than the mean.
Back, neck, and foot/ankle were the most common pain sites in the group as a whole, in bilateral and unilateral CP separately, and in males and females separately (Table III). Overall, there was a significant increase in the prevalence of neck pain (mean difference: 10% (95% CI: 2–18) p = 0.019) and a decreased prevalence of knee pain (mean difference: –8% (95% CI: –16 to –0.4) p = 0.039) over the 7-year period. In unilateral CP, there was a significant increase in the prevalence of back pain (mean difference: 16% (95% CI: 4–28) p = 0.008), and in bilateral CP there was a significant increase in the prevalence of neck pain (mean difference: 13% (95% CI: 2–25) p = 0.028). Comparing the sub-types of spastic CP in 2006, there was a significantly higher prevalence of pain at the hip and foot/ankle in bilateral CP, mean difference: –16% ((95% CI: –31–0) p = 0.05) and –18% ((95% CI: –34–2) p = 0.026), respectively. There were consistently higher reports of pain in females on all pain sites in 2006 (Table III).
| Table III. The prevalence rate (percentage) of persons reporting pain at different sites in 1999 and 2006 in adults with spastic uni- and bilateral CP (n = 149). The figures from 1999 are shown first (1999/2006). Significant changes from 1999 to 2006 are marked with asterisks: *(p < 0.05) or **(p < 0.01). Significant differences in prevalence rate between unilateral and bilateral CP, and between females and males in 2006 are marked with †(p < 0.05) or ††(p < 0.01), and the mark is placed on the group with the highest prevalence rate |
| Pain site | Unilateral CP (n = 81) | Bilateral CP (n = 68) | Females (n = 73) | Males (n = 76) | All (n = 149) |
| Head | 14/17 | 21/19 | 26/23 | 8/13 | 17/18 |
| Neck | 30/37 | 35/49* | 44/52† | 21/33* | 32/42* |
| Shoulders | 30/31 | 37/44 | 42/49†† | 24/25 | 33/37 |
| Arms | 25/25 | 24/21 | 34/30† | 14/16 | 24/23 |
| Back | 36/52** | 60/60 | 59/67†† | 36/45 | 47/56 |
| Hips | 25/27 | 32/43† | 33/47* †† | 24/22 | 28/34 |
| Knees | 28/19 | 37/31 | 36/33† | 29/16* | 32/24* |
| Foot/ankle | 32/33 | 47/51† | 49/51† | 29/33 | 39/42 |
Exertion was reported as the most important factor that increased pain, and physiotherapy the most important factor that reduced pain at the two most prevalent pain sites. This was the case both for the whole group (Table IV) and for the sub-types of CP (data not shown in Tables).
| Table IV. Factors that contribute to increased or reduced musculoskeletal pain at the 2 most prevalent pain sites in adults with spastic uni- and bilateral cerebral palsy (n = 149) |
| | What increases the pain? | What reduces the pain? |
| Back pain, n = 83, 56% | Exertion, n = 63 Movements/activities, n = 37 Inactivity, n = 22 | Physiotherapy, n = 46 Pain medication, n = 38 Rest, n = 37 |
| Neck pain, n = 63, 42% | Exertion, n = 50 Movements/activity, n = 30 Inactivity, n = 17 | Physiotherapy, n = 38 Rest, n = 31 Pain medication, n = 30 |
Discussion
The main finding of this study was that there was no correlation between the number of pain sites and psychological health. This is in contrast to the GP in Norway, where the number of pain sites were associated with both reduced physical and mental health (15).
One reason for this finding might be that persons with CP, having been disabled all their lives, are more “used to” having pain, or expect to have pain from time to time, and thus have a different reference frame than the GP. Therefore, pain might not affect their psychological health in the same way. This is in agreement with Engel et al. (30), who found that pain coping styles among persons with CP were the use of task-persistence, diversion of attention and reinterpretation of pain sensations. Expectations of pain improvement might also be less for people who have a life-long disability, who have had pain for many years. Pain may affect psychological health to a lesser degree in these persons, than in those who are often pain-free and expect pain relief after a while. Pain in CP also seems mainly to be of a physical origin, and is often related to the muscles and joints that are being stressed or over-used due to spasticity, contractures and skeletal deformities. These factors are well known by the persons with CP, which makes them easier to comprehend and incorporate in everyday pain compensation strategies.
The median MCS score was the same as the mean in the GP, and also the same as in the Dutch study by Van der Slot et al. (18). However, a higher proportion of the persons with CP in this study scored 2 and 3 SD below the mean MCS of the GP. This latter group, with worse psychological health than the majority, might need additional psychological support. This is probably different from those scoring within 1 SD of the mean MCS in the GP. However, there was hardly any correlation between the low scores on MCS and the number of pain sites and pain intensity, thus there are probably other factors contributing to the low scores for psychological health in this group.
The mean PCS score was, as expected, lower than in the GP, and both the number of pain sites and pain intensity correlated with reduced PCS. This confirms the nature of CP as a permanent and primary disorder affecting the development of movement and posture, as well as the association between pain and physical function. The PCS scores were similar to those reported in the Dutch study (18). In that study, Van der Slot et al. (18) found that higher MCS and PCS scores were related to higher self-efficacy scores on the effort sub-scale.
We chose to use the MCS and PCS scales as indicators of psychological health and physical function, respectively, because we think that they give a better picture of performance in daily life than the single SF-36 domains “physical functioning” and “mental health”, which are more capacity-based. They ask about physical activity limitations due to health, and mental status during the last 4 weeks. We regard the MCS and PCS to be more performance-based, since they also incorporate the physical and emotional role function scales. The role function scales reflect the impact of physical health or emotional problems on social participation and activities in everyday life, and thereby on the roles that each participant fills in their daily life, not what they are able to do if they “have to”.
Pain site prevalence
Back, neck, and foot/ankle pain were the most common pain sites in both uni- and bilateral CP, and this supports earlier findings (1, 6, 9). In bilateral CP, the reduced motor control in the lower extremities often leads to excessive pelvic tilt and lumbar flexion/extension/rotation movements during walking. This probably contributes to the persistence of back pain, the consequences of which can lead to lumbar spondylolysis (31). In unilateral CP, there is reason to believe that the asymmetry in motor control causes overuse of the non-affected side, asymmetrical joint loading, and asymmetrical muscle activation patterns, resulting in pain. Less use of the affected side reduces growth, also causing asymmetric biomechanical conditions, potentially leading to back pain. Increased neck pain in spastic CP, probably due to compensatory increased cervical lordosis and compensatory movements in the spine, is also reported by other researchers (32). Back and neck pain is common in the GP, and a Norwegian population-based study found that 53% reported low back pain symptoms during the past year (12). The prevalence of chronic neck pain was lower than for chronic low back pain (33). The causal pathways for back and neck pain are probably different in the GP than in persons with CP.
The feet are the structures that carry the heaviest load during walking. Musculoskeletal abnormalities with muscle imbalance and skeletal deformities that lead to abnormal biomechanical loading and result in the common deformities of equinus, equinoplanovalgus and equinocavovarus, are probably the main causes of foot/ankle pain in CP (34).
The prevalence of hip pain in bilateral CP was 43%, which is twice that in the GP (12). There is reason to believe that hip pain in this group is caused by the developmental joint changes common in bilateral CP, such as coxa valga, hip dysplasia and increased femoral anteversion. These skeletal changes in combination with altered muscle activity, joint mobility and abnormal joint loading can lead to secondary osteoarthritis (35).
Females consistently reported higher pain than males, which is in accordance with findings in the GP (12, 33). The reasons can be divided into 3 categories: (i) females are more willing to report pain; (ii) a larger vulnerability toward pain in females than males; (iii) more exposed to risk factors than men (33). There is reason to believe that these factors also apply for the females with CP in this study.
Exertion was the most frequently reported cause of increased pain both in the back and neck, and these factors were also found by Schwartz et al. (1), indicating that overuse is a main risk factor for pain, and confirming the impact of the physical components on the pain experience. This is in accordance with Pimm’s (36) hypothesis that proposed overuse of resources is a cause of deterioration of functional skills in adults with CP. The association between number of pain sites and PCS, together with our previous study reporting elevated physical fatigue among those with deteriorated walking in CP, support this theory (5). Physiotherapy was regarded as the most important pain-reducing factor in both back and neck pain. This corresponds with Schwartz et al. (1), who found exercise and stretching to be pain-relieving factors in 92% and 89%, respectively. These results point to an increased need for more evidence-based physiotherapy interventions, and an individualized focus on adapted exercise, stretching, strengthening and functional training.
Pain in adults with spastic CP can have different causes, such as spasticity, contractures, abnormal joint loading, overuse of supporting muscles and ligaments due to reduced motor control and subsequent abnormal body-segment alignment, and reduced bone mineral density and inactivity (37). It seems reasonable to believe that pain is a main factor in walking deterioration at an early age, with serious implications for activity and participation (5, 8). The need for improved pain management in this group is great, and was also highlighted in a recent review paper by Vogtle (37).
These findings warrant a focus on a better balance between existing physiological resources and physical load, and improved pain management, for example through a combination of energy conservation, adapted physical activity, training and medication. The balance between activity and rest must be focused on at an early age, and in close cooperation with the individual, as the will, need, and desire to participate in society is just as important for persons with CP as for others.
Future studies should focus on pain management from an early age in order to contribute to the prevention of chronic pain. The evidence of different training regimes and follow-up programmes on pain and its impact in daily life needs to be established.
The main limitations of this study were the lack of reliability studies of the pain questionnaire in the CP population, which weakens the findings of this study. There were a large number of non-responders; however, this group was not significantly different from the responders.
In conclusion, the main finding of this study was that, in contrast to the general population, there was little, if any, correlation between the number of pain sites and psychological health. Back, neck, and foot/ankle were the most common pain sites in both spastic uni- and bilateral CP, and the prevalence of neck pain increased over the 7 years of the study. Hip and foot/ankle pain were more common in bilateral CP. Pain was more common in females. Exertion and physiotherapy were the most important factors for increased and reduced pain, respectively. There is a need for improved pain management and evidence-based physiotherapy and rehabilitation programmes with a life-span perspective for young persons with CP who are at risk of experiencing reduced health, functioning and quality of life.
AcknowledgEments
The authors thank all the participants in this study. The study was financially supported by the South-Eastern Norway Regional Health Authority.
References