OBJECTIVE: To determine the prognostic value of clinical assessment and motor evoked potentials for upper limb strength and functional recovery after acute stroke, and to establish the possible use of motor evoked potentials in rehabilitation.
DESIGN: A prospective study.
SUBJECTS: Fifty-two patients with hemiparesis were enrolled one month post-stroke; 38 patients concluded the study at 12 months.
METHODS: Motor evoked potentials were recorded at baseline and after one month. Upper limb muscular strength (Medical Research Council Scale, MRC) and functional tests (Frenchay Arm Test, Barthel Index) were used as dependent outcome variables 12 months later. Motor evoked potentials were classified as present or absent. Predictive values of motor evoked potentials and MRC were evaluated.
RESULTS: At 12 months, patients with baseline recordable motor evoked potentials showed a good functional recovery (positive predictive value 94%). The absence of motor evoked potentials did not exclude muscular strength recovery (negative predictive value 95%). Motor evoked potentials had a higher positive predictive value than MRC only in patients with MRC < 2.
CONCLUSION: Motor evoked potentials could be a supportive tool to increase the prognostic accuracy of upper limb motor and functional outcome in hemiparetic patients, especially those with severe initial paresis (MRC < 2) and/or with motor evoked potentials absent in the post-stroke acute phase.
Key words: motor evoked potentials, rehabilitation, stroke, upper limb, outcome.
J Rehabil Med 2009; 41: 654–660
Correspondence address: Assunta Pizzi, Director of the Department of Neurorehabilitation, Fondazione Don C. Gnocchi ONLUS, Centro S. Maria agli Ulivi, Via Imprunetana 124, 50020 Pozzolatico, Florence, Italy. E-mail: apizzi@dongnocchi.it
Submitted November 20, 2007; accepted April 17, 2009
INTRODUCTION
The ability to evaluate the expected level of motor and functional recovery after stroke may help in early decision-making on medical and rehabilitation treatments as well as in research trials for assessment of intervention effects. To estimate the risk/benefit ratio of some treatment strategies, an accurate prognosis for functional recovery is required (1, 2). The initial grade of paresis is generally the most important predictor for motor recovery (3–5). Muscle tone changes, disturbances of deep sensation and consciousness in the acute phase are also considered as important predictors of the degree of further functional recovery (6). However, no single factor can be related strongly enough to allow an accurate prediction (3) and combined stroke scales have limitations, only partially predicting functional outcome (7, 8). Clinical evaluation may often be questionable and inconclusive, especially in non-cooperative or severely cognitively impaired patients. The insufficient predictive strength of clinical parameters has generated research using neuroimaging (infarction size, localization of the lesion) and neurophysiological parameters (2, 7).
Motor evoked potentials (MEP) have been studied to determine the extent of brain damage and to predict motor recovery in patients with stroke (9–13). Evaluation of MEP in the acute phase of stroke (10, 12–17) showed a relationship between motor recovery and the degree of motor system impairment, as attested by central motor conduction time (CMCT) (18), MEP threshold and MEP amplitude (9, 10, 14). However, some authors have expressed doubts that MEP have a prognostic value (18, 19). This discrepancy may be attributed to heterogeneous methodologies. Studies differed regarding the time of MEP recording (12, 20), type and degree of vascular damage, severity of patients’ clinical impairments, neurophysiological parameters measured (10, 12, 13) and outcome measures used (Barthel Index (BI), Frenchay Arm Test (FAT), Medical Research Council scale (MRC)). In a rehabilitative context, functional as well as motor recovery should be considered as outcome measures.
Only one previous study has investigated both neurophysiological and clinical parameters for the prediction of stroke outcome (21). The authors found that in the acute phase (2–5 weeks after stroke) neurophysiological measures alone were of limited value in predicting motor outcome of the arm. MEP predictive value was still limited even at 2 months after stroke. The long-term outcome was best predicted through the combined use of clinical variables and MEP.
After stroke, patients are usually admitted to a rehabilitation centre from a stroke unit or intensive care unit following a period of hospitalization of approximately 15 days. It may then be useful to assess MEP predictive values.
The aims of this study were: (i) to estimate prognostic value of MEP recorded from different muscles in terms of upper limb strength and functional recovery in patients with stroke; (ii) to assess MEP predictive values at different times after stroke onset during post-acute rehabilitation; and (iii) to study the relationship of neurophysiological and clinical predictors.
METHODS
Subjects
Inpatients with hemiparesis following first stroke in life, admitted to the neuro-rehabilitation department of S. Maria agli Ulivi Centre, Florence, over a period of 12 months, from September 2004 to September 2005, were consecutively enrolled. Stroke diagnosis was based on the World Health Organization (WHO) definitions (22). Syndrome diagnosis was categorized according to Oxfordshire Community Stroke Project classifications (23).
The study-population was selected considering as inclusion criteria: (i) the presence of hemiparesis secondary to a first stroke in life, confirmed by computed tomography scan or magnetic resonance imaging; (ii) Mini-Mental State Examination (MMSE) (24) score ≥ 21; (iii) ability to participate in the rehabilitation programme and to stand daily treatment; (iv) absence of previous fractures in the affected upper limb; (v) absence of any other neurological disorder. Subjects with a MMSE score < 21, that precluded active cooperation in the study, and subjects with severe aphasia were excluded.
All subjects agreed to participate in the study by signing a consent form approved by the internal ethics board.
Clinical assessment
Clinical assessment was performed by 2 of the authors (CF, SV) blinded to the neurophysiological results and included upper limb muscular strength evaluation and functional tests. Muscle strength was assessed at deltoid, biceps, extensor digitorum communis (EDC) and abductor digiti minimi (ADM) using MRC scale as follows: 0 – no movement; 1 – a flicker or trace of movement; 2 – movement when gravity is eliminated; 3 – movement against gravity; 4 – movement against gravity and resistance; and 5 – normal strength (25).
Upper limb functional abilities were tested using the FAT. This scale consists of 5 pass/fail tasks; the patient scores 1 for each task that is completed successfully. Only the affected upper limb is evaluated. Patients scoring 5 out of 5 are likely to use their affected upper limb, even if they feel it as abnormal (26).
Functional capacity in activities of daily life (ADL) was monitored using the BI (range 0–100; the higher the score, the greater the independence in ADL) (27, 28).
Transcranial magnetic stimulation
Transcranial magnetic stimulation (TMS) studies were conducted according to the standard criteria published by the International Federation of Clinical Neurophysiology (29). We used monophasic electromagnetic stimulators (Magstim 200; Magstim Co., Whitland, Dyfed, UK) with a round flat coil centred horizontally at the vertex. Stimulation intensity was set at 100% of the maximum stimulator output. The subjects were sitting in an armchair in a quiet room. TMS was performed while subjects were contracting the target contralateral muscle or the ipsilateral homologous muscle, if no voluntary movement could be produced in the contralateral muscle. MEP were recorded with surface electrodes (BIONEN, Florence, Italy) from the following muscles: ADM, EDC, Biceps and Deltoid. A Medelec Synergy (version 8.2) machine (Oxford Instruments Medical Systems, Old Woking, UK) amplified (0.1–5 mV) and filtered (10 Hz – 3 kHz) the signal, then stored it on hard disk.
We used a single pulse TMS technique. Five consecutive responses in a 100-ms post-stimulus period were analysed. We measured size of MEP induced by TMS expressed as MEP/CMAP amplitude ratio, where MEP was the average of 5 consecutive peak-to-peak (most negative to the most positive peak) responses amplitude and CMAP was the Compound Muscle Action Potential of target muscle, evoked by supramaximal electrical peripheral nerve stimulation (ulnar nerve at the wrist for ADM, radial nerve for EDC, brachial plexus at ERB point for biceps and deltoid). The procedure was performed for both upper limbs in all subjects. MEP were considered absent if no response higher than 50 µV could be obtained after 5 stimuli at 100% intensity.
Study design
Patients were evaluated at baseline (T0), after one month (T1) and after 12 months (T2). MEP recording was made at baseline and at T1.
From baseline to T1 all patients participated in a rehabilitation programme therapy: they received 1 h of daily individual physical therapy, based on the Bobath technique (30), for 5 days a week; if needed, patients underwent 1 h of occupational therapy and 1 h of speech therapy.
Data analysis
Statistical analysis was performed using the StatView Software Package (SAS Institute, Inc., Cary, NC, USA). Descriptive statistics for clinical and instrumental parameters were calculated at each recording time.
The baseline differences of epidemiological, clinical (MRC, FAT and BI) and neurophysiological (MEP) parameters between patients who completed the study and patients lost to follow-up were statistically tested with a χ2 test.
To determine whether the presence/absence of MEP was predictive of a different functional recovery assessed with BI, we calculated ANOVA for repeated measures considering MEP presence/absence as between-factor and time of assessment as within-factor (T0, T1, T2). p was derived from paired t-test. Statistical significance was set at p equal to 0.05 or less.
Data analysis consisted of determination of the relationship between MEP and MRC as prognostic determinants and outcome data, using standard 2×2 contingency tables.
MEP were dichotomized into present (normal response or reduced MEP/CMAP amplitude ratio) and absent. Muscle strength assessed at T0 was dichotomized into MRC ≥ 2 and MRC < 2.
Outcome parameters were also dichotomized. Strength recovery was classified as present (MRC ≥ 4) or absent (MRC < 4). Functional recovery was classified as present (FAT ≥ 2; BI ≥ 60) or absent (FAT < 2; BI < 60).
The prognostic test properties were expressed as sensitivity and specificity, positive predictive value (PPV) and negative predictive value (NPV). Sensitivity refers to the proportion of patients who experienced motor or functional recovery, with MEP present and MRC ≥ 2 at T0. Specificity refers to the proportion of patients who did not experience motor or functional recovery, with MEP absent and MRC < 2 at T0. A sensitive prognostic test will rarely miss patients who will achieve motor or functional recovery. A specific test will rarely misclassify patients who will not achieve motor or functional recovery. PPV refers to the probability that patient with MEP present, or with MRC ≥ 2, at T0 will have a favourable outcome, and it assesses the reliability of a positive test. NPV refers to the probability that a patient has an unfavourable outcome when MEP are absent, or with MRC < 2, at T0 and it assesses the reliability of a negative test. Furthermore, we calculated the likelihood ratio for a positive result (LR+) (95% confidence interval, CI), taking into account both specificity and sensitivity. LR+ expresses the odds that a given finding would occur in a patient with, as opposed to without, the target condition. With the LR+ above 1, the probability of the condition being present increases.
Multiple logistic regression was performed to establish whether the combination of MEP responses recorded from the 4 different muscles improved outcome prediction.
RESULTS
From a population of 130 post-stroke patients admitted to the neuro-rehabilitation department, we enrolled 52 consecutive patients. Epidemiological features are reported in Table I.
| Table I. Demographic and clinical data of the study population (n = 52) |
| Clinical data | n |
| Gender, men/women | 27/25 |
| Mean age, years (range) | 62 (21–86) |
| Mean time from stroke, days (range) | 33 (10–60) |
| Affected upper limb, right/left | 21/31 |
| Haemorrhagic lesions Cortical/subcortical | 20 5/15 |
| Ischaemic lesions Partial anterior circulation infarct Total anterior circulation infarct Lacunar infarct Posterior circulation infarct | 32 30 0 2 0 |
| Hand dominance, right/left | 52/0 |
| Initial Barthel index, mean (SD) | 38 (30.1) |
| SD: standard deviation. |
Six patients (11.5%) died prior to the final assessment, 4 (7.7%) withdrew, and 4 (7.7%) were lost to the one-year follow-up, as a result of recurrent stroke, oncological comorbidity or pneumological complications. This subgroup was not significantly different for epidemiological (age, sex), clinical (baseline MRC, FAT and BI) and neurophysiological (baseline MEP) parameters, with respect to the group of patients eligible for the complete follow-up period (n = 38, 73.1%).
Motor evoked potential data
The number of patients with MEP present and MEP/CMAP amplitude ratio values at T0 and T1 are reported in Table II.
MEP were present from at least one muscle in 28 (73.6%) at T0 and in 36 patients (94.7%) at T1.
| Table II. Ratio motor evoked potentials/compound muscle action potential (MEP/CMAP) amplitude ratio at basal evaluation (T0) and at evaluation after one month from baseline (T1) |
| Muscle | Deltoid | Biceps | EDC | ADM |
| MEP/CMAP Mean (SD) | n | MEP/CMAP Mean (SD) | n | MEP/CMAP Mean (SD) | n | MEP/CMAP Mean (SD) | n |
| Non-affected arm | 65.3 (38.7) | 52 | 55.4 (31.5) | 52 | 53.2 (28.4) | 52 | 53.0 (16.7) | 52 |
| Affected arm T0 | 29.2 (23.0)*** | 28 | 35.2 (29.6)** | 24 | 29.1 (23.7)** | 28 | 29.9 (22.7)*** | 27 |
| Affected arm T1 | 33.5 (33.8) | 36 | 33.0 (29.3) | 29 | 37.1 (27.8)* | 34 | 42.5 (20.8)* | 29 |
| Affected vs healthy arm: **p < 0.01; ***p < 0.001; affected arm T0 vs affected arm T1: *p < 0.05. ADM: abductor digiti minimi; EDC: extensor digitorum communis; SD: standard deviation. |
In patients with MEP present in the affected side, MEP/CMAP amplitude ratio was significantly reduced in all muscles with respect to the unaffected side. At T1, MEP/CMAP amplitude ratio increased in all muscles, but changes were statistically significant only for EDC and ADM.
Medical Research Council Scale, Frenchay Arm Test and Barthel Index, according to Motor evoked potentials presence/absence
Table III shows change over time (at T0, T1, T2) of the number of patients in relation to strength and functional outcomes assessed with MRC, FAT and BI, according to presence/ absence of baseline MEP. At T2, 22 patients (58.1%) showed a good recovery of muscular strength proximally (deltoid), whereas only 13 patients (34.2%) showed strength recovery distally (EDC). Functional recovery of upper limb (FAT ≥ 2) was present in 17 patients (44.7%), whereas global functional recovery (BI ≥ 60) was present in 29 patients (76.3%).
| Table III. Number of patients variation evaluated at T0, T1 and T2 for strength and functional recovery by means of Medical Research Council Scale (MRC), Frenchay Arm Test score (FAT) and Barthel Index score (BI), according to presence/absence of motor evoked potentials (MEP) at T0 |
| Muscle | MEP | MRC ≥ 4 | MRC < 4 | FAT ≥ 2 | FAT < 2 | BI ≥ 60 | BI < 60 |
| T0 | T1 | T2 | T0 | T1 | T2 | T0 | T1 | T2 | T0 | T1 | T2 | T0 | T1 | T2 | T0 | T1 | T2 |
| Deltoid | + | 10 | 11 | 17 | 8 | 7 | 1 | 9 | 11 | 15 | 9 | 7 | 3 | 11 | 12 | 16 | 7 | 6 | 2 |
| | – | 0 | 1 | 5 | 20 | 19 | 15 | 0 | 1 | 2 | 20 | 19 | 18 | 0 | 5 | 13 | 20 | 15 | 7 |
| Biceps | + | 9 | 10 | 14 | 7 | 6 | 2 | 8 | 10 | 14 | 8 | 6 | 2 | 10 | 11 | 14 | 7 | 6 | 2 |
| | – | 1 | 3 | 6 | 21 | 19 | 16 | 1 | 2 | 3 | 21 | 20 | 19 | 1 | 6 | 15 | 20 | 15 | 7 |
| EDC | + | 7 | 11 | 16 | 11 | 7 | 2 | 9 | 11 | 16 | 9 | 7 | 2 | 10 | 13 | 16 | 8 | 6 | 2 |
| | – | 0 | 0 | 2 | 20 | 20 | 18 | 0 | 1 | 1 | 20 | 19 | 19 | 1 | 4 | 13 | 19 | 15 | 7 |
| ADM | + | 8 | 10 | 12 | 9 | 7 | 5 | 9 | 10 | 16 | 8 | 7 | 1 | 9 | 11 | 14 | 8 | 5 | 3 |
| | – | 0 | 0 | 1 | 21 | 21 | 20 | 0 | 2 | 1 | 21 | 19 | 20 | 2 | 6 | 15 | 19 | 16 | 6 |
| T0: at baseline; T1: after one month; T2: after 12 months; EDC: extensor digitorum communis; ADM: abductor digiti minimi. |
From T0 to T2, BI score increased significantly [F (1,35) = 58.7, p < 0.0001] in all patients and the increase was not significantly different between patients with or without MEP at T0. At T0, BI score was 32 in patients without MEP, and 52 in patients with MEP; at T2, BI score increased to 70 in patients without baseline MEP, and to 84 in patients with baseline MEP.
ANOVA showed that the BI score was significantly higher in patients with MEP present than in those with MEP absent. Post hoc analysis showed a significant BI score difference between patients with MEP present and MEP absent only at T0 (72 vs 48, respectively; p < 0.05).
Prognostic values of Motor evoked potentials
MEP sensitivity, specificity, PPV, NPV and LR+ in predicting muscular strength and functional outcomes at 12 months are reported in Tables IV and V.
| Table V. Prognostic values of motor evoked potentials (MEP) presence/absence at T0 and at T1 for upper limb functional recovery (FAT ≥ 2) after 12 months (n = 38) |
| Muscle | MEP | T0 | T1 | Sensitivity % | Specificity % | PPV % | NPV % | LR+ (CI) |
| FAT ≥ 2 | FAT < 2 | FAT ≥ 2 | FAT< 2 | T0 | T1 | T0 | T1 | T0 | T1 | T0 | T1 | T0 | T1 |
| Deltoid | + | 15 | 3 | 16 | 8 | 88 | 94 | 85 | 61 | 83 | 66 | 90 | 92 | 6.1 (2.1–17.8) | 2.4 (1.4–4.3) |
| | – | 2 | 18 | 1 | 13 | | | | | | | | | | |
| Biceps | + | 14 | 2 | 16 | 7 | 82 | 88 | 90 | 65 | 87 | 69 | 86 | 86 | 8.6 (2.2–32.9) | 1.2 (0.6–2.4) |
| | – | 3 | 19 | 2 | 13 | | | | | | | | | | |
| EDC | + | 16 | 2 | 17 | 6 | 94 | 100 | 90 | 71 | 88 | 73 | 95 | 100 | 9.8 (2.6–37.5) | 3.3 (1.6–6.5) |
| | – | 1 | 19 | 0 | 15 | | | | | | | | | | |
| ADM | + | 16 | 1 | 15 | 6 | 94 | 88 | 95 | 71 | 94 | 71 | 95 | 88 | 19.7 (2.9–134.5) | 3.8 (1.5–6.2) |
| | – | 1 | 20 | 2 | 15 | | | | | | | | | | |
| T0: at baseline; T1: after one month; EDC: extensor digitorum communis; ADM: abductor digiti minimi; FAT: Frenchay Arm Test; PPV: positive predictive value; NPV: negative predictive value; LR+: likelihood ratio; CI: 95% confidence interval. |
MEP absence at T0 and at T1 had a negative prognostic significance for both muscular strength and functional recovery, although their absence did not exclude strength recovery, mostly at proximal muscles. However, strength recovery did not always lead to functional recovery. In fact, the NPVs for deltoid and biceps were lower for strength recovery than for functional recovery.
MEP predictive value for functional recovery was higher than that for muscular strength (LR+ values between 6.1 and 19.7; Table V). For both MRC and FAT, LR+ values were lower at T1 than at T0. Reduction of predictive power at T1 was due to an increase in sensitivity prior to a reduction in specificity.
Prognostic values of Medical Research Council Scale
Predictive values of MRC (MRC < 2 vs MRC ≥ 2) evaluated at different times (T0 vs T2, and T1 vs T2) for strength and functional recovery are reported in Tables VI and VII. MRC had a high predictive value for both muscular strength and functional recovery, with a high specificity (patients with MRC ≥ 2 had a good probability of recovery at T2), yet with a low sensitivity (patients with MRC < 2 could have strength and functional recovery at T2). MRC predictive values did not change from T0 to T1.
| Table VI. Prognostic values of Medical Research Council Scale (MRC) at T0 and at T1 for strength recovery (MRC ≥ 4) after 12 months (n = 38) |
| Muscle | MRC | T0 | T1 | Sensitivity % | Specificity % | PPV % | NPV % | LR+ (CI) |
| MRC ≥ 4 | MRC < 4 | MRC ≥ 4 | MRC < 4 | T0 | T1 | T0 | T1 | T0 | T1 | T0 | T1 | T0 | T1 |
| Deltoid | ≥ 2 | 12 | 0 | 14 | 0 | 60 | 66 | 94 | 100 | 92 | 100 | 68 | 70 | 10.8 (1.5–75.7) | 12.0 (1.7–82.7) |
| | < 2 | 9 | 17 | 7 | 17 | | | | | | | | | | |
| Biceps | ≥ 2 | 12 | 1 | 19 | 8 | 60 | 90 | 94 | 52 | 92 | 70 | 68 | 81 | 10.8 (1.5–75.7) | 1.9 (1.1–3.2) |
| | < 2 | 8 | 17 | 2 | 9 | | | | | | | | | | |
| EDC | ≥ 2 | 10 | 1 | 12 | 0 | 58 | 63 | 95 | 100 | 90 | 100 | 74 | 74 | 12.4 (1.7–87.1) | 13.5 (1.9–92.1) |
| | < 2 | 7 | 20 | 7 | 20 | | | | | | | | | | |
| ADM | ≥ 2 | 10 | 1 | 11 | 1 | 71 | 78 | 95 | 95 | 90 | 91 | 85 | 88 | 17.1 (2.4–120.0) | 18.8 (2.7-130.9) |
| | < 2 | 4 | 23 | 3 | 23 | | | | | | | | | | |
| T0: at baseline; T1: after one month; EDC: extensor digitorum communis; ADM: abductor digiti minimi; PPV: positive predictive value; NPV: negative predictive value; LR+: likelihood ratio; CI: 95% confidence interval. |
| Table VII. Prognostic values of Medical Research Council Scale (MRC) at T0 and T1 for upper limb functional recovery (FAT ≥ 2) after 12 months (n = 38) |
| Muscle | MRC | T0 | T1 | Sensitivity % | Specificity % | PPV % | NPV % | LR+ (CI) |
| FAT ≥ 2 | FAT < 2 | FAT ≥ 2 | FAT < 2 | T0 | T1 | T0 | T1 | T0 | T1 | T0 | T1 | T0 | T1 |
| Deltoid | ≥ 2 | 12 | 1 | 13 | 1 | 70 | 72 | 95 | 95 | 92 | 92 | 80 | 83 | 14.8 (2.1–102.3) | 16.1 (2.3–110.3) |
| | < 2 | 5 | 20 | 4 | 20 | | | | | | | | | | |
| Biceps | ≥ 2 | 12 | 1 | 15 | 13 | 70 | 88 | 95 | 38 | 92 | 53 | 80 | 80 | 14.8 (2.1–102.3) | 1.4 (0.9–2.1) |
| | < 2 | 5 | 20 | 2 | 8 | | | | | | | | | | |
| EDC | ≥ 2 | 10 | 1 | 11 | 1 | 58 | 64 | 95 | 95 | 90 | 91 | 74 | 76 | 12.5 (1.7–87.3) | 13.5 (1.9–95.0) |
| | < 2 | 7 | 20 | 6 | 20 | | | | | | | | | | |
| ADM | ≥ 2 | 10 | 1 | 11 | 1 | 58 | 64 | 95 | 95 | 90 | 91 | 74 | 76 | 12.5 (1.7–87.3) | 13.5 (1.9-95.0) |
| | < 2 | 7 | 20 | 6 | 20 | | | | | | | | | | |
| T0: at baseline; T1: after one month; EDC: extensor digitorum communis; ADM: abductor digiti minimi; FAT: Frenchay Arm Test; PPV: positive predictive value; NPV: negative predictive value; LR+: likelihood ratio; CI: 95% confidence interval. |
Prognostic values of Motor evoked potentials according to recorded muscle
At T0 and at T1, LR+ of MRC was higher than LR+ of MEP for both muscular strength and functional recovery, except for strength recovery at deltoid and for functional recovery at ADM at T0, and for strength recovery at biceps at T1 (Tables IV and V). MEP had a higher LR+ for functional recovery respect to MRC only at ADM.
A multivariate analysis, including all the muscles from which we recorded MEP, showed a percentage of correctly predicted cases similar to that obtained from univariate analysis on the ADM only (95% vs 94.5%, respectively).
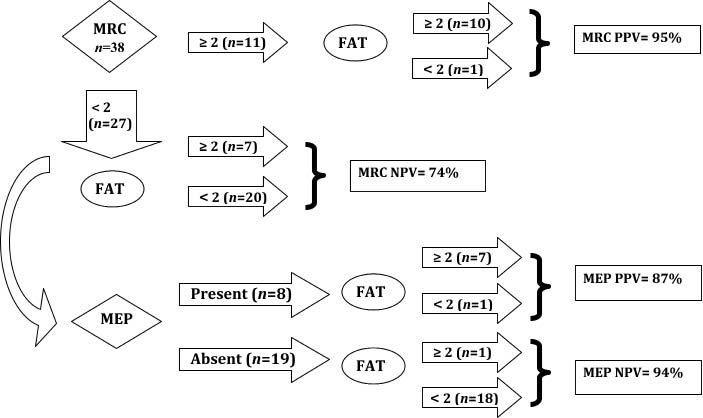
Taking into account ADM (Fig. 1), 10 out of 11 patients with baseline MRC ≥ 2 had functional recovery: PPV (95%) and specificity (95%) showed a good predictive accuracy. Despite a baseline MRC < 2, 7 out of 27 patients had functional recovery, as expressed by a sensitivity value of 58% and NPV value of 74% (Table VII).
Fig. 1. Clinical and neurophysiological evaluation of abductor digiti minimi (ADM) for prognosis of upper limb functional recovery. MRC: Medical Research Council scale; MEP: motor evoked potentials; FAT: Frenchay Arm Test; NPV: negative predictive value; PPV: positive predictive value.
Analysing only the subgroup of 27 patients with baseline MRC < 2, MEP were present in 8 patients. MEP prognostic values for functional recovery were higher than those calculated for the whole sample: sensitivity 87%, NPV 94%, specificity 94%, PPV 87%, and LR+ 16.6.
DISCUSSION
We related the presence/absence of MEP with both muscular strength and functional recovery, using MRC, BI and the FAT (a specific scale for upper limb functional assessment), respectively.
Our data confirm that the presence/absence of MEP may predict upper limb recovery, not only with regard to muscular strength, but mainly with regard to specific functional abilities.
Patients were followed up for 12 months. We chose this period because, although physiological recovery of injured tissue is generally completed within 3 months (21), clinical improvement continues, even if it is less impressive, as a result of reorganization (31) and other positive non-biological factors (3).
Prognostic value of Motor evoked potentials
At 12 months, many patients with baseline recordable (even if pathological) MEP showed a good functional recovery. MEP absence, however, did not exclude muscular strength recovery, mainly in proximal muscles. Yet, in the majority of cases, the segmental strength increase did not correspond to a satisfactory functional recovery (NPV of MEP for functional recovery between 86% and 95%).
Our predictive values of MEP for functional recovery recorded from 4 muscles (specificity 85–95%; sensitivity 88–94%) were higher than those reported by Escudero et al. (14) (from abductor pollicis brevis: specificity 80%; sensitivity 77%) and Heald et al. (32) (from pectoralis major, biceps and triceps brachii and thenar muscles: specificity 58%; sensitivity 79%). This could be due to different functional tests used, the FAT being a more specific upper limb functional test than the BI used in other studies.
In our sample, patients without MEP had a BI score slightly inferior to that of patients with MEP, but differences were not statistically significant. A higher BI score was not associated with a superior predictivity of upper limb functional recovery. This may be explained by compensatory strategies on functional improvement involving the non-paretic limb (33).
We found that BI was not able to show upper limb functional changes of segmental activities, probably because it is a scale that evaluates ADL globally.
Analysing the different muscles to record MEP from, our data suggest that presence/absence of MEP at ADM appears to be the most significant predictor for functional recovery (LR+ 19.7). This is probably due to a central role of distal muscles in manual tasks.
Prognostic value of Motor evoked potentials vs prognostic value of clinical assessment
For muscular strength recovery, baseline MEP presence had a higher predictive value than clinical examination at proximal muscles, as shown by LR+ of 12.9 at deltoid (Table IV).
| Table IV. Prognostic values of motor evoked potentials (MEP) presence/absence at T0 and at T1 for strength recovery (MRC ≥ 4) after 12 months (n = 38) |
| Muscle | MEP | T0 | T1 | Sensitivity % | Specificity % | PPV % | NPV % | LR+ (CI) |
| MRC ≥ 4 | MRC < 4 | MRC ≥ 4 | MRC < 4 | T0 | T1 | T0 | T1 | T0 | T1 | T0 | T1 | T0 | T1 |
| Deltoid | + | 17 | 1 | 19 | 5 | 76 | 90 | 94 | 70 | 94 | 79 | 76 | 85 | 12.9 (1.9–88.7) | 3.0 (1.4–6.5) |
| | – | 5 | 15 | 2 | 12 | | | | | | | | | | |
| Biceps | + | 14 | 2 | 18 | 5 | 70 | 90 | 88 | 72 | 87 | 78 | 72 | 86 | 6.3 (1.6–24.1) | 3.2 (1.5–6.9) |
| | – | 6 | 16 | 2 | 13 | | | | | | | | | | |
| EDC | + | 16 | 2 | 17 | 6 | 88 | 94 | 90 | 70 | 88 | 73 | 90 | 93 | 8.8 (2.3–33.1) | 3.1(1.5–6.2) |
| | – | 2 | 18 | 1 | 14 | | | | | | | | | | |
| ADM | + | 12 | 5 | 14 | 7 | 92 | 97 | 80 | 68 | 70 | 66 | 95 | 98 | 4.6 (2.0–10.2) | 2.7(1.4–5.2) |
| | – | 1 | 20 | 2 | 15 | | | | | | | | | | |
| T0: at baseline; T1: after 1 month; EDC: extensor digitorum communis; ADM: abductor digiti minimi; MRC: Medical Research Council Scale; PPV: positive predictive value; NPV: negative predictive value; LR+: likelihood ratio; CI: 95% confidence interval. |
Hendricks et al. (34) reported that MEP seemed to be more predictive than clinical evaluation to assess functional recovery. In our study MEP presence was superior to clinical assessment in predicting functional recovery only if recorded from ADM. Recording MEP from more than one muscle did not increase predictive value.
The presence of MRC ≥ 2 at baseline is highly predictive of recovery. The reasonable question that follows is whether it is useful to apply to neurophysiological studies requiring special equipment, trained personnel and time. To optimize the indication of MEP, we suggest an algorithm (Fig. 1) to recognize in which patients MEP may provide additional information to clinical assessment for functional outcome. In patients with baseline MRC ≥ 2 clinical evaluation alone has a highly predictive value for functional recovery. In patients with baseline MRC < 2, MEP recording would be helpful to increase prognostic accuracy of functional recovery. The combined application of muscle strength assessment and MEP parameters had stronger predictive value than muscle power evaluation alone in patients with MRC < 2 (Fig. 1), in agreement with Feys et al. (21).
Methodological considerations
In the literature there is no consensus on timing of MEP recording. Timmerhuis & Oosterloo (11) reported that early determination of MEP had predictive value; Catano et al. (9) found that only at one month after stroke MEP correlated significantly with outcome. This discrepancy may be explained by various pathophysiological processes aside from direct tissue damage, such as perilesional oedema, spreading depression, diaschisis and/or mass effect. These factors may interfere with MEP parameters in the acute phase of stroke, leading to an overestimation of the damage (35).
According to Catano et al. (9), in our study absence of MEP recorded in acute post-stroke phase had a high rate of false negatives (patients with MEP absent who showed functional recovery).
To improve prognosis we suggest that MEP recording is repeated at admission in the rehabilitation centre, in patients who were shown to have MEP absent in a previous examination.
Feys et al. (21) found that, in the acute phase, neurophysiological measures alone were of limited value in predicting motor recovery; at 2 months after stroke onset, MEP could provide additional valuable information to clinical assessment in patients with moderate hemiparesis. These authors used regression analysis and multivariate analysis for statistical analysis and they did not estimate predictive values in terms of sensibility and specificity.
In our population, however, predictive value of MEP recorded between 45 and 90 days after stroke (T1) decreased for muscular strength and for functional recovery in all muscles. MEP appearance at T1 did not necessarily lead to an improved outcome, as shown by a reduction in MEP PPV.
Escudero et al. (14) reported that patients with MEP appearance over time had clinical improvement, assessed with BI, whereas we used specific upper limb functional scales.
A limitation of our study is the large range of time of baseline MEP recording (15–60 days). However, in a post-acute rehabilitation centre, patients are admitted with different clinical severity, sometimes after long periods of hospitalization in intensive care units due to post-stroke inter-current medical complications. Another limitation is that the size of sample, with mixed ischaemic and haemorrhagic stroke at different locations, did not allow cases stratification for statistical analysis.
In conclusion, our study confirms that MEP have a significant predictive value regarding functional recovery at 12 months. In a clinical rehabilitative context, use of neurophysiological studies in combination with clinical evaluation is reasonable. Our data suggest that MEP may be helpful in predicting functional recovery if recorded at ADM from 2 weeks to 2 months after stroke onset. Subsequently, MEP predictive values decreased, as shown by a reduction in MEP PPV.
Considering the clinical applicability of MEP, the proposed algorithm may assist in decision-making about medical and rehabilitation treatments.
An additional motive for MEP study is their use in patients with consciousness disorders and/or aphasia, as without patient cooperation MRC cannot be appropriately assessed and thus is inconclusive with respect to prognosis, while MEP can be successfully recorded.
In conclusion, in order to improve upper limb functional prognosis, it would be useful to record MEP in non-cooperative patients and in subjects with MRC < 2, in whom clinical predictive value is low, even if previous MEP were found to be absent in the post-stroke acute phase.
REFERENCES