Koen Putman, PhD1, Liesbet De Wit, PhD2, Wilfried Schupp, MD3, Ilse Baert, MSc2, Nadine Brinkmann, BSc3, Eddy Dejaeger, PhD4, Willy De Weerdt, PhD2, Hilde Feys, PhD2, Walter Jenni, MD5, Christiane Kaske, BSc5, Nadina Lincoln, PhD6, Fred Louckx, PhD1, Birgit Schuback, MSc5, Bozena Smith, MSc6 and Mark Leys, PhD1
From the 1Department of Health Sciences and Medical Sociology, Faculty of Medicine and Pharmacy, Vrije Universiteit Brussel, Brussels, 2Department of Rehabilitation Sciences, Faculty of Kinesiology and Rehabilitation Sciences, Katholieke Universiteit Leuven, Leuven, Belgium, 3Fachklinik Herzogenaurach, Herzogenaurach, Germany, 4University Hospital Pellenberg, Pellenberg, 5Rehaclinic Zurzach, Zurzach, Switzerland and 6Institute of Work, Health and Organisations, University of Nottingham, Nottingham, UK
BACKGROUND: Care after discharge from inpatient stroke rehabilitation units varies across Europe. The aim of this study was to compare service delivery after discharge.
METHODS: A total of 532 consecutive patients after stroke were recruited from 4 European rehabilitation centres in Germany, Switzerland, Belgium and the UK. At 2-month intervals, clinical assessments and structured interviews were carried out to document functional status and delivery of services after discharge. Significant factors for receiving follow-up services were analysed using a logistic generalized estimating equation model.
RESULTS: After controlling for case-mix, the results showed that Belgian patients were most likely to receive physical therapy but least likely to receive occupational therapy. German patients were least likely to receive nursing care. UK patients were less likely to receive medical care from their general practitioner compared with the other patient groups.
CONCLUSION: Clinical characteristics did not explain the variations in service delivery after discharge from inpatient stroke rehabilitation. The decision-making processes involved in the provision of follow-up services need to be better documented. To improve our understanding of events post-discharge, the influence of non-clinical factors, such as healthcare regulations, should be explored further.
Key words: stroke, rehabilitation, follow-up studies, community health services, health services research.
J Rehabil Med 2009; 41: 646–653
Submitted November 19, 2008; accepted March 19, 2009
Correspondence address: Koen Putman, Department of Health Sciences and Medical Sociology, Faculty of Medicine and Pharmacy, Vrije Universiteit Brussel, Laarbeeklaan 103, BE-1090 Brussels, Belgium. E-mail: kputman@vub.ac.be
INTRODUCTION
Stroke is a major health burden (1, 2) and is the leading cause of disability in Europe (2). The provision of rehabilitation services after stroke aims to maximize participation in the community (3). Organized inpatient rehabilitation is more effective in preventing institutionalization compared with general wards or mobile stroke teams (4).
Discharge from hospital is one of the main desires of stroke patients (5), associated with hopeful ideas about recovery (6). However, patients experience mixed feelings of relief at returning home and uncertainty about their new situation (7). Relearned motor skills and functional activities need to be transferred to the home environment, which can be difficult and stressful (8). Follow-up services can be an effective means to alleviate the functional disabilities of stroke at home (9–11). Paolucci et al. (12) demonstrated a significant improvement in mobility for patients receiving post-discharge rehabilitation treatment. Therapy-based rehabilitation in an outpatient setting was found to prevent deterioration and improve independence in activities of daily living in patients at home (13, 14). Community occupational therapy improved personal and extended activities of daily living (15).
Indicators or factors determining which patients receive follow-up services remain uncertain. The patient’s needs and functional abilities at discharge seem to be logical factors. However, Asplund et al. (16) found that healthcare routines rather than the patient’s condition were the major determinants of the extent to which resources were used. In Europe, wide variations are observed in healthcare provision after stroke (17, 18). Service delivery after discharge needs more attention when the long-term effects of stroke rehabilitation programmes are studied. Since information about outreach care is lacking (19), outcome comparison may be biased. Comparisons of long-term outcome between centres could be understood better if more detailed information on service delivery after discharge were available. Additionally, such information would provide a more general insight into the determinants of follow-up services.
The aim of this study was to compare the delivery of follow-up services for stroke patients discharged home from inpatient stroke rehabilitation between 4 centres in 4 different European countries. Associations between socio-demographic factors, socio-economic variables and clinical characteristics of stroke patients with service delivery were examined.
MATERIAL AND METHODS
Settings and subjects
This study was part of a European project, Collaborative Evaluation of Rehabilitation in Stroke across Europe (CERISE), comparing outcome after stroke between rehabilitation centres in 4 European countries. Data was collected in 6 stroke rehabilitation units (SRUs): the Fachklinik, Herzogenaurach, Germany (SRU-DE); Queen’s Medical Centre and City Hospital, Nottingham, UK (analysed together, SRU-UK); 2 SRUs at the University Hospital, Pellenberg, Belgium (analysed together, SRU-BE) and the RehaClinic, Zurzach, Switzerland (SRU-CH).
The inclusion criteria were: (i) first-ever stroke as defined by the World Health Organization (WHO) (20), (ii) age 40–85 years, (iii) score on Gross Motor function of the Rivermead Motor Assessment (21) (RMA-GF) ≤ 11 and/or a score on Leg and Trunk function (RMA-LT) ≤ 8 and/or a score on Arm function (RMA-AR) ≤ 12 on admission to the rehabilitation centre. The exclusion criteria were: (i) other neurological impairments with permanent damage, (ii) stroke-like symptoms due to subdural haematoma, tumour, encephalitis or trauma, (iii) pre-stroke Barthel Index (BI) (22) < 50, (iv) admitted to the rehabilitation centre more than 6 weeks post-stroke, (v) no informed consent.
Study design
Patients were recruited consecutively on admission to the SRU. Co-morbidities, such as hyperlipidaemia, history of high blood pressure, myocardial infarction, smoking, diabetes mellitus, atrial fibrillation and coronary heart disease, were recorded, as well as the presence of swallowing problems, language disorder and urinary incontinence. At discharge, pre-stroke socio-demographic aspects, such as living alone, educational level and equivalent income, were determined using a structured interview. At 2, 4 and 6 months post-stroke the place of residence was documented. Motor and functional outcome was measured using RMA and BI, respectively. Additionally, emotional distress and quality of life were measured using the total score on the Hospital Anxiety and Depression scale (HADS) (23) and the EuroQol-Visual Analogue Scale (EuroQol VAS) (24), respectively. At the 3 time-points, a structured interview was used to document the services that patients received after they were discharged home. At each interview, the previous 2 months were considered. Six types of services were recorded: physiotherapy (PT), occupational therapy (OT), nursing care, speech and language therapy, psychological therapy and services from a general practitioner (GP). These services could have been provided in any type of setting, e.g. outpatient setting, GP surgery, private practice, daycare centre or at the patient’s home. The study was approved by the ethics committee in each centre.
Data analysis
The place of residence at each time-point was described and compared between SRUs. Places were grouped into 4 categories: living at home, in a rehabilitation centre, in an acute hospital or institutionalized. Both living in own home or living with family were defined as “living at home”. “Institutionalized” referred to any type of long-term facility (e.g. nursing home). Additionally, patients who died or were lost to follow-up were categorized as “deceased” and “unknown”, respectively. For patients who were discharged home, patient characteristics were compared between the centres, using Kruskal-Wallis and Pearson χ2 tests, as appropriate. At each time-point and for each of the 6 services, the proportions of patients who had had at least one contact with the healthcare professional in the past 2 months were determined.
Multivariate analyses were then used to model the patients’ probability of receiving a service while living at home. The independent variables were centre, age, gender, educational level, equivalent income, living alone pre-stroke or with relatives (acquaintances), co-morbidities, emotional distress, EuroQol VAS and the scores on RMA-GF, RMA-LT, RMA-A and BI. Age was dichotomized using a median split into: below 70 years and 70 years or more. Educational level was determined by the International Standard Classification of Education (ISCED) (25). Low education was defined as the ISCED classification 0–2 (below or equal to lower secondary level) and high education as ISCED classification 3 or higher (upper secondary level or higher). Equivalent income was based on the monthly household income and the household composition and calculated according to the modified Organisation for Economic Co-operation and Development scale (26). Each patient was assigned to one of the following 3 categories: low, moderate or high equivalent income. The upper limit of low income was specified by the at-risk-of-poverty threshold (27), and equalled 60% of the median national equivalent income. Equivalent incomes between 60% and 120% of the median national equivalent income were considered as moderate. An equivalent income of 120% of the threshold or higher was defined as a high income. The variable “co-morbidities” was entered in the model as a dummy variable, being “0” as no co-morbidities present and “1” if at least one co-morbidity was present. Emotional distress was defined by the cut-off level of 11 on the HADS (28). The quality of life measurement EuroQol-VAS was categorized into 2 groups, using the median value of 70. The scores on the motor outcome assessments were grouped into 3 categories (RMA-GF: 0–3/4–6/7–13; RMA-LT: 0–3/4–7/8–10; RMA-A: 0–5/6–10/11–15). Five categories were used for functional outcome (BI: 0–20/25–40/45–60/65–80/85–100).
For each type of service, a logistic generalized estimating equation model (29) was developed, to study the likelihood of receiving that service at home, accounting for the serial dependency and controlling for case-mix. A backward elimination strategy (30) was followed to select the variables in the final model. The initial model included all potential case-mix variables. Score-statistics on the case-mix variables were calculated and the variable with the largest p-value was then removed and the model re-fitted. This procedure was repeated until the Score-statistics showed significant p-values for all variables in the model. Pair-wise comparisons between centres were conducted on the probability to receive services. The variables centre, age and gender were always included in the model. Bonferroni correction was used to correct for multiple testing. Significance levels were set at 0.05. For the statistical analyses, SAS 9.1 (31) was used.
RESULTS
A total of 532 patients were included in the study. At 2 months post-stroke, the majority of the patients were still in the rehabilitation centre (50–72%, Table I). The proportion of patients discharged home was in the range 25–41% in the different centres. The proportion of patients discharged to a hospital or long-term care facility was in the range 1–7% in each centre. At 4 months, the majority of patients were at home, with the lowest percentage for SRU-BE (55%) and the highest for SRU-DE (75%). The second most frequent type of residence varied between SRUs. For SRU-CH, the second largest group of patients was discharged to a long-term care facility (23%). For the other SRUs, the second largest group stayed in the rehabilitation centre (9–28%). At 6 months, between 66% (SRU-CH) and 76% (SRU-DE) of the patients were at home. The patients who stayed in a long-term care facility represented between 5% and 19% of the patient group in each centre.
| Table I. Place of residence at 2-, 4- and 6-months post-stroke |
| | SRU-DE n = 135 n (%) | SRU-UK n = 135 n (%) | SRU-BE n = 127 n (%) | SRU-CH n = 135 n (%) |
| 2 months post-stroke |
| Living at home | 54 (40) | 56 (41) | 32 (25) | 41 (30) |
| In rehabilitation centre | 75 (56) | 68 (50) | 92 (72) | 80 (59) |
| In acute hospital | 1 (1) | 4 (3) | 0 (0) | 3 (2) |
| Institutionalized | 0 (0) | 1 (1) | 2 (2) | 10 (7) |
| Deceased | 2 (1) | 1 (1) | 0 (0) | 1 (1) |
| Unknown | 3 (2) | 5 (4) | 1 (1) | 0 (0) |
| 4 months post-stroke |
| Living at home | 101 (75) | 96 (71) | 70 (55) | 90 (67) |
| In rehabilitation centre | 12 (9) | 18 (13) | 35 (28) | 2 (1) |
| In acute hospital | 1 (1) | 2 (1) | 2 (2) | 3 (2) |
| Institutionalized | 7 (5) | 13 (10) | 13 (10) | 31 (23) |
| Deceased | 3 (2) | 3 (2) | 3 (2) | 2 (1) |
| Unknown | 11 (8) | 3 (2) | 4 (3) | 7 (5) |
| 6 months post-stroke |
| Living at home | 102 (76) | 95 (70) | 92 (72) | 89 (66) |
| In rehabilitation centre | 3 (2) | 5 (4) | 8 (6) | 2 (1) |
| In acute hospital | 2 (1) | 6 (4) | 1 (1) | 3 (2) |
| Institutionalized | 7 (5) | 16 (12) | 17 (13) | 26 (19) |
| Deceased | 8 (6) | 6 (4) | 3 (2) | 4 (3) |
| Unknown | 13 (10) | 7 (5) | 6 (5) | 11 (8) |
| SRU-DE: German stroke rehabilitation unit; SRU-UK: British stroke rehabilitation unit; SRU-BE: Belgian stroke rehabilitation unit; SRU-CH: Swiss stroke rehabilitation unit. |
For those who were discharged home, patient characteristics are described in Table II. At 2 months post-stroke, the percentages of patients living at home were significantly different between SRUs (p = 0.004). No significant differences were found in gender and proportion living alone prior to stroke. Patients discharged home from SRU-DE were significantly younger compared with the patients from the other SRUs. The BI differed significantly between centres, with SRU-BE patients having lower BI-scores. Patients in SRU-CH had significantly higher scores on all 3 sections of the RMA compared with the patients discharged from the other centres. The HADS-scores did not differ between SRUs. The results for the EuroQol-VAS showed significant differences between centres, with lower scores for patient discharged from SRU-BE. At 4 months, the proportion of patients who were at home differed between centres (p = 0.002). Significant differences were in gender, with a majority being female in SRU-UK and SRU-BE (54% and 57%, respectively). Patients in SRU-DE were significantly younger. Motor and functional scores were significantly different between centres, with mainly lower scores in SRU-BE. Emotional distress as well as quality of life did not differ between the patient groups. At 6 months, no differences were found between centres in the proportion of patients discharged home (p = 0.080). Gender differences remained, with lower percentage of females in SRU-DE (31%) compared with the other centres (44–53%). Also, significant differences were found in age similar to the situation at 4 months. The patients in SRU-BE and SRU-UK had significantly lower scores on all motor and functional assessments compared with the other 2 centres. Differences in quality of life were found between SRU-BE and SRU-UK and between SRU-BE and SRU-CH. Patients from SRU-BE having the lowest scores.
| Table II. Characteristics of patients living at home after inpatient stroke rehabilitation |
| | SRU-DE | SRU-UK | SRU-BE | SRU-CH | p-value |
| Living at home at 2 months |
| Patients, n (%) | 54 (40) | 56 (41) | 32 (25) | 41 (30) | 0.004a |
| Gender, female, n (%) | 16 (30) | 28 (50) | 16 (50) | 20 (49) | 0.103a |
| Living alone prior to stroke, n (%) | 15 (28) | 17 (30) | 14 (44) | 10 (24) | 0.314a |
| Age, median (P25–P75) | 68 (61–73) | 74 (66–80) | 74 (71–77) | 74 (69–78) | 0.002b |
| BI, median (P25–P75) | 100 (90–100) | 95 (90–100) | 85 (80–95) | 100 (95–100) | < 0.001b |
| RMA-GF, median (P25–P75) | 11 (10–12) | 10 (9–11) | 10 (9–11) | 12 (11–13) | < 0.001b |
| RMA-LT, median (P25–P75) | 9 (9–10) | 9 (8–10) | 9 (8–9) | 10 (9–10) | 0.004b |
| RMA-A, median (P25–P75) | 12 (9–14) | 13 (10–14) | 11 (9–13) | 14 (13–14) | 0.011b |
| HADS, median (P25–P75) | 7 (3–13) | 9 (4–16) | 9 (4–17) | 8 (4–13) | 0.311b |
| EuroQol VAS, median (P25–P75) | 68 (50–80) | 75 (60–80) | 65 (50–70) | 70 (53–82) | 0.049b |
| Living at home at 4 months |
| Patients, n (%) | 101 (75) | 96 (71) | 70 (55) | 90 (67) | 0.002a |
| Gender, female, n (%) | 31 (31) | 52 (54) | 40 (57) | 36 (40) | < 0.001a |
| Living alone prior to stroke, n (%) | 30 (30) | 32 (33) | 17 (24) | 25 (28) | 0.634a |
| Age, median (P25–P75) | 67 (60–73) | 74 (67–79) | 71 (59–76) | 72 (64–76) | < 0.001b |
| BI, median (P25–P75) | 100 (85–100) | 95 (85–100) | 85 (75–95) | 100 (90–100) | < 0.001b |
| RMA–GF, median (P25-P75) | 11 (10–12) | 10 (7–11) | 10 (9–12) | 11 (10–12) | < 0.001b |
| RMA-LT, median (P25–P75) | 9 (9–10) | 9 (7–9) | 9 (6–10) | 9 (9–10) | 0.001b |
| RMA-A, median (P25–P75) | 12 (8–14) | 12 (3–14) | 11 (4–14) | 13 (10–14) | 0.046b |
| HADS, median (P25–P75) | 8 (5–14) | 10 (4–14) | 10 (5–16) | 8 (4–13) | 0.743b |
| EuroQol VAS, median (P25–P75) | 68 (50–80) | 70 (50–80) | 62 (50–70) | 65 (50–80) | 0.306b |
| Living at home at 6 months | | | | | |
| Patients, n (%) | 102 (76) | 95 (70) | 92 (72) | 89 (66) | 0.080a |
| Gender, female, n (%) | 32 (31) | 50 (53) | 46 (50) | 39 (44) | 0.013a |
| Living alone prior to stroke, n (%) | 26 (25) | 30 (32) | 23 (25) | 26 (29) | 0.707a |
| Age, median (P25–P75) | 66 (59–72) | 73 (66–78) | 69 (59–75) | 72 (64–76) | < 0.001b |
| BI, median (P25–P75) | 100 (85–100) | 95 (85–100) | 85 (70–95) | 100 (95–100) | < 0.001b |
| RMA-GF, median (P25–P75) | 11 (10–12) | 10 (8–11) | 10 (8–11) | 11 (10–12) | < 0.001b |
| RMA-LT, median (P25–P75) | 10 (9–10) | 9 (6–10) | 9 (5–10) | 10 (9–10) | < 0.001b |
| RMA-A, median (P25–P75) | 13 (8–14) | 12 (2–14) | 10 (3–14) | 14 (10–14) | < 0.001b |
| HADS, median (P25–P75) | 7 (4–14) | 7 (3–12) | 9 (4–16) | 8 (4–11) | 0.211b |
| EuroQol VAS, median (P25–P75) | 65 (50–80) | 70 (50–86) | 60 (50–75) | 70 (60–80) | 0.018b |
| aχ² test; bKruskal Wallis test. P25: 25th percentile; P75: 75th percentile; BI: Barthel Index; RMA-GF: Rivermead Motor Assessment, section Gross Function (range: 0–13); RMA-LT: Rivermead Motor Assessment, section Leg and Trunk (range: 0–10); RMA-A: Rivermead Motor Assessment, section Arm (range: 0–15) HADS: Hospital Anxiety and Depression Scale (range: 0–42); EuroQol VAS: EuroQol-Visual Analogue Scale (range: 0–100); SRU-DE: German stroke rehabilitation unit; SRU-UK: British stroke rehabilitation unit; SRU-BE: Belgian stroke rehabilitation unit; SRU-CH: Swiss stroke rehabilitation unit. |
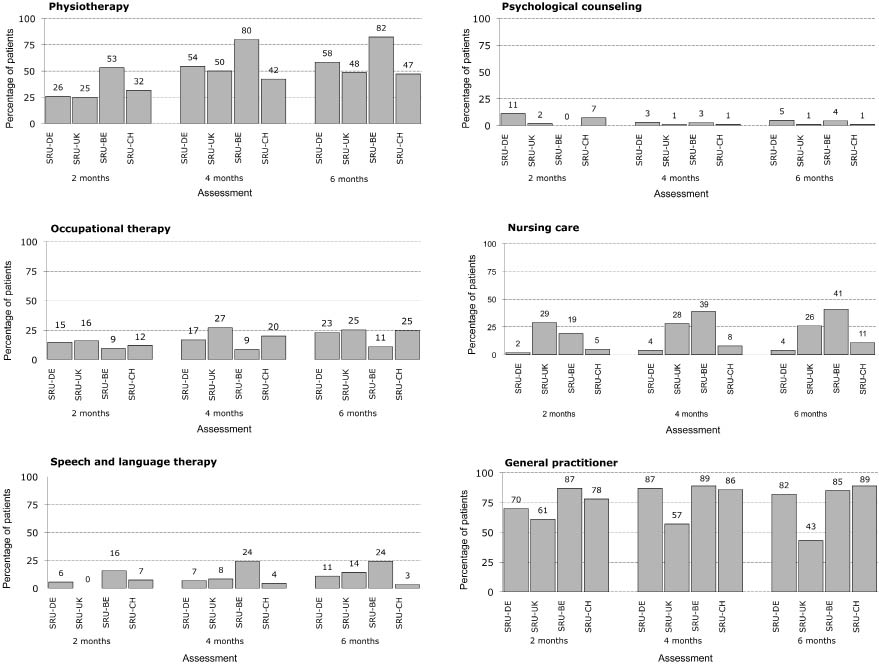
The percentages of patients at home receiving follow-up services are shown in Fig. 1. For PT, differences existed between centres at each time-point with the highest percentage for SRU-BE (53–82%). In the other centres, the percentages were lower and comparable across centres at each time-point. Except for SRU-BE, the percentage of patients who received OT was half to one-third of the percentage who received PT. The highest proportion receiving OT (range 16–27%) was found for the group of patients discharged from SRU-UK, with SRU-BE having the lowest (9–11%). For SRU-BE, the percentage of patients receiving OT is 11–16% of those receiving PT. Speech and language therapy is provided to 0–24% of the patients at home, with the highest percentage for patients from SRU-BE at each time-point (16–24%). Much lower percentages were found for psychological therapy. At 4 and 6 months post-stroke the percentage of patients receiving psychological therapy ranged from 1% to 5%. The proportions of patients receiving nursing care discharged from SRU-BE (19–41%) and SRU-UK (26–29%) were much higher than in the other 2 centres. The percentages were similar at the different time-points, except for SRU-BE. In the latter, the percentage increased over time and was 41% at 6 months post-stroke. The proportions of patients at home that consulted a GP varied between 61% and 87% at 2 months post-stroke. Larger differences between centres were found at 4 and 6 months. These varied between 43% and 57% for SRU-UK and 82% and 89% in the 3 other centres.
Fig. 1. Percentage of patients at home receiving services at 2, 4 and 6 months post-stroke onset. SRU-DE: German stroke rehabilitation unit; SRU-UK: British stroke rehabilitation unit; SRU-BE: Belgian stroke rehabilitation unit; SRU-CH: Swiss stroke rehabilitation unit.
To compare the probability of receiving services at home, generalized estimating equation modelling was used adjusting for case-mix and repeated measurements (Tables III and IV). Due to the low frequencies, speech and language therapy and psychological therapy were not analysed.
| Table III. Final logistic generalized estimating equation model for receiving physiotherapy and occupational therapy for patients at home between 2 and 6 months after stroke onset |
| Variable | Receiving physiotherapy | Receiving occupational therapy |
| OR | 95% CI | p-value | OR | 95% CI | p-value |
| Centre |
| SRU-DE | 1.11 | 0.75–1.64 | 0.592 | 0.63 | 0.35–1.14 | 0.129 |
| SRU-UK | 0.90 | 0.60–1.34 | 0.591 | 1.36 | 0.77–2.40 | 0.292 |
| SRU-BE | 4.07 | 2.58–6.41 | < 0.001 | 0.37 | 0.19–0.75 | 0.005 |
| SRU-CH | 1.00 | | | 1.00 | | |
| Age < 70 years | 2.10 | 1.55–2.84 | < 0.001 | 2.41 | 1.57–3.70 | < 0.001 |
| Age ≥ 70 years | 1.00 | | | 1.00 | | |
| Male | 0.93 | 0.69-1.25 | 0.614 | 1.79 | 1.15–2.80 | 0.011 |
| Female | 1.00 | | | 1.00 | | |
| No swallowing problems | 0.61 | 0.39–0.96 | 0.033 | | | |
| Swallowing problems | 1.00 | | | | | |
| RMA-A (0–5) | 4.24 | 2.85–6.30 | < 0.001 | 2.26 | 1.40–3.65 | 0.001 |
| RMA-A (6–10) | 1.53 | 1.02–2.31 | 0.042 | 1.40 | 0.78–2.50 | 0.264 |
| RMA-A (11–15) | 1.00 | | | 1.00 | | |
| Comparisons between centres |
| SRU-DE vs SRU-UK | 1.29 | 0.70–2.38 | 0.279 | 0.47 | 0.21–1.02 | 0.010 |
| SRU-DE vs SRU-BE | 0.26 | 0.12–0.54 | < 0.001 | 1.70 | 0.660–4.369 | 0.139 |
| SRU-DE vs SRU-CH | 1.11 | 0.58–2.13 | 0.668 | 0.63 | 0.288–1.399 | 0.129 |
| SRU-UK vs SRU-BE | 0.20 | 0.09–0.42 | < 0.001 | 3.63 | 1.49–8.85 | < 0.001 |
| SRU-UK vs SRU-CH | 0.86 | 0.45–1.67 | 0.556 | 1.36 | 0.63–2.92 | 0.292 |
| SRU-BE vs SRU-CH | 4.33 | 1.96–9.54 | < 0.001 | 0.37 | 0.15–0.95 | 0.005 |
| Bold figures indicate significance. RMA-A: Rivermead Motor Assessment, section Arm (range: 0–15); OR: odds ratio; CI: confidence interval; SRU-DE: German stroke rehabilitation unit; SRU-UK: British stroke rehabilitation unit; SRU-BE: Belgian stroke rehabilitation unit; SRU-CH: Swiss stroke rehabilitation unit. |
| Table IV. Final logistic generalized estimating equation model for receiving nursing care or having contact with a general practitioner for patients at home between 2 and 6 months after stroke onset |
| | Receiving nursing care | Receiving services from general practitioner |
| Variable | OR | 95% CI | p-value | OR | 95% CI | p-value |
| Centre |
| SRU-DE | 0.38 | 0.15–0.99 | 0.047 | 0.67 | 0.37–1.22 | 0.190 |
| SRU-UK | 3.28 | 1.61–6.69 | 0.001 | 0.22 | 0.13–0.39 | < 0.001 |
| SRU-BE | 5.31 | 2.66–10.60 | < 0.001 | 0.94 | 0.49–1.82 | 0.860 |
| SRU-CH | 1.00 | | | 1.00 | | |
| Age < 70 years | 0.49 | 0.30–0.80 | 0.005 | 1.05 | 0.71–1.56 | 0.810 |
| Age ≥ 70 years | 1.00 | | | 1.00 | | |
| Male | 0.61 | 0.38–0.98 | 0.043 | 1.15 | 0.78–1.70 | 0.479 |
| Female | 1.00 | | | 1.00 | | |
| RMA-GF (0–3) | 3.11 | 1.21–7.98 | 0.018 | | | |
| RMA-GF (4–6) | 1.58 | 0.65–3.81 | 0.312 | | | |
| RMA-GF (7–13) | 1.00 | | | | | |
| RMA-LT (0–3) | 4.15 | 1.53–11.28 | 0.005 | 1.25 | 0.62–2.50 | 0.531 |
| RMA-LT (4–7) | 2.22 | 1.32–3.73 | 0.003 | 0.52 | 0.33–0.84 | 0.007 |
| RMA-LT (8–10) | 1.00 | | | 1.00 | | |
| EuroQol-VAS, < 70 | | | | 1.70 | 1.16–2.49 | 0.006 |
| EuroQol-VAS, ≥ 70 | | | | 1.00 | | |
| Comparisons between centres |
| SRU-DE vs SRU-UK | 0.12 | 0.04–0.38 | < 0.001 | 3.05 | 1.58–5.89 | < 0.001 |
| SRU-DE vs SRU-BE | 0.07 | 0.02–0.23 | < 0.001 | 0.71 | 0.31–1.64 | 0.285 |
| SRU-DE vs SRU-CH | 0.38 | 0.10–1.38 | 0.047 | 0.67 | 0.30–1.49 | 0.190 |
| SRU-UK vs SRU-BE | 0.62 | 0.30–1.29 | 0.085 | 0.23 | 0.11–0.49 | < 0.001 |
| SRU-UK vs SRU-CH | 3.28 | 1.26–8.57 | 0.001 | 0.22 | 0.10–0.47 | < 0.001 |
| SRU-BE vs SRU-CH | 5.31 | 2.10–13.46 | < 0.001 | 0.94 | 0.39–2.29 | 0.860 |
| Bold figures indicate significance. RMA-GF: Rivermead Motor Assessment, section Gross Function (score range: 0–13); RMA-LT: Rivermead Motor Assessment, section Leg and Trunk (score range: 0–10); OR: odds ratio; CI: confidence interval; SRU-DE: German stroke rehabilitation unit; SRU-UK: British stroke rehabilitation unit; SRU-BE: Belgian stroke rehabilitation unit; SRU-CH: Swiss stroke rehabilitation unit. |
Patients under 70 years were more likely to receive PT. Initial swallowing problems were associated with a higher likelihood of receiving PT as well was a lower score on the RMA-A (RMA-A ≤ 5 and RMA-A between 6 and 10) (Table III). Comparisons between centres, after correction for multiple testing, revealed that patients discharged from SRU-BE were more likely to receive PT compared with patients discharged from the other centres. No significant differences were found between patients who were discharged from SRU-DE, SRU-UK and SRU-CH. Age under 70 years, being male and a RMA-A score ≤ 5 were factors significantly associated with a higher likelihood of receiving OT after discharged home from inpatient stroke rehabilitation. Patients from SRU-UK were more likely to receive OT at home compared with those from SRU-DE and SRU-BE. Additionally, patients from SRU-BE were less likely to receive OT at home compared with patients from SRU-CH.
The probability of receiving nursing care or having contact with a GP is shown in Table IV. Patients younger than 70 years and men were less likely to receive nursing care. A RMA-GF score < 3 and a score on the RMA-LT ≤ 7 were associated with a higher likelihood of receiving nursing care. Comparisons between centres showed that patients from SRU-DE were less likely to receive nursing care compared with those discharged from the other centres. Patients from SRU-CH were also less likely to receive nursing care compared with those from SRU-UK and SRU-BE. A score between 4 and 7 on the RMA-LT and a score above 70 on the EuroQol-VAS were associated with a lower likelihood of seeing a GP. Patients discharged from SRU-UK were less likely to have had contact with a GP compared with patients from the other centres.
DISCUSSION
This study showed that the follow-up services after inpatient stroke rehabilitation varied greatly between 4 European centres, indicating different support provided to patients after stroke at home. After controlling for case-mix, Belgian patients were most likely to receive PT, but least likely to receive OT. On the other hand, German patients were least likely to receive nursing care. The British patients were less likely to receive medical care from their GP compared with the other patient groups.
The proportions of patients living at home at 4 months post-stroke were comparable with the results from the study by Asplund et al. (16). They found that between 49% and 69% were at home 3 months post-stroke. Data on the percentages of patients who were at home at 6 months post-stroke were not found. In a recent overview, large variations in proportions were reported in 7 European countries, ranging from 50% to 100% (19). The proportion of patients at home at 2 months post-stroke was not found in the literature.
The patient characteristics of those who were discharged home differed between centres at the 3 time-points for several reasons. First, case-mix analyses showed that on admission the total group of patients in SRU-BE and SRU-UK had significantly lower scores on the BI and RMA compared with the other centres. Also gender and age differences were found on admission to the SRU (32). Secondly, different discharge policies may be the reason for different functional and motor scores of patients who returned home. If there is inadequate professional healthcare support available at home, the more dependent patients will be discharged to institutionalized settings.
A lower RMA-A score was associated with a higher probability of receiving both OT and PT, which seemed logical. However, contrasting results were found for SRU-BE. After adjusting for case-mix and multiple testing, patients returning home from SRU-BE had the highest probability of receiving PT at home. As poor arm recovery had a similar determining effect on the probability of receiving OT, it was expected that Belgian patients would also be more likely to receive OT, but in fact the opposite occurred. Patients from SRU-BE had the lowest probability of receiving OT. It is hypothesized that national healthcare regulations had a dominant effect on service delivery. In Belgium, OT is only reimbursed when services are provided in hospitals, rehabilitation centres or outpatient clinics. The fact that patients from SRU-BE had more PT may be a substitution for the lack of OT in the community (in a private practice or at home). Moreover, the prescription and reimbursement regulations for PT in home care are quite particular, and because of these regulations there could be a supplier-induced effect on the PT side, which explains the higher proportion of PT in patients from SRU-BE (33). This is a clear example of how healthcare regulations rather than the patients’ condition or need seemed to be the driving force behind the way available resources were used (16).
Receiving nursing care was determined by the patient’s age and the score on the RMA-GF and RMA-LT. Patients in the lowest category of RMA-GF and the 2 lower categories of RMA-LT were more likely to receive nursing care. These sections of the RMA can be considered as a proxy for the level of dependency. After case-mix adjustments, patients discharged from SRU-UK and SRU-BE were more likely to receive nursing care at home compared with the patients discharged from SRU-DE and SRU-CH. The underlying reason may be the reimbursement regulations, interfering with the provision of nursing care. For example, thresholds on BI-scores are used to define who will be refunded for nursing care at home in Germany. The higher the BI-score, the less services are refunded. Patients in Germany do not receive any reimbursement for nursing care when they score higher than 75. It is most remarkable that the BI was not retained in the generalized estimating equation-model determining the nursing care at home. It is possible that the ceiling effect of the BI in long-term follow-up studies (34) may be a contributing factor. This indicates that BI is not a good indicator to reflect the need for nursing care at home after stroke.
There was no gradient in severity in RMA-LT scores accounting for higher probability of receiving medical care from the GP. This is in line with the findings from Redfern et al. (35). In their study on follow-up services in the first 3 months post-stroke, no association was found between the level of disability and contact with the GP. In fact, patients with moderate disability (BI higher than 10 and less than 20 on a maximum of 20) showed significantly lower odd ratios (OR) for visiting a GP or receiving a visit from a GP (OR = 0.50 95% confidence interval (CI): 0.32–0.79). These proportions are similar to those in our analyses (OR 0.52 95% CI 0.33–0.84 (Table IV)). Patient’s subjective well-being was a determining factor of the probability of contact with a GP. Patients with a score < 70 on the EuroQol-VAS were more likely to have contact with their doctor. This finding supports the role of the GP as a counsellor in support of stroke patients after discharge home. Large differences were observed between SRU-UK and the other centres in the probability of patients having had contact with their GP. Significantly fewer UK patients had seen their medical doctor compared with patients from the other centres. Explanations can be found in the different procedures for prescribing therapy services. In Belgium, Germany and Switzerland, therapy services can be provided only when prescribed by a medical doctor and are limited in numbers. This leads to patients seeing the GP to obtain a prescription for extra therapy sessions. Secondly, follow-up services may be provided by different caregivers in the different countries. In practice, follow-up secondary prevention is more frequently performed by nurses in the UK compared with the other countries (35). Because of this, GPs may have had less direct contact with patients in the UK.
Some limitations of the study need to be addressed. Only a limited sample of centres was available and the centres were not representative of the different countries. For example, within the UK, large variations in service provision have been documented (36). Therefore, the variations found in this study cannot be attributed entirely to differences in national healthcare services, but may also reflect differences in local policies. Consequently, caution is required when generalizing the results. On the other hand, stakeholders who are involved in organizing stroke rehabilitation services can learn from this large variation in services to develop their own stroke services (16). Secondly, the information about services after discharge was obtained by interviews with patients and therefore some reporting inaccuracy might have occurred between the reports and the actual services being provided. In a study by Luther et al. (37) on the comparison of patients’ and providers’ reports about rehabilitation services, they found a good agreement between both sources for occupational therapy and community physiotherapy (Kappa = 0.64 for both types of service). However, the period that they considered was one month between stroke onset and interview. In our study, the period that the patients were asked to report about was 2 months at each interview and 6 months in total. The longer period may have a negative effect on the accuracy of reporting. In addition, cognitive function was not assessed. As memory problems are expected to interfere with recalling any utilization of care, accuracy on reporting contacts with healthcare providers may be low. Perhaps this is also the reason for the fact that low frequencies were observed for speech and language therapy and psychological therapy. We did not conduct additional comparisons between the patients’ reports and providers’ notes, due to practical constraints. The number of patients in combination with the variety of providers in the different countries made it unrealistic to conduct these additional verifications. Interpretation of results should thus be made with appropriate caution.
Follow-up services after inpatient rehabilitation were compared between 4 centres in 4 European countries. Socio-demographic and socio-economic factors, prognostic factors, co-morbidities as well motor and functional outcome were included to control for case-mix. Large variation in service delivery was found between centres. As follow-up services can reduce the long-term dependency after stroke, differences in proportions of patients receiving services after discharge may influence follow-up comparisons in outcome between centres. Services provided after discharge from inpatient rehabilitation should be better documented to facilitate a more precise comparison on the effectiveness of rehabilitation programmes. As stroke rehabilitation research becomes more international, incorporating contextual elements of healthcare provision will enhance insight and generate more a comprehensive basis for comparison.
ACKNOWLEDGEMENTS
This article was developed within the framework of the research “Collaborative Evaluation of Rehabilitation in Stroke across Europe (CERISE)”, Quality of life-key action 6, 2001–2005, contract number QLK6-CT-2001-00170 funded by the European Commission and Sekretariat für Bildung und Forschung SBF (CH). It does not necessarily reflect its views and in no way anticipates the Commission’s future policy in this area.
REFERENCES