OBJECTIVE: To perform acoustic analysis of swallowing sounds, using a microphone and a notebook computer system, in healthy subjects and patients with dysphagia affected by neurological diseases, testing the positive/negative predictive value of a pathological pattern of swallowing sounds for penetration/aspiration.
DESIGN: Diagnostic test study, prospective, not blinded, with the penetration/aspiration evaluated by fibreoptic endoscopy of swallowing as criterion standard.
SUBJECTS: Data from a previously recorded database of normal swallowing sounds for 60 healthy subjects according to gender, age, and bolus consistency was compared with those of 15 patients with dysphagia from a university hospital referral centre who were affected by various neurological diseases.
METHODS: Mean duration of the swallowing sounds and post-swallowing apnoea were recorded. Penetration/aspiration was verified by fibreoptic endoscopy of swallowing in all patients with dysphagia.
RESULTS: The mean duration of swallowing sounds for a liquid bolus of 10 ml water was significantly different between patients with dysphagia and healthy patients. We also described patterns of swallowing sounds and tested the negative/positive predictive values of post-swallowing apnoea for penetration/aspiration verified by fibreoptic endoscopy of swallowing (sensitivity 0.67 (95% confidence interval 0.24–0.94); specificity 1.00 (95% confidence interval 0.56–1.00)).
CONCLUSION: The proposed technique for recording and measuring swallowing sounds could be incorporated into the bedside evaluation, but it should not replace the use of more diagnostic and valuable measures.
Key words: auscultation, dysphagia, swallowing disorders, deglutition disorders, respiratory aspiration, stroke.
J Rehabil Med 2009; 41: 639–645
Correspondence address: Francesco Panza, Department of Geriatrics, Center for Aging Brain, Memory Unit, University of Bari, Policlinico, Piazza Giulio Cesare, 11, IT-70124 Bari, Italy. E-mail: geriat.dot@geriatria.uniba.it
Submitted November 7, 2008; accepted March 19, 2009
INTRODUCTION
Dysphagia is a common symptom in many neurological disorders, such as acute stroke (the most common subgroup), amyotrophic lateral sclerosis (ALS), gravis myasthenia and Parkinson’s disease (PD). Swallowing difficulties affect 22–65% of patients after stroke, depending on the method of assessment used (1). Dysphagia increases the risk for development of pneumonia and is a marker of poor prognosis, persistent disability, prolonged hospital admission, reduced likelihood of favourable rehabilitation outcomes, and mortality (2).
Swallowing is initiated by the cerebral cortex and controlled by the brainstem swallowing centre. In many neurological disorders there is dysregulation of normal swallowing physiology and, in some patients with poorly coordinated swallowing, a bolus may subsequently enter the airway below the level of the vocal cords and food often enters the lungs (aspiration) (3). Swallowing and respiration use the same anatomical structures, and hence require a fine degree of coordination. In particular, aspiration affects pulmonary status, which impacts on exercise endurance and ability to participate in rehabilitation programmes (4). Moreover, general dysphagia affects nutritional intake, which impacts on adequacy of nutrition to participate in a rehabilitation programme. At present, the ability to detect dysphagia at the bedside and identify which patients may be at risk of dysphagic complications, such as aspiration, remains limited.
There are several forms of swallow assessment that can be used to evaluate patients with dysphagia. The most frequently used swallow test is the bedside examination, and although it is ineffective in detecting silent aspiration, it is safe, relatively simple and easily repeatable (5). Cervical auscultation is a technique proposed to augment the clinical evaluation of dysphagia, which provides additional information about the pharyngeal swallow with the use of a listening device, typically a stethoscope, during deglutition (6). This method is based on subjective evaluation, but an acoustic analysis of swallowing sounds can help to identify pathological patterns. Research into the acoustic analysis of swallowing sounds in healthy adults has enabled the observation of acoustic characteristics, recording the sounds of swallowing and conducting oscilloscopic and spectroscopic analyses (7). Cichero & Murdoch (8) analysed acoustic swallowing signals and created a preliminary database for normal adult swallowing sounds using a thin liquid consistency identifying any changes based on gender, age and bolus volume. Previous studies on the sounds of transit of boluses during swallowing have investigated the characteristics of healthy subjects and 9 neurological patients with dysphagia (9). Whereas important research-based data for the normal swallowing sounds related to liquid volume have been published (8), few studies have investigated 4 different types of bolus (10). Moreover, the sensitivity and specificity of these methods have not been established and reports on this topic have no consistency of methodology, characteristics under investigation, or terminology.
The aim of this study was to develop a new technique for assessment of swallowing, using a microphone and a notebook computer system. We first assessed the efficacy of this new technique in healthy subjects, and then performed an acoustic analysis of swallowing sounds in patients with dysphagia who were affected by neurological diseases, testing the positive/negative predictive value of pathological pattern of swallowing sounds for penetration/aspiration, as determined by fibreoptic endoscopic evaluation of swallowing (FEES).
METHODS
Subjects
Between January 2005 and December 2007, 60 healthy volunteers were recruited in the Department of Physical Medicine and Rehabilitation of University of Bari, Bari, Italy. Exclusion criteria were: previous history of dysphagia; eating or drinking difficulties; neurological diseases; and structural abnormalities that could affect the swallowing or respiratory systems. The healthy subjects were divided into 3 age groups, with 10 males and 10 females in each group: group A (age range 18–35 years), group B (age range 36–59 years), and group C (age 60 years and older).
In the same time period, 15 patients with dysphagia, hospitalized in the Department of Physical Medicine and Rehabilitation of University of Bari, Bari, Italy, were recruited. Among these patients, 8 were affected by stroke (mean age 73.1 (standard deviation (SD) 8.2) years); 1 by myasthenia gravis (age 56 years), 4 by ALS (mean age 62.3 (SD 5.2) years); and 2 by PD (mean age 77 (SD 6.2) years). Exclusion criteria were: dementia; severe depression; and medical unfitness. Moreover, patients with PD were evaluated with the Hoehn & Yahr (H&Y) scale (11), while patients with ALS were evaluated with the Amyotrophic Lateral Sclerosis Functional Rating Scale (ALS-FRS) (12). The study protocol received the approval of the ethics committee of the University of Bari. After complete description of the study, written informed consent was obtained for all participants involved in the study. For those patients with dysphasia, the researchers explained the study using gesture and modified language.
Equipment
The system was based on a notebook computer with a Pentium processor. The acoustic signal was recorded by a contact microphone with a latex strip. The microphone was an MC-1200 (Trust International BV, Dordrecht, the Netherlands) with the following characteristics: impedance 600 ohm, and frequency rate 50–14,000 Hz. The acoustic signals were acquired directly from the notebook computer and processed by the Fast Fourier Transform (FFT)-based Praat software for Windows (Version 4.2.17, Paul Boersma and David Weenink, Phonetic Sciences Department, University of Amsterdam, Amsterdam, The Netherlands), a computerized voice acoustic analysis programme (13). Fig. 1(A) represents the acoustic analysis of a swallow of 10 ml water in a healthy subject.
Procedure
Normal subjects and patients with dysphagia were seated in a straight-backed chair and were aided by the speech-language pathologist. A microphone was secured onto the lateral border of trachea immediately inferior to the cricoid cartilage. Subjects were asked to swallow 4 boluses comparable to those used in the clinical evaluation of dysphagia. The quantities were chosen in order to allow the bolus to be swallowed in a single complete action and to allow successive assessment. The boluses were presented in the same order to all participants: solid (5 g sandwich loaf); semi-solid (10 g pudding); semi-liquid (10 g yogurt, not creamy, not in pieces); liquid (10 ml water, not sparkling). The water was measured with graduated syringe into a small plastic cup. Each volume was given twice in succession with a 1 min break between swallows. Given the high risk of penetration/aspiration, in patients with dysphagia who are affected by neurological diseases we used only a liquid bolus of 10 ml water. Recording of acoustic signals for each swallowing trial began immediately before bolus administration (the examiner also instructed the volunteer as to the type of bolus to swallow); at the end of the swallow by observing the displacement of the subject’s larynx, the recording continued for more than 1 min after the subject signalling (raising their hand).
Acoustic analysis
Every swallow recorded was included in the acoustic analysis programme and was represented graphically through a narrowband acoustic spectrogram, measuring the changes in frequency and amplitude of the acoustic signal with time. Sounds were processed by Praat software using the following parameters: window length 0.005 sec; maximum frequency 5000 Hertz (Hz); frequency step 20 Hz; window shape: Gaussian; time-step 0.002 sec. The programme showed 2 different graphical images of the signal: an oscillogram in the upper part and a spectrogram in the lower part. A sampling rate of 22,050 Hz was used to avoid peak clipping of the acoustic signal: this sampling rate was chosen to maintain consistency with other studies (8).
The acoustic profile of a swallow for each kind of bolus was measured, recording 3 variables for each swallow. The duration of the swallowing sound (DSS) was measured in msec and defined as the time that elapsed from the beginning to the end of the signal being analysed: the start and the end of the sound of swallow were identified by listening to the sound and observing the spectrogram. The peak intensity (PI) of the acoustic signal recorded, in decibels (dB), was defined as the point of highest displacement of the acoustic signal on an energy contour. The peak frequency (PF) of the acoustic signal, measured in Hz, was the highest frequency of the acoustic signal obtained directly from the sound spectrogram. To identify the start and end of the swallowing sound a cursor was sited according to the sound intensity trend: the lowest point being where the energy trend of the signal began to increase, and the highest point where the energy trend began to decrease. Respiratory acts before and after swallowing were important to identify the swallow sounds. These variables were selected to characterize the normal swallow and served as a point of reference from which to compare swallowing across age, gender and bolus volume and consistency. The dependant variables were analysed across each bolus type, sex, and age. Moreover, this instrument allowed us to identify respiratory phases (inspiration, expiration, and apnoea) without the aid of airflow measurement, distinguishing them from swallowing sounds by their different features. A respiratory sound for a healthy subject was considered a stationary sound and it was characterized by a wide sound spectrum that covers a frequency range of less than 100 Hz to more than 1500 Hz, with a frequency fall of around 800 Hz. Expiratory sounds in the trachea were slightly louder than inspiratory ones (14, 15). Swallowing sounds had a short duration and a high frequency with sudden changes. It was not sufficient simply to analyse the swallowing sounds of individuals with dysphagia; it was also important to consider respiratory phases before and after the swallowing act. After the clinical assessment and acoustic analysis, a FEES was performed using a liquid bolus of 10 ml water in all neurological patients.
Statistical analysis
Statistical analysis was performed using the SPSS (version 11.0). A factorial analysis of variance was performed to estimate the mean overall differences of DSS, PI, and PF of swallowing by age group (18–35, 36–59, and > 60 years old) and sex. A p-value < 0.25 was used as a screening criterion for selecting candidate variables for the multivariate model. Multiple comparisons were then performed to analyse differences between groups (categories of age and sex) by independent two-sample t-test, using SAS software, version 9.1. The statistical inferences were adjusted according to Bonferroni inequality (t-value corresponding to 0.05/15 = 0.33% for each of individual comparisons). Student’s t-test was used to investigate the differences between the mean DSS of our 60 healthy volunteers and those obtained in the study of Youmans & Stierwalt (10) from 97 healthy volunteers (48 men and 48 women), aged 20–79 years, mean age 48.47 (SD 17.34), in which an acoustic analysis of swallowing sounds with bolus of consistencies similar to those used in the present study was performed. After this, we valued the post-swallowing respiration, that is, the time in msec employed for apnoea, the presence and absence of penetration/aspiration, and the classification of dysphagia. Furthermore, we compared the mean DSS of our 60 healthy volunteers with the mean DSS of the 15 patients with dysphagia who were affected by neurological diseases. Finally, we calculated the negative/positive predictive values of post-swallowing apnoea for penetration/aspiration, as verified by FEES (16).
RESULTS
Table I shows the global values and coefficients of variation (CV) related to variables of acoustic swallowing sounds in healthy volunteers. In addition, Table I shows values related to variables according to bolus consistency in healthy volunteers. Table II summarizes the variables of acoustic swallowing sounds in healthy volunteers according to age and sex groups. The F statistic for testing the difference in mean DSS among age categories was 18.610 (p < 0.001). Using the Bonferroni method, significant differences were identified in pairs among the age range 36–59 years (difference 122.37, p < 0.001, 95% confidence interval (95% CI) 49.17–195.58), the age range 18–35 years (difference 179.95, p = 0.001, 95% CI 106.75–253.15), and subjects > 60 years. The F statistic for testing the difference in average PF among age categories was 8.806 (p < 0.001). Using the Bonferroni method significant differences were identified in pairs of means among subjects > 60 (difference 417.81, p < 0.01, 95% CI 132.38–703.23), the age range 36–59 years (difference 435.51, p < 0.01, 95% CI 150.08–720.93), and the age range 18–35 years. The F statistic for testing the difference in average PI by age categories and sex was 2.820 (p < 0.10). Using the Bonferroni method significant differences were identified in pairs of means between > 60-year-old men (mean difference 11.08, p = 0.001, 95% CI 3.94–18.22) and men in the age range 36–59 years. Comparing variations in mean DSS between the present study and another published series of healthy volunteers according to the volume and consistency of the bolus (10), we found significant differences in DSS between our findings and those of the other published series only for semi-solid (730.8 msec (72.2) vs 530 msec (130)) (t = 10.96; p < 0.0005) and liquid (438.1 msec (109.6) vs 490 msec (110)) (t = 2.58; p < 0.01) boluses (Table II).
| Table I. Global variables in the acoustic analysis of swallowing sounds and variables in the acoustic analysis of swallowing sounds according to bolus consistency in healthy volunteers |
| Bolus consistency | Variable | Mean (SD) | Max–Min |
| – | DSS (msec) 0.3 | 577.2 (154.8) | 944.0–245.0 |
| – | PF (Hz) 0.2 | 3204.8 (565.9) | 4244.0–1666.3 |
| – | PI (dB) 0.3 | 31.6 (8.3) | 76.2–12.4 |
| Solid | DSS (msec) PF (Hz) PI (dB) | 575.7 (90.3) 2896.6 (556.0) 29.4 (11.2) | 721.0–311.0 3897.8–1877.1 76.2–17.3 |
| Semi-solid | DSS (msec) PF (Hz) PI (dB) | 730.9 (72.2) 3164.3 (503.1) 31.3 (7.9) | 944.0–574.0 3812.0–1806.8 42.9–12.4 |
| Semi-liquid | DSS (msec) PF (Hz) PI (dB) | 564.2 (168.2 ) 3226.2 (452.5) 30.0 (5.4) | 911.0–245.0 3824.7–2211.0 40.2–16.4 |
| Liquid | DSS (msec) PF (Hz) PI (dB) | 438.1 (109.6) 3601.0 (465.2 ) 35.7 (6.2) | 714.0–276.0 4244.0–2281.3 45.3–20.6 |
| Coefficients of variation (CV): DSS = 0.3; PF = 0.3; PI = 0.4. DSS: duration of the swallowing sound; PF: peak frequency; PI: peak intensity; SD: standard deviation. |
| Table II. Variables in the acoustic analysis of swallowing sounds according to age and sex in healthy volunteers |
| Age and sex | Variable | Mean (SD) | Max–Min |
| 18–35 years |
| Men | DSS (msec) | 530.9 (82.7) | 730.0–287.0 |
| Women | | 462.2 (59.5) | 804.0–245.0 |
| Men | PF (Hz) | 2879.2 (550.5) | 3687.0–1666.3 |
| Women | | 2996.8 (487.2) | 3933.0–1877.1 |
| Men | PI (dB) | 26.0 (7.0) | 37.0–12.4 |
| Women | | 30.0 (5.4) | 41.2–18.3 |
| 36–59 years |
| Men | DSS (msec) | 545.2 (82.7) | 783.0–311.0 |
| Women | | 572.1 (48.5) | 820.0–371.0 |
| Men | PF (Hz) | 3397.9 (455.0) | 4179.0–2620.3 |
| Women | | 3243.0 (390.4) | 4002.4 –2319.7 |
| Men | PI (dB) | 33.3 (5.1) | 41.6–25.8 |
| Women | | 29.9 (5.0) | 45.0–19.1 |
| > 60 years |
| Men | DSS (msec) | 674.4 (38.2) | 911.0–522.0 |
| Women | | 678.6 (85.1) | 944.0–423.0 |
| Men | PF (Hz) | 3470.0 (267.3) | 4161.4–2568.0 |
| Women | | 3241.6 (489.4) | 4244.0–1929.8 |
| Men | PI (dB) | 37.1 (1.9) | 45.2–30.0 |
| Women | | 33.1 (10.3) | 76.2–17.3 |
| DSS: duration of the swallowing sound; PF: peak frequency; PI: peak intensity; SD: standard deviation. |
We used only the DSS variable (CV = 0.4) and post-swallowing respiration in describing the acoustic analysis patterns of neurological patients with dysphagia. The PF (CV = 0.6) and PI (CV = 0.7) variables displayed a large amount of variability in these patients. The mean (SD) of DSS in neurological patients with dysphagia was 1402.1 msec (925.9) for a liquid bolus of 10 ml water. Comparison of the mean (SD) DSS between neurological patients with dysphagia and healthy patients (440 msec (SD 103)) showed a significant difference (t = 8.02; p < 0.01; df: 73), with a difference of 963.1 msec (95% CI 723.7–1202). Furthermore, in testing the negative/positive predictive values of post-swallowing apnoea for penetration/aspiration verified by FEES, for any particular test result, the probability that it would be positive was 0.27 (95% CI 0.09–0.55), while the probability that it would be negative was 0.73 (95% CI 0.45–0.91) (Table III). Moreover, for any particular positive test result, the probability of a true positive was 1.00 (95% CI 0.40–1.00), and the probability of a false positive was 0 (95% CI 0–0.60) (Table III). Finally, for any particular negative test result, the probability of a true negative was 0.64 (95% CI 0.32–0.88), while the probability of a false negative was 0.36 (95% CI 0.12–0.68). The sensitivity of post-swallowing apnoea for penetration/aspiration was 0.67 (95% CI 0.24–0.94), and the specificity was 1.00 (95% CI 0.56–1.00) (Table IV).
| Table III. Variations in mean duration of the swallowing sounds (DSS) in different published series of healthy volunteers according to the volume and consistency of the bolus |
| Bolus consistency | Reference | DSS (msec) Mean (SD) | Max–Min | p-value | T |
| Solid | Present study Youmans & Stierwalt (10) | 575.7 (90.3) 570 (130) | 721.0–311.0 800–250 | < 0.767 | 0.30 |
| Semi-solid | Present study Youmans & Stierwalt (10) | 730.8 (72.2) 530 (130) | 944.0–574.0 790–260 | < 0.0005 | 10.96 |
| Semi-liquid | Present study Youmans & Stierwalt (10) | 564.2 (168.2) 550 (110) | 911.0–245.0 770–300 | < 0.523 | 0.64 |
| Liquid | Present study (10 ml) Youmans & Stierwalt (10) (5 ml) | 438.1 (109.6) 490 (130) | 714.0–276.0 800–250 | < 0.01 | 2.58 |
| Table IV. Negative/positive predictive values of post-swallowing apnoea for penetration/aspiration in 15 neurological patients with dysphagia verified by fibreoptic endoscopic evaluation of swallowing |
| | Penetration/aspiration | |
| | Present n = 8 | Absent n = 7 | |
| Post-swallowing apnoea present | 4 patients | – | Total who test positive: 4 patients |
| Post-swallowing apnoea absent | 4 patients | 7 patients | Total who test negative: 11 patients |
| For any particular test result, positive: 0.27 (95% CI 0.09–0.55); negative: 0.73 (95% CI 0.45–0.91). For any particular positive test result, true positive: 1.00 (95% CI 0.40–1.00); false positive: 0 (95% CI 0–0.60). For any particular negative test result, true negative: 0.64 (95% CI 0.32–0.88); false negative: 0.36 (95% CI 0.12–0.68). Sensitivity: 0.67 (95% CI 0.24–0.94); specificity: 1.00 (95% CI 0.56–1.00). CI: confidence interval. |
Eight patients with dysphagia affected by stroke (age range 57–81 years, 5 men and 3 women) were enrolled in 2 different groups. Group A comprised 5 subjects with oral phase disorder; all patients had episodes of penetration/aspiration verified by FEES (one patient had post-swallowing aspiration with effective cough and apnoea of 720 msec, one patient had post-swallowing penetration with effective cough and apnoea, one patient had post-swallowing penetration with non-effective cough and apnoea of 852 msec after the fourth swallow, one patient had pre-swallowing aspiration with effective cough and without apnoea, and one patient had pre-swallowing aspiration with non-effective cough and without apnoea). Group B comprised 3 patients without oral phase disorder; all patients had episodes of penetration/aspiration verified by FEES (one patient had post-swallowing penetration with effective cough and apnoea of 1267 msec, one patient had intra-swallowing aspiration with cough, and one patient had had intra-swallowing penetration with cough). In Group B there were pathological results even with a normal number of swallowing acts. The acoustic analysis recorded in one of patients in Group B is represented in Fig. 1(B). A normal DSS (506 msec) with a long apnoea (1267 msec) and cough was present in this patient affected by post-swallowing dysphagia, while longer and irregular DSS were present in the other 2 patients in Group B with cough that developed immediately after swallowing (data not shown). Fig. 1(B) reports the most important object of our investigation: the post-swallowing phase of the respiratory cycle recovery. Fig. 1(B) also reports the pre-swallowing phase characterized by regular respiratory cycles. This patient had a post-swallowing dysphagia with non-effective cough. Acoustic analysis showed in this patient a period of apnoea before cough. This feature leads us to consider this patient at higher risk for penetration/aspiration and pneumonia, as confirmed by our above-cited findings. The subsequent FEES confirmed this increased risk.
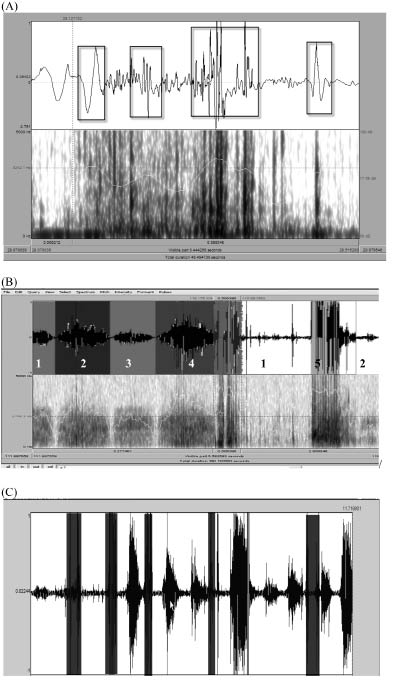
Fig. 1. (A) Acoustic analysis of a swallow of 10 ml water recorded in a healthy subject: oscillogram (upper), spectrogram (lower). The duration of the swallowing sound (DSS) was 444 msec. In this figure, 4 bursts divided by mute intervals are indicated by boxes of sound. The greater density of frequency was present in the 2 central bursts, which characterized both acoustic and spectrographic aspects of the sound. (B) Acoustic analysis of a swallow of 10 ml water and pre- and post-swallowing respiratory phases recorded in a stroke patient (patient 1: oscillogram (upper), spectrogram (lower). A normal DSS was present (506 msec) affected by a post-swallowing dysphagia, with a long apnoea and non-effective cough. The figure shows the pre-swallowing respiratory phase characterized by regular respiratory cycles. Acoustic analysis showed an apnoea enough long before cough. First grey section: pre-swallowing inspiration; second grey section: pre-swallowing expiration; third grey section: swallowing; first white section: apnoea; fourth grey section: cough; second white section: sequence of expiration and inspiration. (C) Acoustic analysis of a swallow of 10 ml water recorded in a patient with amyotrophic lateral sclerosis (patient 15) (spectrographic analysis). Grey sections: swallowings, differentiated from those of healthy subjects only by duration (DSS: 437, 322, 433, 370, and 592 msec). First white section: sequence of expiration, inspiration, and expiration; second white section: apnoea; third white section: sequence of inspiration, expiration, and inspiration; fourth white section: sequence of inspiration, expiration, inspiration, and expiration; fifth white section: sequence of apnoea, expiration, inspiration, and expiration; sixth white section: sequence of expiration and inspiration. It was also possible to observe that the patient needed to breathe between each swallowing and that his breath became progressively deeper; a sign of fatigue and difficulty during swallowing.
Furthermore, we evaluated the DSS of a 56-year old female patient affected by myasthenia gravis. The protocol provided for an acoustic analysis of swallowing sounds in the morning (09.00 h) and the afternoon (16.00 h). The patient swallowed 5 boluses of 10 ml water with less than 1 min break between them. There was an important difference between these 2 evaluations: the DSS of the first bolus at 09.00 h was 451 msec compared with the first swallow of the afternoon, which was 785 msec; the DSS of the last deglutition of the morning was 707 msec, while the DSS of the last 2 boluses at 16.00 h were 823 msec. The DSS became longer between the first and the last boluses, both at 09.00 h (from 451 msec to 707 msec) and 16.00 h (from 785 msec to 823 msec). The DSS showed, at 16.00 h, the same values as those for a patient over 70 years of age, although the subject was only 56 years old.
Furthermore, we evaluated the DSS of 2 patients (a 78-year-old man and a 76-year-old woman) affected by idiopathic PD (Hoehn & Yahr (H&Y) stage III, F patient; H&Y stage IV, M patient). The DSS were particularly long (1167 and 1206 msec), but we did not verify episodes of penetration/aspiration with FEES. Finally, 4 patients (patients 12–15) affected by ALS (3 females and one male, age range 51–73 years, mean baseline score of the ALS-FRS: 30 ± 4.7, range 0–40 points) presented bulbar signs and dysphagia with oral phase disorder. Swallowing events/swallowing sounds increased according to the severity of the disease and the oral phase of swallowing worsened. Fig. 1(C) shows a spectrographic analysis of swallowing sounds recorded in a patient with ALS who was more disabled than others. It can be seen that the patient needs to breathe between one deglutition and another, and his breath progressively becomes deeper, a sign of fatigue and difficulty during swallowing. Nonetheless, in these patients, episodes of penetration/aspiration were not reported.
DISCUSSION
The present study assessed a new technique, using a microphone and a notebook computer system, for acoustic analysis of the swallowing sounds of 4 types of bolus (solid, semi-solid, semi-liquid, and liquid) in healthy subjects, according to age and sex. In particular, a significant increase in DSS and PF was found with increasing age. None of the variables differed significantly as a function of sex, except for PI, for which we found an interaction by age and sex. The same acoustic analysis was performed in patients with dysphagia who were affected by neurological diseases, using a liquid bolus. The mean DSS of neurological patients with dysphagia and healthy patients was significantly different for a liquid bolus of 10 ml water. We also described neurological patients with dysphagia patterns of swallowing sounds, and tested the negative/positive predictive values of post-swallowing apnoea for penetration/aspiration, as verified by FEES.
Several studies allowed us to identify an acoustic profile for normal swallowing, which could be compared, successively, with dysphagic swallowing (7). Other studies evaluated this technique, using different recording protocols (i.e. the position of the subject during testing, the type and location of the transducer, the consistency and volume of the bolus ingested, and various techniques for treating the signal) (6, 17, 18). In the present study, we used a microphone, and our results correlated with other studies: less viscous boluses and liquid boluses had a shorter time of pharyngeal transit than semi-solid boluses (19). Our data correlated with the results of other studies of the DSS (6, 8, 17, 18) and of the relationship between increasing age and extension of the DSS (8, 9). There was no significant relationship between DSS and gender (20, 22), but our data differed from those of Youmans & Stierwalt (10) on the DSS for semi-solid and liquid bolus consistency. For liquid boluses, the difference may depend on different bolus volumes (10 ml vs 5 ml volume) (Table III). It has been demonstrated that the DSS varied according to the bolus volume and decreased with an increase in bolus consistency (8, 23, 24). Furthermore, in our study, the DSS of semi-solid boluses was higher than that in the study by Youmans & Stierwalt (10). The difference may depend on the type of foods used. Youmans & Stierwalt used apple sauce for the semi-solid bolus, which is more liquid and less viscous than the pudding used in our study, and even more liquid than the puree (generally included in the semi-solid boluses). In contrast, there were few differences between our data and those of Youmans & Stierwalt for semi-liquid and solid boluses despite the use of 2 different types of semi-liquid bolus, which differed in viscosity (we used yogurt and Youmans & Stierwalt used honey) (10). For our solid bolus (a 5 g piece of bread vs 3 small bites of diced canned pears), there was an oral phase much longer than the deglutition.
In the present study, the mean PI collapsed across various types of boluses was 31.6 dB, with little variation in relation to age, sex, and bolus consistency. Other studies also found a stable PI in relation to age and bolus consistency (6, 8, 10), but the mean values of PI were very heterogeneous (2, 5). In the present study the mean PF collapsed across bolus types was 3204.8 Hz, which increased with age, in contrast to the results of other studies (8, 10). Also, the mean PF for various boluses differed from those reported by other authors (8, 10). Possible explanations for the different results for PI and PF among several studies were related to the use of a different instrumental signal detection and its placement. Cichero & Murdoch (25) demonstrated that the microphone possessed the best signal-to-noise ratio. The accelerometer must adhere perfectly to the appropriate recording site; the quality of the adhesive could attenuate low intensity sounds, such as those produced by swallowing, thus altering the results (8). The best signal-to-noise ratio was obtained when the microphone was placed on the skin overlying the lateral border of the trachea, directly under the inferior border of the cricoid, as in the present study (6).
The proposed non-invasive, acoustic-based technique associated with the clinical assessment may be useful in classifying dysphagia. The DSS is longer or shorter in pathological patients than in healthy subjects according to age, and post-swallowing respiration is often altered (i.e. patients affected by post-swallowing dysphagia present a longer post-swallowing apnoea). One feature of this instrument was to count one by one the swallowing acts of a small bolus volume. We observed that the more numerous the swallowing acts, the more serious were the disorders of the oral phase of swallowing. The disorder of the oral phase is often proportional not only to the severity of dysphagia, but also to the disorder of the laryngeal phase and the coordination of respiration and swallowing. Moreover, it was important that recording included pre- and post-swallowing phases that could provide more elements about the timing of the oral phase and the coordination of respiration and deglutition.
Some limitations of the present study must be considered. The numbers of healthy subjects and patients with dysphagia affected by neurological diseases in this study were relatively small. Furthermore, no re-examination with a follow-up period of sufficient length was performed to evaluate further the predictive value of pathological pattern of swallowing sounds for penetration/aspiration. We obtained the DSS only for a liquid bolus of 10 ml water and not for other consistencies in describing the acoustic analysis patterns of neurological patients with dysphagia. The PF and PI variables showed a large degree of variability in these patients. In addition, since the present study did not randomize or blind the acoustic recordings that were rated, there was large potential for bias. Finally, our cross-sectional evaluation also showed that post-swallowing apnoea has a high specificity, but a rather low sensitivity, for prediction of penetration/aspiration in neurological patients with dysphagia. Furthermore, the FEES was completed after the acoustic analysis; if the FEES was concurrent with acoustic sampling we would have a stronger case for our interpretation of the results for the positive and negative predictive values. The findings of the present report are encouraging, but further studies using larger samples of neurological patients with dysphagia, and follow-up examinations, are required.
In conclusion, the proposed technique for recording and measuring swallowing sounds could be incorporated into the bedside evaluation, but it should not replace the use of more diagnostic and valuable measures. The technique could be useful in monitoring the efficacy of swallow rehabilitation with dietetic and postural compensation strategies through the calculation of swallowing acts, comparing the DSS of patients with dysphagia with that of healthy subjects, or observing the recovery of the correct post-swallowing respiratory cycle.
ACKNOWLEDGEMENT
The authors wish to the thank Dr S. Abrusci for her help in editing the manuscript.
REFERENCES

