OBJECTIVE: To evaluate the effects of systematic co-operation among municipal employees on the number of sick-leave days per month and the type of benefit granted by the Social Insurance Office. A further aim was to evaluate the economic consequences for society.
DESIGN: A 6-year follow-up study with a matched-pairs design.
METHODS: Days on sick-leave were calculated for each subject one year before the intervention started and yearly for the following 6-year period. Statistical mixed-model analysis was used. The economic benefit of the intervention was estimated as the increased production stemming from fewer days on sick-leave.
SUBJECTS: Sixty-four employees on long-term sick-leave were individually matched with controls from another Social Insurance Office in a county with a socioeconomic structure similar to that of the study group.
RESULTS: The study group had 5.7 fewer days on sick-leave per month and person over the 6-year period (p = 0.003). The estimated average economic benefit of the intervention was €36,600 per person over the 6-year period. In conclusion, those who received systematic co-operation in vocational rehabilitation had fewer days on sick-leave than their “treatment-as-usual” peers. This effect persisted over 6 years, generating substantial net economic gains for society.
Key words: vocational rehabilitation, sick-leave, longitudinal studies, economics, intervention studies, return to work, co-operation.
J Rehabil Med 2008; 40: 628–636
Correspondence address: Jenny Kärrholm, Department of Rehabilitation Medicine, Danderyd Hospital, Building 39, 3rd floor, SE 182 88 Stockholm, Sweden. E-mail: jenny. karrholm@ki.se
Submitted August 1, 2007; accepted April 4, 2008
*This paper was presented as an abstract and a poster on the 4th World Congress of the International Society of Physical and Rehabilitation Medicine (ISPRM), 10–14 June 2007 in Seoul, Korea.
Introduction
Sickness absence is a considerable public health problem and economic strain on the welfare state in Sweden and other western societies (1–3). Despite the consequences for individuals excluded from the labour market and for the community in terms of large costs and reduced production, there has been little research into effective vocational rehabilitation (4). However, vocational rehabilitation management models have been published in Europe (5). Gobelet et al. (6) state that a multidisciplinary approach and active collaboration between all parties involved in the rehabilitation process are needed in order to obtain successful vocational rehabilitation. A few multidisciplinary team-based rehabilitation programmes reporting successful return to work outcome have been evaluated (7–11). However, often the conclusion is drawn that co-operation between all rehabilitation actors, not only between different professions within the same organization, is important and must be improved in order to promote return to work (9, 12–15). Lack of co-operation between different rehabilitation actors is reportedly a frequent obstacle (8, 16–18). However, scientific studies of co-operation interventions in vocational rehabilitation are scarce and the effects on return to work outcomes have been disputed.
One intervention studied was the Stockholm Co-operation Project, 1997–99. This project sought to help people on long-term sick-leave employed by the Municipality of Stockholm, Sweden, to return to work; an additional aim was to develop more effective co-operation routines for vocational rehabilitation between employer, occupational health service and social insurance office, termed systematic, multi-professional, multi-sectoral, client-centred and solution-oriented co-operation in vocational rehabilitation (SMVR co-operation). This form of co-operation differs essentially from conventional co-operation (co-operation “treatment-as-usual“), which is less structured and less consistent, where multi-professional meetings are arranged ad hoc with different parties involved, with different aims for the vocational rehabilitation, in different settings and only if necessary. Problems are usually more in focus than solutions, and the different parties involved serve different goals. Several co-operative interventions are also only multi-professional, not multi-sectoral.
The SMVR co-operation intervention consisted of: an educational activity for the employees’ immediate superiors; a thorough medical examination of the employee and an assessment of the employee’s attitudes toward sick listing and disability pension, which was carried out at the occupational healthcare unit; and meetings with the SMVR team in which rehabilitation activities were planned and followed-up. The educational activity was a 1-day training course targeting all immediate superiors employed at the 2 municipal departments involved in the SMVR co-operation. This training focused on returning to work, social insurance, legislation, the employer’s responsibility in rehabilitation, the work environment, rehabilitation methods, medical aspects and rehabilitation economy. A thorough medical examination of the employees by the occupational health service physicians preceded the SMVR team meetings. Previous investigations and treatment by other healthcare providers were analysed and patients were referred to other medical care providers when it was deemed necessary. Rehabilitation problems were discussed with other members of staff at the occupational healthcare unit (nurse, social scientist, ergonomist, work environment engineer). Where appropriate, the employee was referred to the particular SMVR team. The SMVR co-operation team consisted of 2 representatives from the employer (head of human resources and an officer from the department of human resources), 2 officers from the social insurance office, one of the occupational health service physicians representing the occupational health service, and the employee. Sometimes a representative from the union or some other support person was also included at the request of the employee. The SMVR co-operation was unique in that the same officials represented the social insurance office irrespective of where the employee lived. This was not the case in conventional co-operation in vocational rehabilitation at that time. The team met every 2 weeks on common premises to discuss individual cases in the presence of the client. The participants (employees) in the SMVR co-operation met the team as often as they needed, which is why the number of team meetings varied from case to case; depending on the complexity of the problems they ranged from one to several meetings. Follow-up meetings were subsequently scheduled regularly. Detailed rehabilitation plans involving joint objectives and planning of rehabilitation measures were drawn up at these meetings. The rehabilitation measures affected were, for example, job training, training courses, pain management and vocational guidance, etc. Only ordinary rehabilitation activities were obtainable, since no extra funding was available in this project, but it is highly probable that a substantially larger number of measures were put into effect compared with conventional vocational rehabilitation. The team developed a common platform with better understanding of each other’s roles and cultures, and this contributed to achieving common goals and greater efficiency (19–21). It had been shown previously that SMVR co-operation significantly decreased the number of days on sick-leave one year after the intervention compared with matched controls, who underwent conventional rehabilitation (22).
It is not yet known what are the long-term effects of such co-operative interventions in vocational rehabilitation, or for how long the effects last. The present aim was therefore to evaluate, over a 6-year follow-up period, the effects of systematic co-operation between employer, occupational health service and social insurance office on the number of sick-leave days and its economic consequences, and on the types of benefit, among municipal employees.
material and methods
Research design
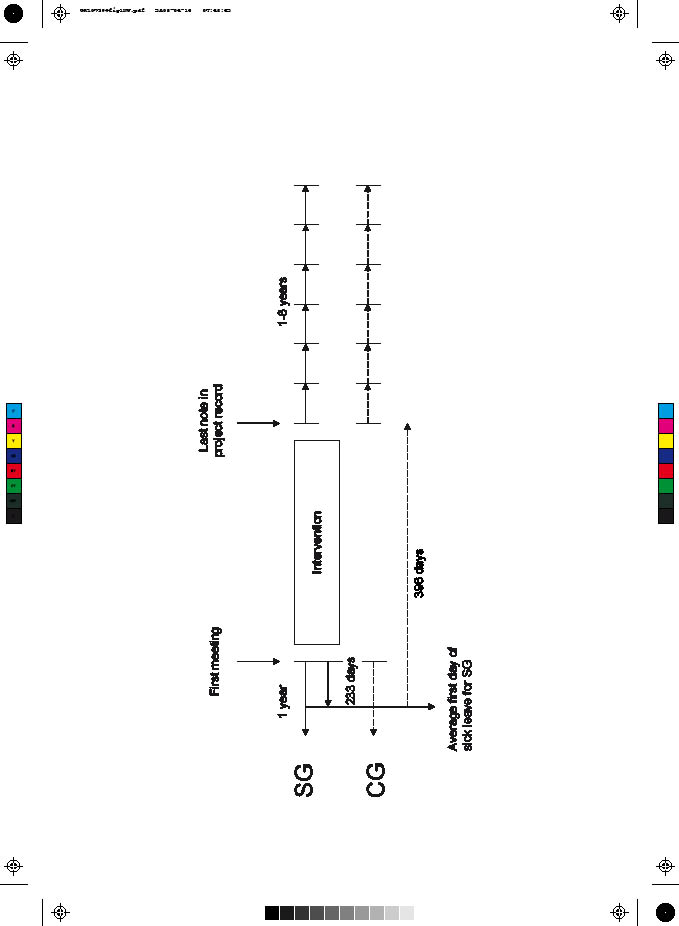
The study group (SG) was individually matched on crucial criteria with controls (control group, CG) from the register of the Swedish National Social Insurance Board, creating 64 pairs. Days on sick-leave were calculated for each subject one year before the intervention started and yearly for the 6-year period starting immediately when the intervention ended (Fig. 1). The study was approved by the ethics committee at the Karolinska Institutet.
Fig. 1. Design of time points for comparability between study group (SG) and control group (CG). The starting and finishing points for the CG were set to 233 days and 396 days, respectively, after the first day on sick leave; based on the SG’s average number of days for the equivalent time periods (Modified from Kärrholm et al., 2006 (22)).
Subjects
Sixty-four municipal employees in the Stockholm Co-operation Project, who were either on long-term sick-leave or had a history of long-term sick-listing or of many short periods, requiring multi-professional rehabilitation skills prior to return to work, and who had not received disability pensions, were chosen for the SG (22). Three subjects had had less than one day of sick-leave per month the year prior to the intervention, but they had had long-term sick listing periods or many short periods previously and were still considered by the employer to be at risk of being sick-listed in the future.
The 64 controls were selected for the CG from a Stockholm County Social Insurance Office (Sollentuna) with a socioeconomic structure similar to that of Stockholm Municipality. Crucial matching criteria were: municipal employment, similar numbers of sick-leave days (± 30%) during 12 months before starting point, similar dates of estimated starting point (± 7 months), no permanent disability pension, extent of employment ± 20% and not included in the SG or with a diagnosis precluding normal vocational rehabilitation, e.g. cancer with metastases. The CG underwent ordinary rehabilitation and some conventional co-operation or meetings with more than one professional. The selection of controls is described in detail elsewhere (22).
At the group level other background variables were also similar. The typical subject was female, married, 48 years old, had Swedish citizenship, had a university/high school education, was diagnosed with musculoskeletal conditions and injuries, with a yearly income of €22,000 and a median of 8.5 days on sick-leave per month one year before the intervention. Background variables and matching procedure have been described further elsewhere (22).
Due to differing medical settings in the 2 groups, the diagnoses were not completely comparable. Occupational health service physicians gave the SG their diagnoses prior to the intervention, while diagnoses for the CG were obtained from medical certificates from different primary medical care centres and hospitals. Musculoskeletal conditions and injuries were the most common reported diagnosis in both groups (38% in SG and 39% in CG) and psychiatric diseases and disorders were the second most common (31% in SG and 27% in CG), which is similar to the distribution of diagnoses among people on long-term sick-leave in general (3). However, 5 more persons reported fibromyalgia syndrome or widespread persistent pain in the SG than in the CG. In the SG 7 persons reported alcohol or drug abuse compared with none in the CG. In addition, 15 cases in the SG compared with none in the CG reportedly had burnout problems (fatigue) and were categorized as “other medical condition”. The SG reported 4 more low-back problems, and some of the psychiatric cases were diagnosed as mental insufficiency (22).
During the 6-year follow-up period, 8 individuals in the SG and 12 in the CG had left due to take-up of old-age pension and 2 individuals in the SG had died. Forty-six pairs remained in the sixth year of follow-up (Table I). A drop-out analysis of the 18 pairs showed no systematic difference in the distribution of women, yearly income, the number of sick-leave days per month the year prior to the intervention, civil status, citizenship, categorized diagnosis, or educational level. However, the mean age of the drop-outs was 52 years for the SG and 56 years for the CG, in comparison with 47 and 49 years, respectively, for the whole group.
| Table I. Number of remaining pairs allowing for old-age pensions and deaths during 6 years of follow-up, after the end of intervention. New cases per year (accumulated value) |
| | 1st year | 2nd year | 3rd year | 4th year | 5th year | 6th year |
| SG | CG | SG | CG | SG | CG | SG | CG | SG | CG | SG | CG |
| Old-age pension | 0 | 0 | 2 | 1 | 1 (3) | 1 (2) | 4 (7) | 4 (6) | 1 (8) | 4 (10) | 0 (8) | 2 (12) |
| Death | 0 | 0 | 0 | 0 | 1 (1) | 0 (0) | 0 (1) | 0 (0) | 1 (2) | 0 (0) | 0 (2) | 0 (0) |
| Remaining pairs | 64 | 61 | 59 | 52 | 48 | 46 |
| SG: study group; CG: control group. |
Procedures
Data for the 1-year period before the intervention and the 1-year period afterwards were collected in 2000. Supplementary sick-listing records for the subsequent 5 years were collected at the end of 2004 and at the beginning of 2005. Records in the Stockholm Co-operation Project provided personal data for the SG. The social insurance office archives with non-computerized individual data for the corresponding period (1997–99) were searched. From a large number of boxes, 108 boxes with records covering the time period 1997–99, which was equivalent to the SMVR co-operation period, were selected at random. Cases were drawn consecutively until 64 matched controls (CG) were found. Sick-listing records for both the SG and CG were then collected from the Swedish National Social Insurance Board registers by social insurance officials (22).
From the sick-listing records the outcome measure “days on sick-leave per month” was summed for the 1-year period before the intervention and yearly during the 6-year period of follow-up. Days on sick-leave included days for which sickness allowance, rehabilitation allowance and temporary or permanent disability pension was paid. Partial benefits were re-calculated to full days. The SG was divided into 2 subgroups, by the median number of sick-leave days per month and person one year before the intervention. One (subgroup L, 32 pairs) had fewer than 8.5 days sick-leave per month during the year prior to the intervention and the other (subgroup M, 32 pairs) had more than 8.5 days sick-leave per month (22).
In the SG the first meeting with the multi-professional co-operation team was considered the starting point and the day of the last note in the project record as the finishing point. The outcome measure for each individual was summed for the 1-year period before the starting point of the intervention and yearly for each of 6 years after the finishing point. To achieve comparable durations for the CG, the average times from the first day of sick-leave to the SG’s starting and finishing points were used. The starting and finishing points for the CG were set to 233 and 396 days, respectively, after the first day on sick-leave (22; Fig. 1 modified).
Economic methods
There are several benefits and costs to consider in evaluating economic consequences of a rehabilitation intervention, but one of the most important is the creation of “healthy time” (23). Since more time can be spent working, society as a whole benefits from production gains as well as from the increase in the patient’s quality of life. No extra funding was raised for the Stockholm Co-operation Project and for this reason no additional costs were considered. Only reduced production loss stemming from an increase in time used for work, i.e. decrease in sick-leave, was used in estimating the economic effect.
The reduction in production associated with sick-leave is the employee’s contribution to overall production had he or she been at work. The contribution to overall production is measured by the employer’s costs for employing the individual. These costs consist mainly of wage costs, but may also involve other costs associated with employment, such as costs for hiring and supervision (23). The wage cost was measured here as the employee’s registered yearly income qualifying for sickness benefit multiplied by 1.40 to cover payroll taxes, approximately 40%. We take the estimated difference in sick-leave days per month and person between SG and CG for the 6-year period as the average effect of the intervention. To translate this into an estimate of the average economic benefit of the intervention, we multiply this difference with the SG’s average wage cost in constant 2005 prices. The estimated daily wage 1999 was converted into 2005 prices using the gross domestic product (GDP) deflator (which was 1.087 according to Statistics Sweden). The wage costs in SEK were then converted into Euros by multiplying with the average €/SEK exchange rate in 2005 (which was 0.1077 according to the Swedish Riksbank; €1 = 9.29 SEK).
Statistical methods
Similarities in background variables (gender, civil status, categorized citizenship: Swedish, naturalized and foreign, educational level, diagnosis, age, yearly income and days on sick-leave per month during the year prior to the intervention) between SG and CG were investigated previously and have been described in detail elsewhere (22).
A mixed-model analysis using Procedure Mixed in SAS 9.1 was used for analysing repeated measures over 6 years. The advantage of the Procedure Mixed is that all subjects contribute with information for as long as they possibly can until exclusion caused by receipt of old-age pension or death. The between-groups factors were Group (SG and CG) and Subgroup (M group and L group), and the within-groups factor was Time (1st, 2nd, 3rd, 4th, 5th and 6th year after intervention). A prerequisite of normal distribution was fulfilled for SG and CG together. The baseline was set to the 1-year period before the intervention and the model was based on differences from baseline. Hence negative values indicate a decrease in days on sick-leave and positive values indicate an increase. The analysis was also conducted excluding 3 pairs with less than one day on sick-leave per month (n = 61 pairs), but this did not affect the results. The covariance structure was set to unstructured and autoregressive. Level of significance was set to p = 0.05. Since the Subgroup × Group × Time interaction was significant (p = 0.0437), the time effect was analysed within each Subgroup × Group. The p-values were then corrected according to the Bonferroni procedure (24); since there were many estimated means, confidence intervals for them were calculated with 99% confidence.
The Mixed-model analysis does not require complete data from all subjects and therefore all the 64 pairs contribute to the estimates. The results from the Mixed-model give more appropriate estimates of the effect and their standard errors.
The Marginal Homogeneity Test was used to analyse differences in a cross-sectional sample of types of benefit between the SG and the CG on the exact day 1, 2, 3, 4, 5 and 6 years after the end of the intervention. In the analyses, the categories “No benefits” and “Old-age pension”, “Full benefits” and “Partial benefits” and “Full disability pension” and “Partial disability pension”, respectively, were combined.
The level of significance was set to p ≤ 0.05. A sample size of 64 matched pairs will have 80% power to detect a difference in means of 5.350 the 1st year after the intervention, assuming a standard deviation of differences of 14.950, using a paired t-test with a 0.050 2-sided significance level.
Results
Effects on sick-leave
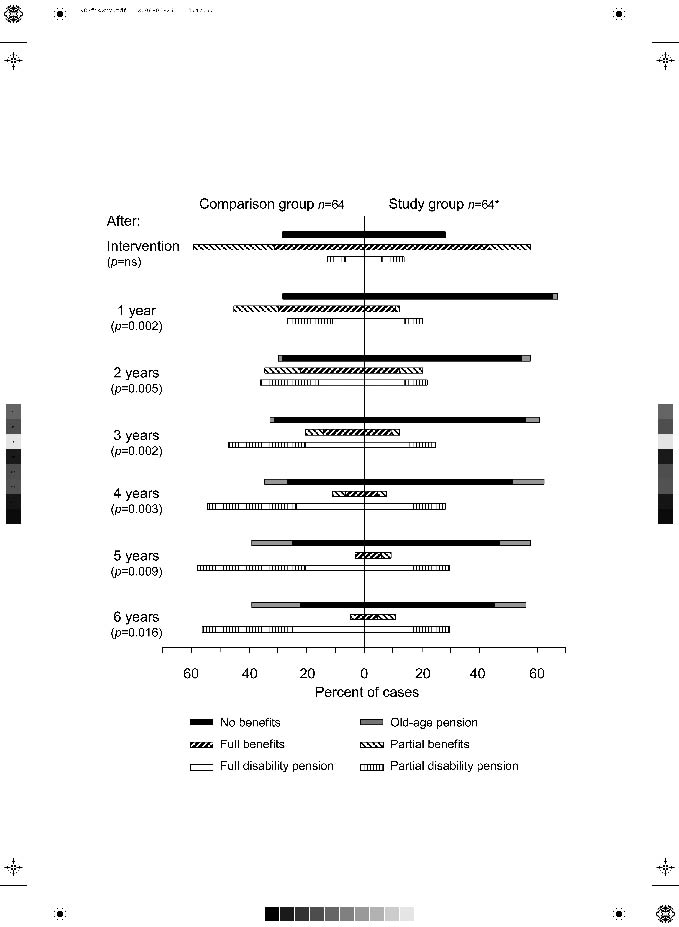
Significant differences between SG and CG in types of benefit measured on the same day each year were demonstrated during the 6-year follow-up period. However, the effect was not noticed when measured on the last day of the intervention. Black and checked bars in Fig. 2 represent “No benefits” or “Old-age pension” registered that day, and these bars favour the SG for all 6 follow-up years. The white and striped bars represent “Partial disability pension” and “Full disability pension” registered that day, favouring the CG for all 6 years.
Fig. 2. Cross-sectional sample of type of benefit for the time periods: last day of intervention and at exactly 1, 2, 3, 4, 5 and 6 years after intervention. Percentage (n = 64 + 64) (*excluded in the graph: 2 deaths during 3rd and 5th years of follow-up). Statistics: Marginal Homogeneity Test. ns: not significant.
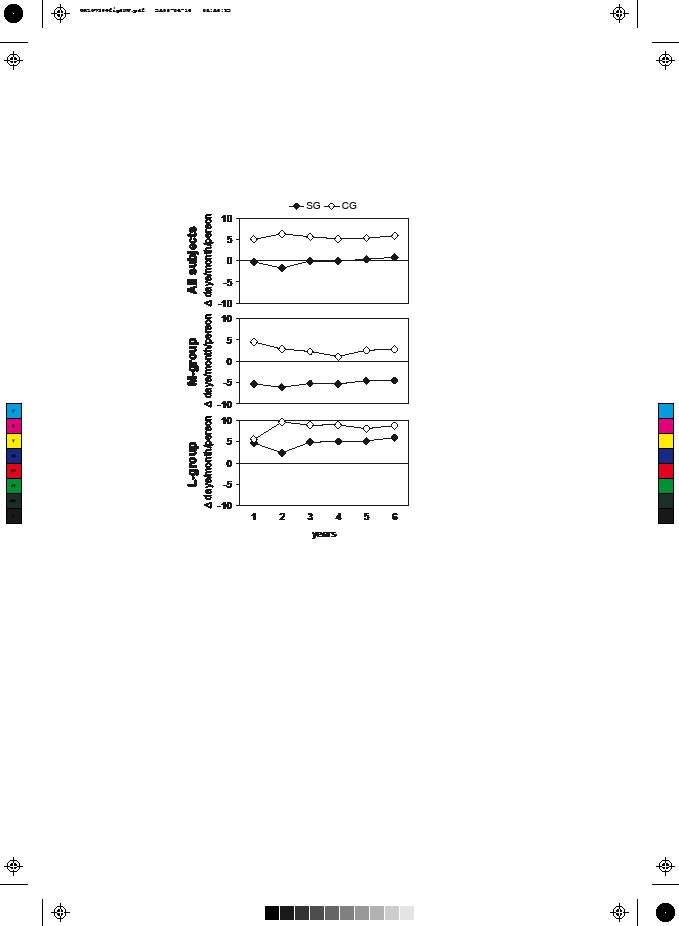
The mixed-model analysis revealed an overall significant difference between SG and CG of 5.7 days on sick-leave per month and person in comparison with baseline, the 1-year period before the intervention (95% confidence interval (CI): 2.04–9.46, p = 0.0030). That is, the difference in the change in the number of sick-leave days between the 2 groups was on average 5.7 days in the SG’s favour. No overall significant difference in time was detected, and therefore the difference in sick-leave was considered constant over the 6 follow-up years. The SG did not deteriorate as expected, but remained at the baseline sick-leave level for the entire period. In the CG, on the other hand, the number of days on sick-leave increased by 5.5 days per month and person already in the first year of follow-up and remained at that level for the next 5 years. An overall significant difference between subgroups was also found, where the M group decreased by 1.2 sick-leave days per month and person compared with baseline and the L group increased by 6.5 days per month and person (p < 0.0001) (Table II, Fig. 3).
| Table II. Overall analysis of factors Subgroup, Group and Time. Difference from baseline in days on sick-leave/month/person (n = 64 pairs) |
| Factors | | Estimated mean | 95% CI | p-value |
| Lower | Upper |
| Group (M + L groups) | | | | | 0.0030 |
| SG | –0.2242 | –3.4826 | 3.0342 | |
| CG | 5.5252 | 2.0263 | 9.0241 | |
| Subgroup (SG + CG) | | | | | < 0.0001 |
| M group | –1.2315 | –4.4981 | 2.0351 | |
| L group | 6.5325 | 3.2647 | 9.8003 | |
| Time (all subjects together) | | | | | 0.7805 |
| 1st year | 2.3632 | –0.1786 | 4.9051 | |
| 2nd year | 2.2338 | –0.3163 | 4.7840 | |
| 3rd year | 2.7466 | 0.1851 | 5.3082 | |
| 4th year | 2.4667 | –0.1277 | 5.0610 | |
| 5th year | 2.8072 | 0.1714 | 5.4430 | |
| 6th year | 3.2854 | 0.6106 | 5.9602 | |
| Statistics: Mixed procedure, SAS version 9.1. SG: study group; CG: control group; M group: subgroup with more than 8.5 days on sick-leave/month at baseline; L group: subgroup with fewer than 8.5 days on sick-leave/month at baseline. CI: confidence interval. |
No clear-cut relationship was found between factors Subgroup and Group. However, the results indicate an overall decrease for the SG M group by 5.2 sick-leave days per month and person (95% CI: –9.77 to –0.54) and an overall increase for the CG L group by 8.4 sick-leave days per month and person (95% CI: 3.40–13.31). The results also indicate a tendency to an interaction effect between the factors Group and Time (p = 0.0612). This could imply that both groups developed sick-leave over time differently; the difference between SG and CG being somewhat greater during the 2-year period than during the other periods of follow-up (Table III, Fig. 3).
| Table III. Analysis of 2-factor interaction. Difference from baseline in sick-leave days/month/person (n = 64 pairs) |
| Factors | Estimated mean | 95% CI | p-value |
| Lower | Upper |
| Subgroup × Group | | | | 0.2628 |
| M group × SG | –5.1559 | –9.7719 | –0.5398 | |
| M group × CG | 2.6928 | –2.2467 | 7.6324 | |
| L group × SG | 4.7074 | 0.1073 | 9.3075 | |
| L group × CG | 8.3576 | 3.4008 | 13.3144 | |
| Group × Time | | | | 0.0612 |
| SG × 1st year | –0.3128 | –3.8950 | 3.2693 | |
| SG × 2nd year | –1.8473 | –5.4445 | 1.7499 | |
| SG × 3rd year | –0.1339 | –3.7572 | 3.4894 | |
| SG × 4th year | –0.1186 | –3.7950 | 3.5578 | |
| SG × 5th year | 0.2858 | –3.4389 | 4.0106 | |
| SG × 6th year | 0.7814 | –2.9791 | 4.5419 | |
| CG × 1st year | 5.0392 | 1.1732 | 8.9052 | |
| CG × 2nd year | 6.3150 | 2.4411 | 10.1889 | |
| CG × 3rd year | 5.6272 | 1.7474 | 9.5069 | |
| CG × 4th year | 5.0519 | 1.1345 | 8.9694 | |
| CG × 5th year | 5.3286 | 1.3456 | 9.3115 | |
| CG × 6th year | 5.7894 | 1.7361 | 9.8427 | |
| Statistics: Mixed procedure, SAS version 9.1. SG: study group; CG: control group; M group: subgroup with more than 8.5 days on sick-leave/month at baseline; L group: subgroup with fewer than 8.5 days on sick-leave/month at baseline. CI: confidence interval. |
Fig. 3. Estimated means for study group (SG) and control group (CG) at each time point. Difference from baseline in days on sick-leave/month/person; negative values indicate a decrease in days on sick-leave and positive values indicate an increase. All subjects (n = 64 + 64). M group: subgroup with more than 8.5 sick-leave/days month at baseline (n = 32 + 32). L group: subgroup with fewer than 8.5 sick-leave days/month at baseline (n = 32 + 32)
A statistically significant interaction effect between the factors Subgroup, Group and Time was found (p = 0.0437). Further analyses of the time effect within each subgroup and each group showed no significant time effect for the M group, but a tendency was shown for the L group (p = 0.0592). Comparisons between time periods indicated further deterioration for the CG L group between the first and second follow-up years of by another 4 sick-leave days per month and person. This indicated effect persisted for the subsequent years (Fig. 2, Tables IV and V).
| Table IV. Analysis of 3-factor interaction. Difference from baseline in sick-leave days/month/person (n = 64 pairs) |
| | | 95% confidence interval |
| Factors | Estimated mean | Lower | Upper |
| Subgroup × Group × Time | | | |
| M group × SG × 1st year | –5.3385 | –10.4045 | –0.2726 |
| M group × SG × 2nd year | –6.0618 | –11.1702 | –0.9534 |
| M group × SG × 3rd year | –5.1863 | –10.3261 | –0.0465 |
| M group × SG × 4th year | –5.3155 | –10.5263 | –0.1047 |
| M group × SG × 5th year | –4.5783 | –9.8415 | 0.6849 |
| M group × SG × 6th year | –4.4547 | –9.7566 | 0.8473 |
| M group × CG × 1st year | 4.4528 | –1.0145 | 9.9202 |
| M group × CG × 2nd year | 2.9398 | –2.5276 | 8.4072 |
| M group × CG × 3rd year | 2.3223 | –3.1451 | 7.7896 |
| M group × CG × 4th year | 1.1124 | –4.4009 | 6.6256 |
| M group × CG × 5th year | 2.5781 | –3.0491 | 8.2054 |
| M group × CG × 6th year | 2.7516 | –3.0215 | 8.5248 |
| L group × SG × 1st year | 4.7129 | –0.3530 | 9.7788 |
| L group × SG × 2nd year | 2.3672 | –2.6987 | 7.4331 |
| L group × SG × 3rd year | 4.9185 | –0.1899 | 10.0268 |
| L group × SG × 4th year | 5.0784 | –0.1092 | 10.2660 |
| L group × SG × 5th year | 5.1500 | –0.1221 | 10.4221 |
| L group × SG × 6th year | 6.0175 | 0.6832 | 11.3518 |
| L group × CG × 1st year | 5.6257 | 0.1583 | 11.0930 |
| L group × CG × 2nd year | 9.6902 | 4.2006 | 15.1798 |
| L group × CG × 3rd year | 8.9320 | 3.4260 | 14.4381 |
| L group × CG × 4th year | 8.9914 | 3.4246 | 14.5583 |
| L group × CG × 5th year | 8.0790 | 2.4408 | 13.7173 |
| L group × CG × 6th year | 8.8271 | 3.1361 | 14.5181 |
| p = 0.0437 for the 3-factor interaction. Statistics: Mixed procedure, SAS version 9.1. SG: study group; CG: control group; M group: subgroup with more than 8.5 days on sick-leave/month at baseline; L group: subgroup with fewer than 8.5 days on sick-leave/month at baseline. |
| Table V. Analysis of indicated time effect (p = 0.0592) for the comparison group with less than 8.5 days on sick-leave/month at baseline. Difference from baseline in days on sick-leave/month/person (n = 32) |
| Time points | Estimated mean | 99% CI |
| Lower | Upper |
| 2nd year–1st year | 4.0645 | 1.1710 | 6.9581 |
| 3rd year–2nd year | –0.7582 | –3.6525 | 2.1362 |
| 4th year–3rd year | 0.0594 | –2.9268 | 3.0456 |
| 5th year–4th year | –0.9124 | –3.9502 | 2.1254 |
| 6th year–5th year | 0.7481 | –2.2922 | 3.7883 |
| Statistics: Mixed procedure, Tests of Effect Slices, SAS version 9.1. CI: confidence interval. |
Effects on production gains for society
Cost of employment was calculated as the mean of overall daily wage cost at starting point in constant 2005 prices, including payroll taxes of 40%:
((Mean yearly income × 1.40) / 365) × deflator.
SG wage cost: ((198,543.75 × 1.40) / 365) × 1.086995 = 827.79 SEK per day and person.
CG wage cost: ((188,347.14 × 1.40) / 365) × 1.086995 = 785.27 SEK per day and person.
The economic benefit of the intervention is based on the estimated impact in terms of a reduced number of sick-leave days. We assume that estimated difference in the change in sick-leave days between SG and CG on average captures the causal impact of the intervention on the number of sick-leave days. The calculations are thus based on a reduction in the number of sick-leave days as a consequence of the intervention equal to 5.7 per month and person (95% CI: 2.04–9.46) for the entire 6-year period. The CG wage cost exhibited little difference from the SG wage cost prior to the intervention.
The economic benefit in terms of the value of increased production was calculated as SG daily wage cost times 5.7 days per month and person. It was then calculated for one year as the economic benefit per month × 12, and the total benefit for the 6-year period as economic benefit per year × 6.
Economic benefit per month
827.79 × 5.7 = 4718.40 SEK (€508.17) per person
95% CI, lower bound: 827.79 × 2.0361 = 1685.46 SEK (€181.52) per month and person
95% CI, upper bound: 827.79 × 9.4627 = 7833.13 SEK (€843.63) per month and person
Economic benefit per year
4718.40 × 12 = 56,620.80 SEK (€6098.06) per person
95% CI, lower bound: 1685.46 × 12 = 20,225.52 SEK (€2178.29) per year and person
95% CI, upper bound: 7833.13 × 12 = 93,997.56 SEK (€10123.54) per year and person
Total economic benefit for the 6-year period
56,620.80 × 6 = 339,724.80 SEK (€36588.36) per person
95% CI, lower bound: 20,225.52 × 6 = 121,353.12 SEK (€13069.73) per person
95% CI, upper bound: 93,997.56 × 6 = 563,985.36 SEK (€60741.22) per person
According to these estimates, the economic benefit of the intervention for the whole SG group of 64 individuals for the 6-year period would be equal to the sum of economic benefit per year × “the number of individuals included” × “the number of years” (cf Table I):
56,620.80 × 46 × 6 = 15627340.80 SEK
56,620.80 × 2 × 5 = 566208.00 SEK
56,620.80 × 4 × 4 = 905932.80 SEK
56,620.80 × 7 × 3 = 1189036.80 SEK
56,620.80 × 2 × 2 = 226483.20 SEK
56,620.80 × 3 × 1 = 169862.40 SEK
= 18,684,864.00 SEK (€2,012,359.85)
Thus, the economic benefit of the actual intervention carried out is estimated as €2.0 million (18.7 million SEK) over a 6-year period.
Discussion
The results showed an overall difference of 5.7 days on sick-leave per month between the SG and the CG for the 6-year follow-up period. These results correspond to those of Jakobsson et al. (20) and Norrefalk et al. (25). Overall, the number of sick-leave days in the SG did not increase, but remained unaltered from baseline during all 6 years. The cross-sectional sample of types of benefit, on the other hand, showed an improvement among the SG, which lasted over the years. This was supported by the results of the mixed-model analysis, which indicated a decrease of 5.2 sick-leave days per month and person, constant over time, in the SG M group (subgroup with more than 8.5 days on sick-leave per month and person the 1-year period prior to the intervention).
The present study showed that the total economic gain of the SMVR co-operation was €36,500 per person over the 6-year period, i.e. approximately €2.0 millions for the SG group. No other benefits than productivity gains were calculated. Inflation was low during the 6 years and real wage growth was quite strong (26).
There were no additional costs for the SMVR intervention, thus this intervention should be quite easy to implement. In 2005, 175,000 people were sick-listed for at least 60 days in Sweden (27). According to previous Swedish reports (28, 29), one-fifth of the long-term sick-listed need vocational rehabilitation. Calculating the figures for 2005 would imply 35,000 people in need of vocational rehabilitation. If 80%, i.e. 28,000 people, were to benefit from SMVR co-operation, which is reasonable according to Jakobsson et al. (19), and if the SMVR co-operation model were implemented throughout Sweden, the economic gain for Swedish society would arguably amount to about €1000 million over a 6-year period (€36,588.36 × 28,000 people = €1,024,474,080). It no longer seems adequate to discuss the lack of resources in the welfare system, only how to spend existing resources more wisely. It is possible to argue that this effect is due to the selection of subjects and, in this case, perhaps fewer people would benefit from the SMVR intervention. In the SG there were more women than among people on sick-leave in general, the educational level was higher and psychiatric diseases and disorders were more common. Also all subjects were employed by the Stockholm Municipality. However, there were no statistically significant differences in this respect from the CG. One of the effects of the SMVR co-operation is probably that a better match of rehabilitation measures to the individual has been obtained. However, a more frequent decision to offer a rehabilitation measure than “treatment as usual” may have occurred. If so, it might have led to somewhat higher costs for the intervention group than the comparison group. But even if, for example, 25% more rehabilitation measures had been utilized for the intervention group, such costs become relatively small compared with the gain induced by reduced loss of production due to less sick-leave (7). Therefore, it would only reduce the gain marginally.
Since the SG individuals had complex problems and many sick-leave days prior to the intervention, it was expected that any effect would not persist for very long. Previous studies have shown that patients with many days of sick listing prior to vocational rehabilitation are more likely to be granted a disability pension and have less chance of resuming work (30–32). These results agree with those of the present CG, who had conventional co-operation. The CG increased their sick-leave by 5.5 days per month and person already in the first year after the intervention and then remained at that level for the subsequent 5 years. Also, the cross-sectional sample of types of benefit showed that more disability pensions had been granted in the CG than in the SG. It could be argued that the CG was, in this sense, more excluded from the labour market than the SG. Ahlgren et al. (33) showed that the majority of those on temporary disability pension do not resume work, but instead receive permanent disability pension.
We have previously argued that SMVR co-operation was most effective for the M subgroup (22). The present results also indicate that SMVR co-operation not only contributed to reducing the number of days on sick-leave per month for the M subgroup, but also to restraining the L subgroup from an escalation of days on sick-leave. This was demonstrated for the CG L group, with as much as 8.4 days sick-leave per month and person. Remember also that even the L subgroup had a high level of sick-leave to begin with, for which reason it is still possible to argue that SMVR co-operation is more effective for complex cases and people on long-term sick-leave.
Contradictory results have been shown in studies of co-operation interventions in vocational rehabilitation. Hultberg et al. (17, 34, 35), studying co-financed interdisciplinary collaboration teams with personnel from a primary healthcare, a social insurance office and social services, found no effects on health outcomes, days on sick-leave, healthcare utilization or costs for patients. But this collaboration included subjects at healthcare centres with new episodes of musculoskeletal problems and excluded those with more complex problems. The difference from the present results is arguably that this is due to differences in types of co-operation, outcome measures, target groups and time of evaluation. The results indicated that effects of SMVR co-operation on sick-leave may be found when participants with complex problems are evaluated at least one year after the intervention. This was also shown in recent studies (22, 36).
What makes the SMVR co-operation model successful? It is not possible to single out one significant component, but rather a combination. Common to co-operation models with positive outcomes are more extensive rehabilitation programmes and continuous and structured meetings between the same representatives or officials, to draw up long-term rehabilitation plans with common goals (19, 22, 25, 37, 38). No effects have been found for multidisciplinary interventions with only brief rehabilitation programmes (39, 40). It seems that in the SMVR co-operation a common platform develops, which enhances joint responsibility in finding individual solutions (21). During such co-operation focus is also on active rehabilitation plans instead of on administration or demarcation of one’s separate obligations. It is reasonable to believe that long-term rehabilitation plans in consensus between the different rehabilitation instances also result in long-lasting solutions. Another reason may be the involvement of the occupational health service. The assessment made of the employees in the beginning might have contributed to enhance their motivation.
In this study a matched design was chosen, in order to find a relevant comparison group due to crucial criteria. Often comparison groups are not so well defined, and conclusions may then be deceptive. However, no matching procedure is flawless, and a few differences between the SG and the CG remain to be considered. Kärrholm et al. (22) reported that more individuals were diagnosed with fatigue (burnout) syndromes, and were single, in the SG than in the CG. With respect to previous studies (31) this is considered a drawback for the SG. But there was also a slightly higher educational level in the SG, which is an advantage in vocational rehabilitation for resuming work (30, 31). One crucial criterion for matching was similarity in the “starting point”. This was important since many factors change over time and this is difficult to control for. A weakness is therefore the extension of the criteria with ± 7 months. During this study the sick-pay period changed in Sweden from 2 weeks to 4 weeks and then back again to 2 weeks. The matched pairs were controlled for having the same sick-pay period, why this does not assume to have an impact on the conclusions drawn from these results. The longer follow-up period the more uncontrolled life events may occur, having an impact on the results. However, we have no reason to believe there are any systematically errors between the SG and the CG contributing to the effect of the SMVR co-operation.
In this study the outcome measure is calculated for periods of time instead of cross-sections, which increases accuracy. Also, the registers used were of high quality, thus the information obtained should be accurate and if there were any systematic errors they should have affected both groups the same.
A weakness is that documentation of rehabilitation measures or activities was incomplete for the study group and the comparison group. This makes it impossible to draw conclusions about specific measures or activities. Conclusions must therefore be drawn from the whole intervention as a package. Since diagnoses were not quite comparable between the 2 groups and the number of subjects was small, it was not possible to perform analyses of diagnoses.
CONCLUSION
Even though only 128 individuals were included, the results concord with those of comparable studies and hence more generalized conclusions may be drawn:
• Systematic, multi-professional, multi-sectoral, client-centred and solution-oriented co-operation in vocational rehabilitation prevents sick-leave from escalating, especially for those with less than 8.5 days on sick-leave per month prior to the intervention.
• Systematic, multi-professional, multi-sectoral, client-centred and solution-oriented co-operation in vocational rehabilitation might reduce sick-leave for those with more than 8.5 days on sick-leave per month prior to the intervention.
• Without systematic, multi-professional, multi-sectoral, client-centred and solution-oriented co-operation in vocational rehabilitation, sick-leave is likely to increase and partial or full disability pensions are more likely to be granted.
• Systematic, multi-professional, multi-sectoral, client-centred and solution-oriented co-operation in vocational rehabilitation prevents the exclusion of people on long-term sick-leave from the labour market.
• To establish effects on sick-leave, rehabilitation should be evaluated after one year.
• The effect of the systematic, multi-professional, multi-sectoral, client-centred and solution-oriented co-operation in the vocational rehabilitation studied lasted for at least 6 years.
• The average economic benefit for the whole 6-year period of the systematic, multi-professional, multi-sectoral, client-centred and solution-oriented co-operation in vocational rehabilitation is estimated to about €36,600 per person subjected to the intervention. According to the estimates, with 95% probability the economic benefit lies within the interval between €13,100 and €60,700 per person for the whole 6-year period.
Acknowledgements
This study was supported by the Karolinska Institutet, Stockholm, Mid-Sweden University, and the Social Insurance Office in Stockholm, Sweden. The authors thank all those taking part in the Stockholm Co-operation Project, particularly Dr Katarina Greber, Ann Wastesson, Camilla Stendahl and Irma Hansson.
References
1. Whitaker S C. The management of sickness absence. Occup Environ Med 2001; 58: 420–424.
2. Mikaelsson B, Ekholm J, Kärrholm J, Murray R, Sandberg T, Söderberg J, et al. Den svenska sjukan II – regelverk och försäkringsmedicinska bedömningar i åtta länder. [The Swedish Sickness 2 – regulations and social insurance assessments in eight countries]. Stockholm: Socialdepartementet (Ministry of Health and Social Affairs); Ds 2003:63 (in Swedish, summary in English).
3. Alexanderson K, Norlund A, editors. Sickness absence – causes, consequences, and physicians’ sickness certification practice. A systematic literature review by the Swedish Council on Technology Assessment in Health Care. Scand J Public Health 2004; 32 Suppl 63: 12–30.
4. Alexanderson K, Hensing G. More and better research needed on sickness absence. Scand J Public Health 2004; 32: 321–323.
5. Gobelet C, Franchignoni F, editors. Vocational rehabilitation. Paris: Springer; 2006.
6. Gobelet C, Luthi F, Al-Khodairy AT, Chamberlain MA. Vocational rehabilitation: a multidisciplinary intervention. Disabil Rehabil 2007; 29: 1405–1410.
7. Norrefalk JR, Ekholm K, Linder J, Borg K, Ekholm J. Evaluation of a multiprofessional rehabilitation programme for persistent musculoskeletal-related pain: economic benefits of return to work. J Rehabil Med 2008; 40: 15–22.
8. Ektor-Andersen J, Ingvarsson E, Kullendorff M, Orbaek P. High cost-benefit of early team-based biomedical and cognitive-behaviour intervention for long-term pain-related sickness absence. J Rehabil Med 2008; 40: 1–8.
9. Tang D. Work injury rehabilitation in Guangzhou: 380 case cohort study. Work 2008; 30: 73–76.
10. Karjalainen K, Malmivaara A, van Tulder M, Roine R, Jauhiainen M, Hurri H, Koes B. Multidisciplinary bio psychosocial rehabilitation for subacute low back pain among working age adult. Cochrane Database of Systematic Reviews 2003; 3: CD002193; PMID: 10908528.
11. Drake RE, Becker DR, Bond GR, Mueser KT. A process analysis of integrated and non-integrated approaches to supported employment. J Vocational Rehabil 2003; 18: 51–58.
12. Killackey EJ, Jackson HJ, Gleeson J, Hickie IB, McGorry PD. Exciting career opportunity beckons! Early intervention and vocational rehabilitation in first-episode psychosis: employing cautious optimism. Austral NZ J Psychiatry 2006; 40: 951–962.
13. Heijbel B, Josephson M, Jensen I, Vingard E. Employer, insurance and health system response to long-term sick leave in the public sector: policy implications. J Occup Rehabil 2005; 15: 167–176.
14. Williams RM, Westmorland M. Perspectives on workplace disability management: a review of the literature. Work 2002; 19: 87–93.
15. Quinn PR. Returning to work after disability. Employee Benefits J 2002; 27: 13–17.
16. Lindqvist R, Grape O. Vocational rehabilitation of the socially disadvantaged long-term sick: inter-organisational co-operation between welfare state agencies. Scand J Public Health 1999; 1: 1–5.
17. Hultberg E-L, Lönnroth K, Allebeck P, Hensing G. Effects of co-financed interdisciplinary teamwork on sick leave for people with musculoskeletal disorders. Work 2006; 26: 369–377.
18. Van Duijin M, Miedema H, Elders L, Burdorf A. Barriers for early return-to-work of workers with musculoskeletal disorders according to occupational health physicians and human resource managers. J Occup Rehabil 2004; 14: 31–41.
19. Jakobsson B, Schüldt Håård U, Bergroth A, Selander J, Ekholm J. Improved cooperation in vocational rehabilitation with systematic rehabilitation group meetings. Disabil Rehabil 2002; 14: 734–740.
20. Jakobsson B, Bergroth A, Schüldt Ekholm K, Ekholm J. Do systematic multiprofessional rehabilitation group meetings improve efficiency in vocational rehabilitation? Work 2005; 24: 279–290.
21. Kärrholm J, Jakobsson B, Schüldt Håård U, Schüldt Ekholm K, Ekholm J, Bergroth A. The views of sick-listed employees’ immediate superiors on co-operation in vocational rehabilitation. Work 2007; 29: 101–111.
22. Kärrholm J, Ekholm K, Jakobsson B, Ekholm J, Bergroth A, Schüldt Ekholm K. Effects on work resumption of a cooperation project in vocational rehabilitation. Systematic, multi-professional, client-centred and solution-oriented co-operation. Disabil Rehabil 2006; 28: 457–467.
23. Drummond MF, O’Brien B, Stoddart GL, Torrance GW, editors. Methods for the economic evaluation of health care programmes, 2nd edn. Oxford: Oxford University Press; 1997.
24. Bland M, editor. An introduction to medical statistics, 3rd edn. Oxford: Oxford University Press; 2000.
25. Norrefalk J-R, Linder J, Ekholm J, Borg K. A 6-year follow up study of 122 patients attending a multiprofessional rehabilitation programme for persistent musculoskeletal-related pain. Int J Rehabil Res 2007; 30: 9–18.
26. SCB.se [homepage on the Internet]. Statistics Sweden. A central government authority for official statistics and government statistics [cited 2007 July 04]. Available from: http://www.scb.se/default____2154.asp
27. Försäkringskassan. Social insurance in Sweden 2006. Transition to adulthood. Stockholm: Försäkringskassan (Swedish Social Insurance Agency); 2006.
28. Socialförsäkringsutredningen. Rehabilitering – ett långt lidandes historia [Swedish Government Official Report. Rehabilitation – the history of long suffering]. Stockholm: Socialförsäkringsutredningen (Swedish Official Social Insurance Investigation); Samtal om socialförsäkring Nr 10 2006 (in Swedish).
29. SOU. Utredningen om den arbetslivsinriktade rehabiliteringen. Rehabilitering till arbete. En reform med individen i centrum [Swedish Government Official Report, Vocational rehabilitation. A reform with the individual in focus]. Stockholm: Fritzes. SOU 2000: 78 (in Swedish).
30. RFV. Sickness absenteeism and vocational rehabilitation in Sweden – a summary. In: Risk-frisk-faktorer, sjukskrivning och rehabilitering i Sverige (in Swedish summary in English) (Swedish National Social Insurance Board Report. Risk-well-factors, sick listing and rehabilitation in Sweden). Stockholm: NSIB. RFV Redovisar 1997: 6.
31. Selander J, Marnetoft S-U, Bergroth A, Ekholm J. Return to work following vocational rehabilitation for neck, back and shoulder problems: risk factors reviewed. Disabil Rehabil 2002; 24: 704–712.
32. Gjesdal S, Bratberg E. Diagnosis and duration of sickness absence as predictors for disability pension: Results from a three-year, multi-register based and prospective study. Scand J Public Health 2003; 31: 246–254.
33. Ahlgren Å, Broman L, Bergroth A, Ekholm J. Disability pension despite vocational rehabilitation? A study from six social insurance offices of a county. Int J Rehabil Res 2005; 28: 33–42.
34. Hultberg E-L, Lönnroth K, Allebeck P. Interdisciplinary collaboration between primary care, social insurance and social services in the rehabilitation of people with musculoskeletal disorder: Effects on self-rated health and physical performance. J Interprof Care 2005; 19: 115–124.
35. Hultberg E-L, Lönnroth K, Allebeck P. Effects of a co-financed interdisciplinary collaboration model in primary health care on service utilisation among patients with musculoskeletal disorders. Work 2007; 28: 239–247.
36. Norrefalk J-R, Svensson O, Ekholm J, Borg K. Can the back-to-work rate of patients with long-term non-malignant pain be predicted? Int J Rehabil Res 2005; 28: 9–16.
37. Storrö S, Moen J, Svebak S. Effects on sick-leave of a multidisciplinary rehabilitation programme for chronic low back, neck or shoulder pain: comparison with usual treatment. J Rehabil Med 2004; 36: 12–16.
38. Meijer E, Sluiter J, Fings-Dresen M. Evaluation of effective return-to-work treatment programs for sick-listed patients with non-specific musculoskeletal complaints: a systematic review. Int Arch Occup Environ Health 2005; 78: 523–532.
39. Bonde JP, Rasmussen MS, Hjölund H, Svedsen SW, Kolstad HA, Jensen LD, et al. Occupational disorders and return to work: A randomized controlled study. J Rehabil Med 2005; 37: 230–235.
40. Magnussen L, Strand L, Skouen J, Eriksen H. Motivating disability pensioners with back pain to return to work – a randomized controlled trial. J Rehabil Med 2007; 39: 81–87.