OBJECTIVE: To determine the effect of ankle-foot orthoses on walking efficiency and gait in a heterogeneous group of children with cerebral palsy, using barefoot walking as the control condition.
DESIGN: A retrospective study.
METHODS: Barefoot and ankle-foot orthosis data for 172 children with spastic cerebral palsy (mean age 9 years; hemiplegia: 21, diplegia: 97, and quadriplegia: 54) were compared. These data consisted of non-dimensional speed, net non-dimensional energy cost of walking (NN-cost), and NN-cost as a percentage of speed-matched controls (NN-costpct). For 80 of these children the Gillette Gait Index and data for 3D gait kinematics and kinetics were also analyzed.
RESULTS: Speed was 9% faster (p < 0.001), NN-cost was 6% lower (p = 0.007), and NN-costpct was 9% lower (p = 0.022) when walking with an ankle-foot orthosis. The Gillette Gait Index remained unchanged (p = 0.607). Secondary subgroup analysis for involvement pattern showed a significant improvement in NN-costpct only for quadriplegics (20%, p = 0.004), whereas it remained unchanged for patients with hemiplegia and diplegia. Changes in the minimum knee flexion angle in stance phase and in terminal swing were found to be significantly related to the change in NN-costpct (p = 0.013 and p = 0.022, respectively).
CONCLUSION: The use of an ankle-foot orthosis resulted in a significant decrease in the energy cost of walking of quadriplegic children with cerebral palsy, compared with barefoot walking, whereas it remained unchanged in hemiplegic and diplegic children with cerebral palsy. Energy cost reduction was related to both a faster and more efficient walking pattern. The improvements in efficiency were reflected in changes of stance and swing phase knee motion, i.e. those children whose knee flexion angle improved toward the typical normal range demonstrated a decrease in energy cost of walking, and vice versa.
Key words: ankle-foot orthosis, energy cost of walking, gait analysis, cerebral palsy.
J Rehabil Med 2008; 40: 529–534
Correspondence address: Merel-Anne Brehm, Department of Rehabilitation Medicine VU University Medical Center, De Boelelaan 1117, NL-1081 HV Amsterdam, The Netherlands. E-mail: m.brehm@vumc.nl
Submitted October 25, 2006; accepted March 3, 2008
Introduction
Cerebral palsy (CP) is primarily characterized by central nervous system abnormalities, such as loss of selective motor control and abnormal muscle tone. As a result of growth, these primary characteristics often lead to secondary deficits, including bony deformities, muscle contractures, and gait abnormalities (1). Gait abnormalities in children with CP are known to cause a more than two-fold increase in the energy cost (EC) of walking, compared with healthy children (2–5). Such increases in EC have been shown to influence negatively the level of physical activity (6), thereby predisposing children with CP to early fatigue in carrying out activities of daily living. Therefore, interventions that aim to improve physical mobility by addressing gait abnormalities and reduce the EC of walking are important treatment modalities to maintain or improve independent functioning.
Lower extremity orthoses, such as ankle-foot orthoses (AFOs), are often prescribed for ambulatory children with CP as a treatment modality to reduce gait abnormalities and related limitations in physical mobility (7). The most typical use of an AFO is to optimize the normal dynamics of walking by applying a mechanical constraint (control moment) to the ankle to control motion and, at the same time, produce a more efficient gait (8). The solid AFO (SAFO) achieves the maximum orthotic control by restricting the movements of both plantar flexion and dorsiflexion in the stance and swing phases. Its rigid construction prevents ankle rocker function in stance (8). SAFOs are generally prescribed to reduce excessive plantar flexion in stance, and to prevent or eliminate an equine position (9, 10). The posterior leaf-spring (PLS) AFO allows plantar flexion as well as dorsiflexion in the stance phase, though both motions are attenuated by a counteracting control moment. Its posterior trim line promotes normal ankle rocker function to create a more dynamic gait (11). SAFOs can reasonably be thought of as one extreme of the PLS family (i.e. minimal or non-existent trim line). Both types of orthoses have been studied with respect to their effect on gait, although mainly assessed in small samples of children with CP (9–19). Among these studies, a distinction can be made between studies that have evaluated the effects of an AFO on the pattern of gait, by using three-dimensional (3D) gait analysis (10–15), and those that have evaluated AFO effects on the efficiency of gait, by using measurements of heart rate or oxygen consumption during walking. (12, 13, 16–19) It appears that only 2 studies have investigated both pattern and efficiency effects of an AFO in children with CP (12–13). However, both of these studies relied on single domain outcomes, meaning that relationships between gait pattern outcomes and efficiency outcomes were not established. With an approach that addresses the 2 domains simultaneously, such relationships may be revealed, therewith providing insight into what changes in the gait pattern are associated with changes in walking efficiency.
The aim of this study was two-fold: (i) to determine the effect of 2 types of AFOs, with similar control functions, on walking efficiency in a heterogeneous group of children with CP, using barefoot walking as the control condition; and (ii) to examine what changes in the gait pattern, related to the wearing of the AFO, are associated with changes in walking efficiency.
Methods
Ethical approval was obtained (University of Minnesota IRB) and all relevant privacy laws (HIPAA) were followed in the conduct of the study. A written informed consent statement was obtained from all participants and their parents.
Study population
A retrospective study design was applied on pre- (barefoot (BF)) and post- (AFO) intervention data. These data had been collected between 1992 and 2002 in the Center for Gait and Motion Analysis at Gillette Children’s Specialty Healthcare (GCSH) in St Paul, MN, USA. The cohort of subject data used for this study was extracted from the existing database, based on the following criteria: (i) confirmed diagnosis of CP; (ii) aged between 4 and 18 years; (iii) BF and AFO measurements were performed on the same day; and (iv) no use of assistive devices.
This resulted in a group of 181 children with CP (110 males, 71 females): 23 hemiplegics, 103 diplegics and 55 quadriplegics. Their ages ranged from 4.6 to 18.4 years (mean 9 years; standard deviation (SD) 3), their body mass ranged from 14 to 81 kg (mean 29 kg; SD 12) and their height ranged from 94 to 173 cm (mean 126 cm; SD 18).
AFO intervention
Selected children used either a SAFO or a PLS orthosis. These orthoses had been fabricated by a certified prosthotist orthotist at the Assistive Technology Department of GCSH (St Paul, Minnesota, USA) or at one of their 5 other locations throughout Minnesota. The main function of both orthoses is to prevent plantar flexion motion, while the amount of dorsiflexion allowed depends on the specific type (14). From this point of view, the SAFO and PLS are variations on the same theme, with the SAFO being a more rigid version.
Test procedures
In order to evaluate the effects of the AFO intervention, the following assessments were used: oxygen consumption during walking, walking speed, and biomechanics of gait. These assessments were completed in 2 sessions: (i) walking BF, followed by (ii) walking with AFOs and shoes. Between these 2 sessions the child was allowed to rest for approximately 10 min.
A breath-by-breath gas-analysis system (CPXD, Medical Graphics Corporation, St. Paul, MN, USA) was used for the assessment of oxygen consumption. Each assessment consisted of a resting test, followed by a walking test. The children were first seated in a comfortable chair, and the equipment and the facemask were put on. The fitting of the facemask was carefully inspected for leakage. The children were given specific instructions not to eat or drink 3 h prior to testing, not to talk or laugh, and to fidget as little as possible. During the resting test the children sat quietly for 10 min watching a video movie. This test was followed by the walking test, which consisted of walking for 6 min on an indoor route with a length of 80 m. Subjects were asked to walk at their usual, self-preferred, comfortable speed. Throughout the resting test and the walking test breath-by-breath oxygen consumption (VO2) values were registered. The walking speed was simultaneously measured using a calibrated wheel attached to the gas-analysis equipment.
For the biomechanical analysis of gait, the child walked at a self-preferred, comfortable speed along a 10-m walkway. Data was captured using a 6-camera VICON 370 or 12-camera VICON 512 system (Vicon Motion Systems, Lake Forest, CA, USA), and 4 AMTI force plates (Advanced Mechanical Technology, Inc., Watertown, MA, USA). A total of 6 walking trials (3 BF trials followed by 3 AFO trials) was collected for each child. Kinematics and kinetics were derived using the standard VICON clinical model based on Davis et al. (20).
Data analysis
Steady state values for resting and walking VO2 were computed for the BF and AFO sessions using Kendall’s tau-b (21). Breath-by-breath VO2 data was analyzed at 3-min intervals. The breath closest to the center of the interval was assumed to be at steady state (Ho). Rejection of Ho over the interval at the 0.10 level using a 2-sided test indicated non-steady data. Steady state consumption values and walking speed were then subjected to normalization, according to the net non-dimensional scheme of Schwartz et al. (22), and the following outcome measures for analysis were derived: non-dimensional speed (speed), net non-dimensional EC of walking (NN-cost), and NN-cost as a percentage of speed-matched control data (NN-costpct). Speed-matched control data was drawn from an able-bodied reference population previously measured at the Center for Gait and Motion Analysis at GCSH. (23) Changes in NN-cost and NN-costpct were considered to be a clinically relevant change if they met or exceeded 10%. This level was chosen based on a previous reproducibility evaluation made in children with CP (24, 25).
3D gait kinematics was used to quantify the overall deviation of a subject’s gait from normal gait, expressed as the Gillette Gait Index (GGI, formerly defined as normalcy index [NI] 26). Furthermore, 3D gait data was used to calculate 7 specific gait parameters directly related to functions that are meant to be addressed by orthotic control: dorsiflexion at initial contact (IC); peak dorsiflexion in stance; minimal knee flexion angle in stance; minimal knee flexion angle in terminal swing; minimal knee moment in stance; peak ankle power in stance; and minimal ankle power in stance. Changes in these parameters were categorized into 2 final AFO-response levels: improved toward the typical normal range (with change options from: atypical-to-less atypical, atypical-to-neutral), or worsened from the typical normal range (with change options from: atypical-to-more atypical, neutral-to-atypical, atypical-to-atypical (opposite)).
Statistical analysis
Paired t-tests were used to assess the differences between the BF and AFO condition for speed, NN-cost, NN-costpct and GGI for the total group. Differences were also analyzed for subgroups, based on: (i) AFO-type, i.e. children walking with a SAFO vs children walking with a PLS, and (ii) involvement pattern, i.e. children with hemiplegia, diplegia, and quadriplegia. These were performed with paired t-tests. Relationships between the change in normalized cost and changes in gait parameters were analyzed with Mann-Whitney U tests
A third subgroup analysis was performed based on AFO-response in NN-costpct, i.e. good vs bad responders. A subject was defined as a good responder if improvement in NN-costpct exceeded 10%, and as a bad responder if NN-costpct worsened by more then 10%. As mentioned above, the rational for this 10% difference as a criterion for good vs bad responders was based on a previous reproducibility evaluation (24, 25). Student t-tests were used in order to distinguish a difference in the baseline (i.e. BF) characteristics between these 2 groups. Differences in AFO-response between the good and bad responders were analyzed with Mann-Whitney U tests for the 7 specific gait parameters and with one-way ANOVA for speed, NN-cost, NN-costpct and GGI.
SPSS (11.5) for Windows was used for the statistical analysis. The alpha level of significance for all statistical tests was set at p < 0.05.
Results
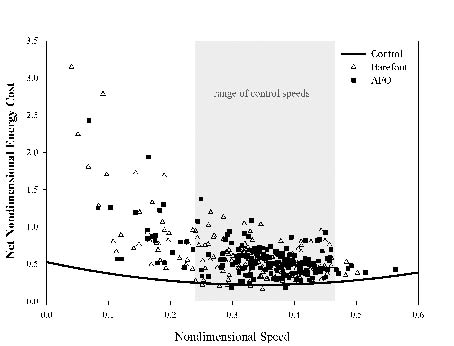
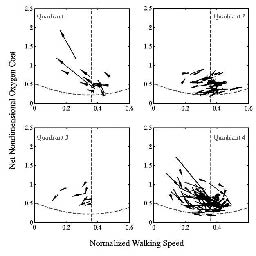
Out of 181 children, 172 (21 hemiplegics, 97 diplegics and 54 quadriplegics) completed both the resting and walking oxygen consumption measurements, and 80 of these children also underwent 3D gait analysis. Significant differences for the total group were found between the BF condition and the AFO condition for speed and both cost parameters. Speed was 9% faster (p < 0.000), NN-cost was 6% lower (p = 0.007), and NN-costpct was 9% lower (p = 0.023) when walking with an AFO, compared with BF walking. The GGI remained unchanged (p = 0.607). In Fig. 1 the NN-cost of BF and AFO walking is presented on the speed vs NN-cost plot. Differences in NN-cost are also presented with regard to different change possibilities: changes due to differences in speed and changes due to a shift of the gait pattern toward a more efficient gait (Fig. 2). Results are clearly mixed, with a large number of positive changes (quadrant 4), but also a significant number of mixed (quadrants 2 and 3) and poor (quadrant 1).
Fig 1. The speed vs net non-dimensional energy cost plot of barefoot (∆) and ankle-foot orthoses () walking. Data per subject (n = 172) is presented in relation to speed-matched control cost.
Fig. 2. Difference in net non-dimensional energy cost between barefoot (beginning of arrow) and ankle-foot orthoses (end of arrow) walking with regard to different change possibilities: (quadrant 1) for decrease in speed and increase in net non-dimensional energy cost, (quadrant 2) for increase in speed and increase in net non-dimensional energy cost, (quadrant 3) for decrease in speed and decrease in net non-dimensional energy cost, (quadrant 4) for increase in speed and decrease in net non-dimensional energy cost. Data per subject (i.e. arrows (n = 172)) is presented in relation to speed-matched control cost (----).
Secondary subgroup analyses for AFO-type showed that baseline characteristics did not differ between the SAFO and PLS group. With regard to the intervention outcomes, speed improved significantly by 8.2% in the SAFO group (p < 0.001) and 9.0% in the PLS group (p < 0.001) after intervention. NN-cost and NN-costpct only improved significantly in the PLS group (8.1%, p = 0.006, and 13% p = 0.013, respectively), while in the SAFO group the 2 cost measures remained unchanged (p = 0.188 and p = 0.298, respectively). Changes in GGI were not statistically significant, with a worsening of 10% in the SAFO group (p = 0.159) and improvement of 5% in the PLS group (p = 0.279). Subgroup analyses for involvement pattern showed significant speed improvements in all 3 groups (p < 0.000). Both cost measures improved significantly only in the quadriplegia group (10.5% for NN-cost, p < 0.001, and 20% for NN-costpct, p = 0.004). The GGI remained unchanged in all the groups.
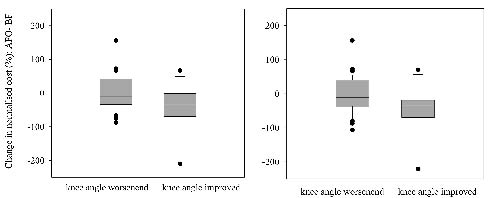
The results of the Mann-Whitney U tests showed significant relationships between change in NN-costpct and change in knee flexion angle in stance phase of walking (p = 0.013) and between change in NN-costpct and change in knee flexion angle in terminal swing (p = 0.022) (Fig. 3).
Fig. 3. Median and interquartile range of ankle-foot orthoses (AFO) response in knee flexion (worsened vs improved from the normal range) are presented in the boxes: (left) relationship between knee flexion angle during stance phase and change in net non-dimensional energy cost pct, and (right) relationship between knee flexion angle during terminal swing and change in net non-dimensional energy cost pct. Negative values on the y-axis represent improvement in net non-dimensional energy cost pct and positive values represent worsening.
The results of subgroup analysis for AFO response (good vs bad responders) are summarized in Table I. These results show that baseline characteristics between the 2 groups are not significantly different, except for both cost parameters. These were significantly higher at baseline for the good responders (p < 0.001 for NN-cost and NN-costpct). With regard to the intervention outcomes, minimal knee flexion angle in stance was significantly different between the groups (p = 0.037). In the good responder group 22 children (56%) showed improved knee flexion during stance, compared with 17 children (44%) who showed a decline. In the bad responder group, 7 children (29%) showed improved flexion during stance compared with 17 children (71%) who showed a decline. Furthermore, the outcome for minimal knee flexion angle in swing was significantly different between the groups (p = 0.017). In the good responder group 20 children (51%) showed improved knee flexion during swing compared with 19 children (49%) who showed a decline. In the bad responder group, 5 children (21%) improved and 19 children (79%) worsened. The other outcomes did not show a significant difference with regard to the AFO-response. Data for non-responders is also presented in Table I.
| Table I. Subgroup analysis based on AFO-response in normalized cost: good vs bad responders. Data for non-responders is also presented |
| Characteristics | Good responders (n = 77) | Non responders (n = 40) | Bad responders (n = 55) |
| Sex (male/female) | 48/29 | 25/15 | 30/25 |
| CP-type/ AFO-type | 7 hemiplegic 40 diplegic 30 quadriplegic | 4 PLS/ 3 SAFO 26 PLS/ 14 SAFO 13 PLS/ 17 SAFO | 7 hemiplegic 24 diplegic 9 quadriplegic | 2 PLS/ 5 unknown 16 PLS/ 8 SAFO 5 PLS/ 4 SAFO | 7 hemiplegic 33 diplegic 15 quadriplegic | 1 PLS/ 1 SAFO/ 5 unknown 16 PLS/ 17 SAFO 7 PLS/ 7 SAFO/ 1 unknown |
| Age (years) | 9.0 (2.9) | | 8.9 (2.5) | | 9.1 (3.4) | |
| MSS | 9.2 (4.7) | | 11.9 (5.5) | | 10.8 (4.7) | |
| SES | 18.4 (4.5) | | 18.2 (4.4) | | 18.6 (5.0) | |
| SPS | 12.9 (3.6) | | 13.3 (4.4.) | | 13.7 (3.9) | |
| Outcomes | Barefoot (BF) | AFO | Resp (%) | Barefoot | AFO | Barefoot | AFO | Resp (%) |
| Ankle angle at IC | 3.0º (6.0) | 6.4º (6.0) | 23 77 | 2.1º (3.9) | 6.7º (3.3) | 2.9º (6.7) | 8.1º (7.6) | 29 71 |
| Peak ankle angle during stance | 15.3º (6.7) | 15.7º (6.6) | 59 41 | 12.1º (3.9) | 15.3º (5.7) | 14.0º (6.3) | 16.8º (6.7) | 52 48 |
| Min knee flexion during stance | 9.8º (11.3) | 9.6º (9.9) | 56 ‡ 44 | 9.0º (13.5) | 7.6º (14.5) | 11.3º (10.5) | 13.0º (11.2) | 29 71 |
| Min knee flexion during swing | 29.5º (9.1) | 26.6º (11.4) | 51 ‡ 49 | 30.1º (9.6) | 27.5º (11.0) | 29.1º (8.9) | 27.1º (12.1) | 21 79 |
| Min knee moment during stance | –0.30 Nm/kg (0.13) | –0.28 Nm/kg (0.13) | 53 47 | –0.33 Nm/kg (0.19) | –0.32 Nm/kg (0.15) | –0.31 Nm/kg (0.16) | –0.27 Nm/kg (0.16) | 53 47 |
| Peak ankle power during stance | 1.40 W/kg (0.56) | 0.89 W/kg (0.44) | 22 78 | 1.48 W/kg (0.44) | 0.87 W/kg (0.32) | 1.30 W/kg (0.47) | 0.98 W/kg (0.37) | 20 80 |
| Min ankle power during stance | –0.74 W/kg (0.46) | –0.62 W/kg (0.33) | 60 40 | –0.75 W/kg (0.46) | –0.63 W/kg (0.23) | –0.78 W/kg (0.35) | –1.0 W/kg (0.79) | 45 55 |
| GGI | 238 (115) | 244 (145) | 2.5 | 250 (135) | 210 (117) | 208 (118) | 244 (195) | 16 |
| Speed | 0.312 (0.09) | 0.343 (0.08)† | 9.5 | 0.345 (0.08) | 0.376 (0.08) | 0.320 (0.08) | 0.348 (0.07)† | 8.4 |
| NN-cost | 0.677 (0.24)* | 0.538 (0.17)† | –23‡ | 0.526 (0.235) | 0.518 (0.20) | 0.503 (0.20) | 0.596 (0.27)† | 17 |
| NN-costpct | 278 (84)* | 228 (69)† | –20‡ | 222 (83) | 221 (84) | 213 (80) | 254 (97)† | 18 |
| Differences are percentages (%), calculated as (AFO-BF/ (AFO+BF/2)) × 100%. *Baseline values of good responders significantly different (p < 0.001) from bad responders. †AFO condition significantly different (p < 0.001) from barefoot condition. ‡AFO-response of good responders significantly different (p < 0.037) from bad responders. AFO: ankle-foot orthosis; PLS: posterior leaf spring; SAFO: solid AFO; MSS: muscle strength sum; SES: selectivity sum; SPS: spasticity sum; Resp: AFO-response; : percentage improved; : percentage worsened; IC: initial contact; Min: minimal; GGI: Gillette gait index; NN-cost: net non-dimensional energy cost; NN-costpct: net non-dimensional energy cost as a percentage of speed-matched control cost; CP: cerebral palsy. |
Discussion
This study evaluated the effect of 2 types of AFOs on walking efficiency and gait in a large population of children with CP. The major finding was that the use of an AFO causes a statistically significantly decrease in the EC of walking in both absolute and normalized sense, compared with BF.
The 6% decrease in absolute cost of AFO walking (NN-cost) is in agreement with the findings of previous studies that were based on small samples sizes (12, 13, 16), and was related to a faster gait pattern, i.e. to an increased speed of AFO walking. Secondary subgroup-analyses for AFO-type showed a significant decrease in NN-cost only for PLS walking (8%), whereas NN-cost for SAFO walking remained unchanged. These findings could best be compared with 2 studies of Buckon et al. (12, 13), which are the only studies that also investigated the effect of different AFO types on walking efficiency at a self-selected, comfortable speed. Their first study (12) evaluated the effectiveness of AFOs in children with spastic hemiplegia, and showed a non-significant reduction of 4% and 7% in absolute cost of PLS and SAFO walking, respectively. A comparison of AFO types in children with spastic diplegia showed a significant reduction of 13% in absolute cost of PLS walking and of 17% for SAFO walking (12). These improvements were much larger compared with our findings. The difference may be related to the fact that we evaluated a total group of CP children (i.e. hemiplegics, diplegics and quadriplegics), while Buckon et al. (13) performed analysis for a subgroup consisting only of diplegics. Hence, our group results may have been attenuated in comparison, as intervention effects can be expected to be less significant for less involved children (hemiplegics). This was supported by our results of secondary subgroup analyses for involvement pattern, which clearly showed an increasing trend of efficiency improvement with an increasing pattern of involvement, i.e. non-significant effects were found for mildly involved CP children (hemiplegic and diplegics), whereas cost of walking improved significantly and achieved clinical relevance in more severely involved children (quadriplegics).
Apart from an absolute improvement, cost of walking also improved in normalized sense, i.e. as a percentage of speed-matched controls (NN-costpct). Using normalized cost as an outcome measure enables us to separate the changes in EC in 2 distinct areas. That is, improvements that are solely due to increases in speed (which would occur at a constant normalized cost) can be distinguished from those that are due to a shift of the gait pattern toward a more efficient gait (which would occur at a decreased normalized cost). It may be helpful to think of different “movements” on the speed vs NN-cost plot (Fig. 1). Improvements due to speed increases are represented by a movement along a direction tangent to that of the average control subject, and improvements due to a shift in the gait pattern are represented by a movement straight down. Any change in NN-cost can be thought of as a sum of these 2 (generally non-orthogonal) components (Fig. 2), and can provide indications to evaluate the gait more profoundly; giving further insight into what changes in the gait pattern did occur to cause an efficiency shift. In the present study, both the GGI, characterizing gait in a global sense, as well as certain specific features of the gait pattern were analyzed in order to explain the change in normalized cost. Interestingly, it was found that the displayed shift in gait efficiency was not reflected in the GGI, which remained unchanged. The probable explanation for the discrepancy between GGI and normalized cost is that the GGI only examines overall gait kinematics. It might be plausible that gait patterns that are more efficient from an energetic viewpoint, are not any closer to the average gait pattern exhibited by subjects without pathology. This finding also suggests that global measures such as the GGI may not exhibit the appropriate specificity and sensitivity for evaluating effects of targeted interventions (27).
While the improvement in gait efficiency was not manifested as a global shift towards the control data, some specific changes at the knee did seem to be energetically favorable. Both changes in the minimal knee flexion angle in stance and in terminal swing phase were found to be significantly related to the change in NN-costpct, i.e. those children whose knee flexion angle improved toward the typical normal range demonstrated a decrease in NN-costpct, and vice versa. An earlier study of Waters & Mulroy (28) showed a similar trend in healthy adults, i.e. cost of walking decreased with decreasing knee flexion angles (45º, 30º, 15º, and 0º, respectively). Both findings support the hypothesis that an improvement of knee flexion angles reflects a reduction in required muscle forces during stance phase of walking, explaining part of the energetic benefit (29, 30). At the ankle level a reduction in peak ankle power during terminal stance was observed. This observation is in line with the existing literature (11, 13), as well as with a very recent study (15), which indicates that applying an AFO can improve the gait pattern, at the expense of a reduced power generation at push-off. Interestingly, the reduction in power generation was not found to be a significant detriment to walking efficiency.
Although, the outcomes for minimal knee flexion angle in stance and terminal swing were significantly different between good and bad responders, our analyses did not reveal much difference in their baseline characteristics. This indicates that it is plausible that differences in AFO configuration (i.e. design, type of material, alignment, stiffness, combination with footwear, etc.) might have had a significant effect on walking efficiency. It could be true that in case the AFO configuration was adequate, the effect on walking efficiency was positive, but at the same time the effect could have been negative when the configuration was inadequate. Because this study used a retrospective analysis of walking energy and 3D gait data to assess the efficacy of AFOs, we did not have any information regarding AFO configuration and prescription goals (e.g. to reduce foot drop, for mid-stance support, to promote normal ankle rocker function, etc.). This is a serious limitation of this study and therefore careful consideration must be taken in generalizing the present results to all children with CP and to all types of SAFO and PLS orthoses. In addition, we used barefoot walking as the control condition. However, ideally, as indicated in the literature, the effects of AFOs should also be weighted against shoe walking, as footwear has clearly been demonstrated to influence the gait pattern (15). A secondary limitation concerns the fact that retrospective data collection included subjects seen over nearly 10 years. As a result, the protocol for all subjects was not identical. The primary protocol change consisted of increasing the rest from 3 min to 10 min, and using statistical methods for determining steady state. The current protocol (described above) has been found to be more reliable (smaller variability) but to give the same results, on average, as previous protocols.
In conclusion, the use of an AFO significantly reduced the EC of walking in more severely involved CP children (quadriplegics), compared with barefoot walking, whereas it remained unchanged in mildly involved CP children (hemiplegics and diplegics). The reduction in EC was related to both a faster and a more efficient walking pattern. However, the improvements in efficiency were not profoundly reflected in changes in gait parameters, except for stance and swing phase knee motion. Future research on the effect of AFOs in children with CP should focus on large-scale prospective studies, in which specific hypotheses related to the goals and design of the AFO prescription, in combination with the design of footwear, are analyzed.
Acknowledgement
This study was supported by a grant from the Ter Meulen Fund, the Netherlands.
References
1. Gage JR, Novacheck TF. An update on the treatment of gait problems in cerebral palsy. J Pediatr Orthop 2001; 10: 265–274.
2. Campbell J, Ball J. Energetics of walking in cerebral palsy. Orthop Clin North Am 1978; 9: 374–377.
3. Duffy CM, Hill AE, Cosgrove AP, Corry IS, Graham HK. Energy consumption in children with spina bifida and cerebral palsy: a comparative study. Dev Med Child Neurol 1996; 38: 238–243.
4. Rose J, Gamble JG, Burgos A, Medeiros J, Haskell WL. Energy expenditure index of walking for normal children and for children with cerebral palsy. Dev Med Child Neurol 1990; 32: 333–340.
5. Unnithan VB, Dowling JJ, Frost G, Bar-Or O. Role of cocontraction in the VO2 cost of walking in children with cerebral palsy. Med Sci Sports Exerc 1996; 28: 1498–1504.
6. Maltais DB, Pierrynowski MR, Galea VA, Bar-Or O. Physical activity level is associated with the O2 cost of walking in cerebral palsy. Med Sci Sports Exerc 2005; 37: 347–353.
7. Morris C. A review of the efficacy of lower-limb orthoses used for cerebral palsy. Dev Med Child Neurol 2002; 44: 205–211.
8. Kogler GF. Orthotic management. In: Gelber GA, Jeffery DR, editors. Clinical evaluation and management of spasticity. Totowa: Humana Press; 2002, p. 67.
9. Radtka SA, Skinner SR, Dixon DM, Johanson ME. A comparison of gait with solid, dynamic, and no ankle-foot orthoses in children with spastic cerebral palsy. Phys Ther 1997; 77: 395–409.
10. Abel MF, Juhl AJ, Vaughan CL, Damiano DL. Gait assessment of fixed ankle-foot orthoses in children with spastic diplegia. Arch Phys Med Rehabil 1998; 79: 126–133.
11. Ŏunpuu S, Bell KJ, Davis RB, DeLuca PA. An evaluation of the posterior leaf spring orthosis using joint kinematics and kinetics. J Pediatr Orthop 1996; 16: 378–384.
12. Buckon CE, Thomas SS, Jakobson-Huston S, Moor M, Sussman M, Aiona M. Comparison of three ankle-foot orthosis configurations for children with spastic hemiplegia. Dev Med Child Neurol 2001; 43: 371–378.
13. Buckon CE, Thomas SS, Jakobson-Huston S, Moor M, Sussman M, Aiona M. Comparison of three ankle-foot orthosis configurations for children with spastic diplegia. Dev Med Child Neurol 2004; 46: 590–598.
14. Radtka SA, Skinner SR, Johanson ME. A comparison of gait with solid and hinged ankle-foot orthoses in children with spastic diplegic cerebral palsy. Gait Posture 2005; 21: 303–310.
15. Desloovere K, Molenaers G, Van Gestel L, Huenaerts C, Van Campenhout A, Callewaert B, et al. How can push-off be preserved during use of an ankle foot orthosis in children with hemiplegia? A prospective controlled study. Gait Posture 2006; 24: 142–151.
16. Maltais D, Bar-Or O, Galea V, Pierrynowski M. Use of orthoses lowers the O2 cost of walking in children with spastic cerebral palsy. Med Sci Sports Exerc 2001; 33: 320–325.
17. Mossberg KA, Linton KA, Friske KF. Ankle-foot orthoses: effect on energy expenditure of gait in spastic diplegic children. Arch Phys Med Rehabil 1990; 71: 490–494.
18. Smiley SJ, Jacobson FS, Mielke C, Johnston R, Park C, Ovaska GJ. A comparison of the effects of solid, articulated, and posterior leaf-spring ankle-foot orthoses and shoes alone on gait and energy expenditure in children with spastic diplegic cerebral palsy. Orthop 2002; 25: 411–415.
19. Suzuki N, Shinohara T, Kimizuka M, Yamaguchi K, Mita K. Energy expenditure of diplegic ambulation using flexible plastic ankle foot orthoses. Bull Hosp Jt Dis 2000; 59: 76–80.
20. Davis RB, Ŏunpuu S, Tyburski D, Gage JR. A gait data collection and reduction technique. Hum Mov Sci 1991; 10: 575–587.
21. Kendall MG, editor. Time series. New York, NY: Hafner Press; 1973.
22. Schwartz MH, Koop SE, Bourke JL, Baker R. A nondimensional normalisation scheme for oxygen utilization data. Gait Posture 2006; 24: 14–22.
23. Koop S, Stout J, Starr R, Drinken B. Oxygen consumption during walking in children with cerebral palsy. Dev Med Child Neurol 1989; 31 Suppl 59: 6.
24. Brehm MA, Becher J, Harlaar J. Reproducibility evaluation of gross and net walking efficiency in children with cerebral palsy. Dev Med Child Neurol 2007; 49: 45–48.
25. Brehm MA, Knol D, Harlaar J. Methodological considerations for improving the reproducibility of walking efficiency measures in clinical gait studies. Gait Posture 2008; 27: 196–201.
26. Schutte LM, Narayanan U, Stout JL, Selber P, Gage JR, Schwartz MH. An index for quantifying deviations from normal gait. Gait Posture 2000; 11: 25–31.
27. Novacheck TF, Schwartz MH. Functional assessment of outcomes, in the treatment of gait problems in cerebral palsy. Gage JR, editor. London: Mac Keith Press; 2004, p. 406–422.
28. Waters RL, Mulroy S. The energy expenditure of normal and pathological gait. Gait Posture 1999; 9: 207–231.
29. Perry J, Antonelli D, Ford W. Analysis of knee-joint forces during flexed-knee stance. J Bone Joint Surg 1975; 57A: 961–967.
30. Hsu AT, Perry J, Gronley JK, Hislop HJ. Quadriceps force and myoelectric activity during flexed knee stance. Clin Orthop Rel Res 1993; 288: 254–262.