OBJECTIVE: To develop a comprehensive measure of Early Physical Functioning (EPF) post-stroke quantified through Rasch analysis and conceptualized using the International Classification of Functioning Disability and Health (ICF).
DESIGN: An observational cohort study.
SUBJECTS: A cohort of 262 subjects (mean age 71.6 (standard deviation 12.5) years) hospitalized post-acute stroke.
METHODS: Functional assessments were made within 3 days of stroke with items from valid and reliable indices commonly utilized to evaluate stroke survivors. Information on important variables was also collected. Principal component and Rasch analysis confirmed the factor structure, and dimensionality of the measure. Rasch analysis combined items across ICF components to develop the measure. Items were deleted iteratively, those retained fit the model and were related to the construct; reliability and validity were assessed.
RESULTS: A 38-item unidimensional measure of the EPF met all Rasch model requirements. The item difficulty matched the person ability (mean person measure: –0.31; standard error 0.37 logits), reliability of the person-item-hierarchy was excellent at 0.97. Initial validity was adequate.
CONCLUSION: The 38-item EPF measure was developed. It expands the range of assessment post acute stroke; it covers a broad spectrum of difficulty with good initial psychometric properties that, once revalidated, can assist in planning and evaluating early interventions.
Key words: acute stroke, functioning, measurement, Rasch analysis, ICF.
J Rehabil Med 2008; 40: 508–517
Correspondence address: Lois Finch, Royal Victoria Hospital, Division of Clinical Epidemiology, 687 Pine Avenue West, Ross Pavilion, R4.27, Montreal, Quebec, H3A 1A1 Canada, E-mail: lois.finch@mail.mcgill.ca
Submitted August 13, 2007; accepted February 5, 2008
*An abstract from this study was presented at the 2006 ACRM-ASNR Annual Educational Conference, “Translating Research into Practice” in Boston, Massachusetts, USA, September 27–October 1, 2006 and was e-published in the journal Arch Phys Med Rehabil 2007; 88: 400.
Introduction
The first few days after a stroke is when the vulnerable brain is influenced the most, for good or for harm (1, 2). To date, the interventions with the greatest early benefit for a person with stroke are thrombolysis with tissue plasminogen activator (3) and organized care provided in acute stroke units (4), with stroke units having the potential to impact on greater numbers (3). The benefits of organized care appear to arise from good medical management and early initiation of rehabilitation (5). The benefits include a reduction in the probability of death (odds ratio 0.66) and death or dependency (odds ratio 0.85) (4). The outcome dependency in these analyses was a dichotomized variable derived from the Barthel Index (BI) or Modified Rankin Index total scores reflecting “dependency” only in activities of daily living (ADL). In fact, stroke impacts on more than ADL; it impacts on the totality of what is considered functioning (6).
Critical for evaluating and developing early interventions is the accurate and comprehensive measurement of functioning. A measure is essential to understand the impact of stroke on early functioning and the subsequent changes that provide a natural basis for a definition of recovery. For such a measure, adequate content and quantification are crucial.
The International Classification of Functioning, Disability and Health (ICF) model (7), defined through its components of: (i) body functions and body structures; and (ii) activities and participation, provides a conceptual framework for what constitutes functioning. The ICF has a coherent content to which items for a measure of functioning can be addressed, but it does not quantify it. A statistical approach, Rasch analysis, could provide the necessary quantitative framework. Rasch methodology produces a measure on which items pertaining to functioning and persons after stroke can be organized hierarchically, by difficulty and ability, respectively, on the same measurement scale in natural logarithm linear units or logits (8, 9). Recent applications of this methodology have led to the development of new measures (10) and the combining of former indices (11) into a single measure.
Typically, most stroke indices summarize the functional skills needed later in the course of stroke recovery, for example, the ability to carry out complex ADL and community re-engagement (10). Few indices are used within the first few days, and fewer comprehensively cover the concept of early functioning (12). Uniting Rasch methodology with the ICF framework could conceptualize, define and quantify early functioning in a single measure.
The aim of this study was to develop a comprehensive measure of Early Physical Functioning (EPF) after stroke as conceptualized by the ICF model and quantified through Rasch analysis.
Methods
Subjects
A longitudinal study was carried out of subjects hospitalized within 72 h of a confirmed stroke, using the World Health Organization definition (13). Persons with subarachnoid haemorrhage, coexisting severe illness (end-stage cancer, pulmonary, cardiac or renal disease), severe cognitive or comprehension impairments (< 13/22 on the Brief Mini-Mental State Exam (MMSE) (14)), or admitted 72 h after a stroke were excluded.
Procedures
Subjects were evaluated within 3 days of their stroke by trained healthcare professionals who observed the subjects’ performance on specific tasks, and who asked the subjects to rate their difficulty in performing certain tasks (15). Subjects were reassessed at 3 months, using the same tasks, complemented by additional ratings of their activities and participation. The study had ethical approval from the University Institutional Review Board. Only the data from the first 3 days were used to define the early functioning measure.
Indices
The measure of EPF was created with items from valid and reliable indices and tests commonly used to evaluate persons after stroke. The indices that required the performance of tasks were scored either by the quality of their movement or by the time it took to accomplish the task and included: Stroke Rehabilitation Assessment of Movement (STREAM: 30 items) (16); Chedoke-McMaster Stroke impairment Assessment (CMSA: 95 items) (17); Fugl-Meyer sensory test (5 items) (18); Balance Scale (14 items) (19), ADL, (BI: 11 items) (20); Cognition (MMSE: 7 items) (21); perceptual neglect (Albert’s test: 1 item) (22); Box and Block test (B&B) (23); Two-Minute-Walk test (TMWT) (24); walking speed (12); and grip strength (25). The continuous data from gait speed, B&B, TMWT, and grip strength tests (4 items) were categorized into 6 categories for entry into the Rasch model based on age and gender norms and the relationship to everyday tasks (12, 23–25).
Data from self-report indices were obtained via interviews with the subjects, rating their difficulty in performing items on the Stroke Impact Scale-16 (SIS-16) (15). Socio-demographic data were collected via interview or the medical records. Prior health was categorized using the Charlton Index (26). Stroke severity was classified, based on the Canadian Neurological Scale scored best to worst (11.5 to 1.5) as: very mild: > 11; mild: between 9.5 and 11; moderate: between 9.5 and 5; and severe: < 5 (27).
Analysis
Descriptive statistics characterized the sample; analysis of variance, χ2 and t-tests were used for contrasts, e.g. between the participants and the non-participants (age, BI, SIS-16). For reasons of fatigue and comprehension, the SIS-16 proxy version was used in 21 (8%) subjects (28). The subjects with proxy responses were more severely affected and disabled from their stroke than the subjects who responded for themselves. Nevertheless, the SIS-16 data from both groups were combined to include subjects with a severe stroke in the analysis. Missing responses represented less than 10% of the data and were not replaced.
Principal component analysis (PCA), performed through the Proc Factor procedure in the statistical analysis software SAS 9.1 (29) (SAS v 9.1: SAS institute, 100 SAS Campus Dr, Cary NC 27513, USA) determined whether a single strong “functioning” unidimensional construct existed within the data. Item reduction was through PCA and Rasch analysis. Although the ordinality and distribution of the data violated the assumptions underlying a PCA, this approach was used to identify and understand the number of dimensions within the construct (29) and to triage items clearly not related to a unidimensional concept of physical functioning. These items were deleted and not carried forward to the Rasch analysis and included: Albert’s test of neglect and 7 MMSE items.
Rasch analysis relates a person’s response to a specific item to the interaction between the amount of ability the person has and the level of difficulty that item represents (9). Each person’s ability and each item’s difficulty are estimated with a standard error (SE), and are organized hierarchically by difficulty and ability respectively, on the same measurement scale based on the natural log of the odds ratio (ratio of probability of success to failure of completing the task) or a logit. By convention, the average difficulty of the items is set to “zero” (8), to determine the match between item difficulty and person ability. When a person’s ability and an item’s difficulty are equal, the probability of successfully performing that item is 50% and estimates that person’s functioning level. One benefit of the probabilistic nature of a Rasch measure is in interpreting the usefulness of that measure. An estimation of an individual’s ability to complete a task given their total score is calculated by taking the antilog of the logit score and computing the probability of passing the item (8, 9).
The EPF was developed using the extended logistic Rasch model for ordered response categories computed with the Rasch Unidimensional Measurement Model programme (RUMM 2020) (30). Criteria for fit to the model were: item and person standardized fit residuals between ± 2 and a global model non-significant χ2 or F-statistic (9).
For proper structuring of the measure, each item’s response options represented by that item’s Rasch threshold should be ordered by difficulty. An item threshold is the point at which the likelihood of failure becomes the likelihood of success; for example, between 0 and 1, or between 1 and 2 (8, 31). A disordered category may reflect problems with the response categories that are not working as intended, i.e. people with less ability have a greater probability of successfully completing a more difficult level of a question than those with more ability. Disordered response options were examined and re-scored based on the criteria for optimizing category effectiveness (31).
The items were co-calibrated concurrently with a method that estimates the difficulty level of items from various indices measuring the same construct, despite differences in numbers and types of response options (32). Items were removed iteratively based on their fit to the model, association with the construct and precision, aided by a Test Information Function (TIF). A TIF, the inverse of the standard error squared, is aggregated from the item information functions and indicates the precision of the item’s estimation of person ability (33). The most precise redundant items were retained.
Differential item functioning
Once the data fit the model, item location stability or differential item functioning across factors (gender, age, or previous health) was tested. To quantify a construct such as functioning, a measure must be invariant; that is for persons with the same level of functioning the probability of passing an item must be unaffected by their characteristics such as age, or gender. For this analysis the participants were grouped by functioning ability and then by gender, age, or previous health within that ability group and a two-way analysis of variance of the person-item residuals was performed (34). The significance level (p < 0.05) was adjusted for multiple comparisons (35).
The sample size required for stable estimates (± 0.5 logits; confidence level: 99%) based on an expected SE of ± 0.19 in the measure was 200 (36).
Validity
Content validity is confirmed by the spread of the items and participants along the measure, the data fit to the model (8), and a reliable item-person-hierarchy that is consistent with the underlying construct. Theoretically, functioning early post stroke was assumed to result from the consequences of stroke on the brain and person as conceptualized by the ICF (7) with EPF items ordered across levels of difficulty, from being unable to move (ICF Body Function items), to performing dexterous movements rapidly, and from basic ADL tasks, such as eating (ICF Activity items), to more complex tasks, such as climbing stairs. Although the indices being combined appeared to represent different constructs, they are all related to the consequences of stroke. The EPF was expected to include only the physical aspects of body function and activity components within the ICF framework. Although mood, emotions, cognition and communicative factors are important components of functioning post-stroke, they might not be related conceptually to the set of physical factors forming the EPF.
The extent to which the EPF measures what it is reported to measure was examined via discriminant validity (convergent and divergent). For convergent validity, the EPF should correlate highly (≥ 0.7) with measures more closely related to physical functioning ICF components (body function level: walking speed and grip strength; and activity level: ADL (BI), and mobility (BI and TMWT)) and at greater levels than a measure of cognition not related to physical functioning (≤ 0.40).
For divergent validity, the EPF should correlate poorly (≤ 0.30) with measures more distant from physical functioning, such as neglect and cognition (Albert’s test, MMSE).
Discriminative ability, the ability to distinguish between persons known to differ by a specific characteristic was also examined. A general linear model, with post-hoc t-tests, Bonferroni corrected, assessed whether the EPF discriminated between subjects across stroke severity (Canadian Neurological Scale) (27) on admission to hospital and whether the EPF discriminated between subjects by disability (modified rankin disability (mRS)) at discharge (15).
An adequate measure should also have predictive qualities. The ability of the EPF to predict ADL (BI) at discharge, after adjusting for length of stay, age and stroke severity, was determined via linear regressions.
Results
A total of 1216 patients were screened within 3 days of stroke for entry into the study, 262 participated, 77 refused and 877 were excluded. Persons were excluded for coexisting severe illness: 26%; distance from the centre > 75 km: 16%; death: 15%; cognitive or comprehension impairments preventing consent: 13%; late admission: 13%; unconfirmed stroke: 12%; transient ischaemic attack: 4%; and subarachnoid haemorrhage: 1%. The mean time to interview was 2.98 days (standard deviation (SD) 1.7).
Table I lists the baseline characteristics of the participants and the non-participants, who differed little from each other except as to age; the non-participants were older. The mean age of the cohort was 71 (SD 12.9) years; 63% were men, 86% had an ischaemic stroke and the median hospital stay was 11 days. The major concomitant medical conditions were hypertension, cancer, prior stroke, and myocardial infarction. The majority of subjects had a moderate stroke (42%) and were discharged to rehabilitation (52%).
| Table I. Characteristics of participants and non-participants | ||
| Factors | Participants (n = 262) | Non-participants (n = 77) |
| Age (years) mean (SD) | 71.4 (12.9) | 75.2 (10.5)* |
| > 64 / 65–74 / 75–84 / ≥ 85 (%) | 29/25/35/11 | 13/36/33/18 |
| Men / women (%) | 63/37 | 51/49 |
| Discharge (%) | ||
| Rehab / Home / Transferred / LTC / Died | 52/40/2/5/1 | 53/35/3/5/3 |
| Ischaemic / Haemorrhagic / Other (%) | 86/14/< 0.1 | 87/13/0 |
| First stroke (%) | 78 | 78 |
| Hemiplegia (%) | ||
| Right / Left / Bilateral / None | 36/53/0/11 | 36/40/1/ 23 |
| Length of hospitalization (days) mean (SD) | 16.4 (21.0) | 13.5 (9.7) |
| Co-morbidity† 0 / 1 / 2–3/ > 3 (%) | 30/28/31/11 | N/A |
| Admission Stroke Severity‡ mean (SD) | 8.2 (2.6) | 7.7 (3.5) |
| Very Mild / Mild / Moderate / Severe (%) | 17/22/42/19 | 23/25/25/27 |
| Barthel Index (0–100) mean (SD) | ||
| 3 days | 51.4 (31.2) | N/A |
| Discharge | 71.2 (26.7) | 71.3 (25.9) |
| Discharge Modified Rankin Score (0–5) (%) | ||
| 0/1 No symptoms / significant disability | 19 | |
| 2 Slight disability | 23 | |
| 3 Moderate disability; walks unaided | 21 | |
| 4 Moderate severe disability; unable to walk | 30 | |
| 5 Severe disability; bed-ridden/dead | 7 | |
| *p < 0.01. †Co-morbidity based on the Charlton Index. ‡CNS: Canadian Neurological Scale. Best score; 11.5; very mild severity: > 11.0; mild: 9.5–11.0; moderate: 5.0–9.4; severe < 5.0 LTC: long term care; N/A: not available; rehab: rehabilitation; SD: standard deviation. | ||
Table II demonstrates functioning early post-stroke. Mobility and hand impairments appear most affected. Mobility limitations are seen in the proportion unable to walk (49%), the mean 2-minute-walk distance, 46.7 m (SD 61.7) (24), mean walking speed, 0.38 m/sec (SD 0.5) (12) and the poor balance scores (mean 28.3, SD 20.4) (19). As for the hand impairments, grip strength (mean 16.9, SD 14.2 kg), was 44% of that expected for a 70-year-old (25) and dexterity, was 34% (mean B&B 23, SD 20.7 blocks) (23). Few subjects in Table II had cognitive difficulties (mean MMSE 18.0, SD 3.3) (21) and 19% had visual perceptual neglect (22).
| Table II. Indices of functioning at 3 days (n = 262) | |||
| Construct | Mean (SD) | Ceiling % | Floor % |
| Functioning measure at 3 days (F3d, 0–51) | 29.9 (14.2) | 1 | |
| Total motor recovery | |||
| STREAM (0–100) | 68.4 (30.3) | 12 | 1 |
| CMSA (1–42) | 30.1 (8.4) | 5 | 1 |
| Mobility | |||
| STREAM (0–100) | 57.4 (31.5) | 2 | 15 |
| Walking speed (m/sec) | 0.38 (0.47) | 49 | |
| Two-Minute-Walk test (m) | 46.7 (61.7) | 51 | |
| Lower limb | |||
| STREAM (0–100) | 71.6 (33.3) | 26 | 6 |
| CMSA leg (1–7) | 5.0 (1.6) | 10 | 3 |
| CMSA foot (1–7) | 5.6 (1.7) | 13 | 8 |
| Balance scale (0–56) | 28.3 (20.4) | 8 | 3 |
| Upper limb | |||
| STREAM (0–100) | 76.1 (34.1) | 46 | 5 |
| CMSA Arm (1–7) | 4.7 (1.9) | 20 | 8 |
| CMSA Hand (1–7) | 4.8 (1.7) | 17 | 13 |
| Affected hand strength and dexterity | |||
| Grip strength (km)* | 16.9 (14) | 24 | |
| Box & Blocks (number in min)* | 23.0 (21) | 29 | |
| Affected Side Sensation (0–9) | 7.4 (2.4) | 47 | 4 |
| Cognition MMSE (0–22)† | 18.0 (3.3) | 2 | |
| Neglect (Albert’s test) (%) | 19.0 | 81 | |
| Stroke Impact Scale-16 | 38.2 (23.5) | ||
| Non-proxy respondents‡ (n = 241) | 40.3 (22.5) | 5 | |
| Proxy respondents‡ (n = 21) | 13.8 (21.1) | 38 | |
| *n: 255; †n: 261; ‡p < 0.0001. The ceiling % represents the proportion of subjects who attained the top score for that index and floor % represents the proportion of subjects who attained the lowest score. CMSA: Chedoke-McMaster Stroke Assessment; MMSE: Mini-Mental State Exam, telephone version); SD: standard deviation; STREAM: Stroke Rehabilitation Assessment. | |||
The relationship between observed and self-report activity limitations (37) is reflected in the subjects’ poor rating of their performance on the SIS-16 (mean 38.2, SD 23.5) (15) and their actual observed ability in performing the ADL tasks of the BI (mean 51.4, SD 31.2) (20). The ratings by subjects and trained evaluators on the bathing and stair climbing items in these 2 indices were discordant, with the subjects rating their performance lower than the evaluators.
Measure development
The first PCA principal component of the 175 items explained 43% of the variance indicating a potential unidimensional structure that could be Rasch-analysed. The ordinality and distribution of the data precluded the linear combination of these items with this methodology (29).
Item reduction
After rescoring 26% (44 items) of the polytomous items with disordered response thresholds, the fit statistics were re-examined and the poorest fitting items were removed iteratively to an initial fit of the data to the model, 78 items were removed. The standardized residual fit statistics of the deleted items ranged from 4.68 to 2.12 and included items divergent from physical abilities, continence (3, SIS-16 items; 2, BI items). Also deleted were items assessing physical abilities differing from or irrelevant to the construct: 7 sensation items, and 2 STREAM low-level mobility items. The SIS-16 bathing item was deleted as confusing; few subjects considered a sponge bath by a patient attendant as a true bath. Subsequent items were deleted for fit or relevance to the population (SIS-16, items not performed in hospital: “carry groceries or heavy items”, “shopping”, “doing heavy housework” and “get into a car”), or were measured at too low a level even for this acute group of subjects (CMSA items, “arm” “foot” not in stage 1) or were redundant with inter-item residual correlations > 0.6 (CMSA and STREAM items of hand and arm function “’pronation and supination”, B&B; Balance Scale, CMSA, SIS, and STREAM “stand” and stair items); 92 items remained. These items formed a pool of calibrated items with adequate fit to the model (mean item-standardized residuals –0.18, SD 0.41, person, –0.13, SD 0.24, person item-hierarchy reliabilities 0.98). The match between person ability and item difficulty was fair (mean person ability 0.87, SD 3.15).
The 38 items in the final EPF measure were chosen from the item pool based on their relationship to the functioning construct of the ICF, content coverage, targeting to the subjects, lack of differential item functioning and precision of measurement.
Properties and structure of the EPF
The global fit statistic (χ2: 122; probability: 0.29) confirmed that the 38 items of the EPF operate well together to define functioning in the early stages after stroke. All item (mean standardized residual –0.24, SD 0.36) and person (mean standardized residual –0.23, SD 0.41 logits) fit statistics met the requirements of the Rasch model.
The unidimensionality of the measure was confirmed, first, by a PCA analysis of the Rasch EPF item raw scores with a first principal component (Eigen value 16.6 and all items loading at ≥ 0.40) explaining 65% of the variance. A minor second PCA component (Eigen value 4.2) containing 3 items (CMSA resistance to trunk rotation, facilitate hip flexion and bounce a ball) explained 16% of the variance and correlated with the first component at 0.53. The high correlation reinforces the idea of statistical dependency between these sets of items as opposed to multidimensionality (35). Secondly, unidimensionality was confirmed as the first principal component the Rasch person-item residuals explained 11% of the remaining variance (35).
The reliability of the Rasch hierarchy of person ability and item difficulty was excellent at 0.97 and 0.98, respectively. The person separation index of 5.6 (derived from the hierarchy reliability) indicated the subjects separated into 6 distinct strata, while the items separated into 9 statistically distinct groups (8). The Separation index (8) ranges from 0 to infinity and is interpreted as a Cronbach’s alpha: acceptable: 1.5 or α = 0.7; good: 2.0 or α = 0.8; and excellent: 3.0 or α = 0.9. A Separation index greater than "2" is suggested for an adequate measure (8). The standardized Cronbach's alpha assessing internal consistency of the raw item scores was 0.96. The standardized item to total correlations was between 0.30 and 0.81 (mean 0.63, SD 0.13). For an adequate test, the alpha should be above 0.70, but should be at least 0.90 to be clinically useful (35).
The EPF, represented in Fig. 1, with the person distribution at the top and the item distribution below, conceptualizes and quantifies functioning early after stroke. The horizontal axes, scaled in logits, symbolize functioning early post-stroke from the least functional at the left to most functional at the right. The vertical axis in Fig. 1 denotes the proportions and the bars represent the frequency distribution of subjects and items at each location.
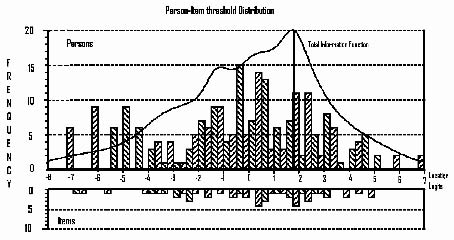
Fig. 1. Displays the item-person-distribution of the Early Physical Functioning measure, EPF, with its Test Information Function. The horizontal axes, scaled in logits, denote functioning from least functioning at the left to most functioning at the right and the vertical axis denotes the proportion of subjects or items. The bars represent the distribution of subjects and items at each location.
The item threshold difficulty ranges across 12 logits, from –6.87 logits (SE 0.38) for the item “facilitate finger flexion” to 5.00 logits (SE 0.33) for the item “bounce and catch a ball”. Person ability spans approximately 15 logits, from –8.24 (SE 0.95) to 6.82 (SE 1.3) logits with the majority of the subjects located between –2.0 and +2.5 logits. The adequate match between item difficulty and person ability is indicated by the person measure of –0.31 (SE 0.23) logits. A difference > 0.5 logits is considered a mismatch (8, 10).
The item precision (SE range: 0.11–0.37 logits), depicted by the TIF line in the top of the figure, is only compromised above 3 logits, where the TIF drops off sharply secondary to a lack of items. Floor and ceiling effects are not apparent.
Fig. 2 displays the item map each item is depicted as a dashed line with the location of each item’s response option (0, 1, 2 or 3) along the line. The distance between the numbers indicates the spread of functioning early post-stroke as represented by each response option. The short vertical lines indicate the expected half-way point between any 2 response options, or thresholds, the place where the person has a 50% probability of responding with either 0 or 1; or 1 or 2; or 2 or 3. The numbers across the top and bottom of the figure represent the logit values for that location along the item dashed line.
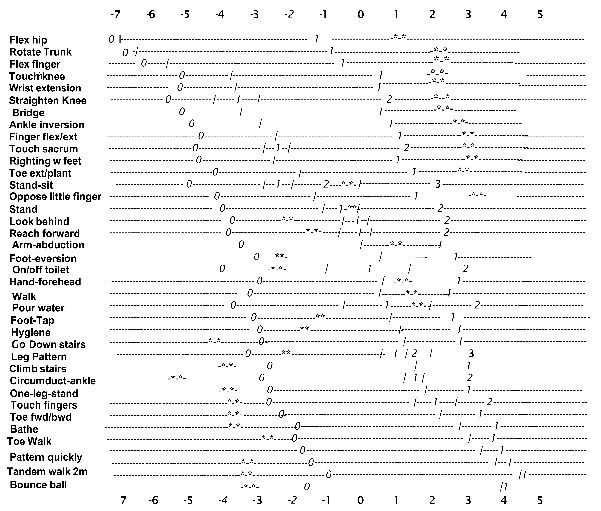
Fig. 2. Displays the item map with the location of each response option (0, 1, 2 or 3) and threshold.The values across the top and bottom of the map represent the logit value at that location. The items are ordered from top down by difficulty with the most difficult at the bottom.The response options increase in difficulty from left to right. The short vertical line represent the thresholds or the position where the probability of responding with a 0,1; 1,2; or 2, 3; is 50%. The stars represent the responses on each item by an average subject with the average ability of –0.31 (SE: 0.28) logits.
The stars on each line illustrate an average person’s response pattern. The person’s score of 22/51, or –0.31 logits (SE 0.42; 95% confidence interval: –1.13 to 0.51 logits), was calculated by summing the stared responses. As the raw item (reponses of 0,1,2,3) and logit scores correlate at 1.00, they can be considered interchangeable (8). Functioning increases diagonally from top left to bottom right as the difficulty of the items and their response option values increase.
Table III presents the items arranged by difficulty with their logit thresholds, SE, fit residuals and equivalent expected raw scores, the scores from 0-51. Of the 38 items, 27 are dichotomous scored 0, 1, while 11 are polytomous; nine with raw scores of 0, 1, or 2 and two have raw scores of 0, 1, 2, or 3. The fourth item knee extension is scored 0, 1or 2. The first response (0.1) ‘knee extension’ is located as the fourth position such that if a person successfully partially extends his knee the person could receive a ‘1’’ while failure would result in a ‘0’. The eighth item locates the second response option for the item ‘knee extension’ requiring full extension for a probably score of ‘2’.
The amount of recovery that can be measured by the EPF as denoted by a change in functioning seen early after a stroke is illustrated in Table III. The smallest measurable difference, the smallest amount of measurable recovery on the EPF, corresponds to a 1-point increase in the raw score (0–51). The amount of recovery in a 1-point change at the lowest level of functioning from –6.87 to –6.68 logits (raw score 1–2) is 0.19 logits, and at the middle level of the measure, from 23 to 24 is 0.06 logits. The change in early ability required to recover functioning is similar at these 2 levels, but varies across the continuum of the measure.
The average EPF score was 29.9 out of 51 (SD 14.2) or –0.31 (SE 0.23) logits. These stroke survivors were probably able to complete the top15 items in Table III, would have difficulty with the middle 13 and were probably incapable of successfully completing the top 10 items on the EPF .The most able subjects measured at 6.82 logits on the EPF can tandem walk 2 m in < 10 sec and report that they can climb stairs independently; the least able subjects measured at –8.24 logits, are totally dependent and unable to move.
Differential item functioning
The difficulty level of the EPF items did not fluctuate across gender, age, or previous health.
Validity
The content of the EPF covers a broad spectrum of difficulty across 12 logits, with items from ICF components of: Body Functions: 11-upper and 11-lower limb items; Activities: 3-basic self-care, 5-mobility and 8-balance items (Table III). Further indications of content validity include an adequate fit of the data to the model and a reliable item-person-hierarchy consistent with the hypothesized theory of functioning in the early stages post-stroke. The items are organized as theorized from: low level body function items (“facilitate hip movement”: –6.87 logits); to more difficult activity items (“bath independently”: 3.81 logits); and from simple body function tasks such as “wrist extension > 1/2 range” at –3.52 logits; to more complex activity tasks “walking down 3 stairs with alternate feet”, 1.18 logits (Table III).
| Table III. Early Physical Functioning Measure (EPF) | ||||
| Items | Item threshold | |||
| Location | SE | Fit residuals | Raw Scores | |
| 0§ | ||||
| Facilitate hip flexion | –6.87 | 0.38 | –0.05 | 1 |
| Resist trunk rotation | –6.68 | 0.36 | 0.00 | 2 |
| Facilitate finger flexion | –5.67 | 0.31 | –0.40 | 3 |
| Partial knee extension* | –4.07 | 0.18 | 0.13 | 4 |
| Touch opposite knee | –3.95 | 0.26 | –0.42 | 5 |
| Wrist extension ½ range | –3.52 | 0.18 | 0.13 | 6 |
| Bridge | –3.38 | 0.25 | –0.39 | 7 |
| Knee full extension† | –2.94 | 0.18 | 0.13 | 8 |
| Ankle inversion | –2.89 | 0.23 | –0.12 | 9 |
| Partial hand on sacrum* | –2.70 | 0.16 | –0.14 | 10 |
| Finger flexion/extension | –2.41 | 0.22 | 0.03 | 11 |
| Balance feet on floor | –2.40 | 0.22 | –0.82 | 12 |
| Stand-sit uncontrolled* | –2.27 | 0.11 | 0.20 | 1S |
| Hand on sacrum† | –2.16 | 0.16 | –0.14 | 14 |
| Stand-sit with hands† | –1.72 | 0.11 | 0.20 | 15 |
| Toe extension & ankle plantar flexion | –1.70 | 0.20 | –0.05 | 16 |
| Oppose little finger and thumb | –1.13 | 0.19 | –0.16 | 17 |
| Difficulty standing without losing balance* | –0.77 | 0.16 | 0.62 | 18 |
| On-off toilet assisted* | –0.66 | 0.13 | –0.62 | 19 |
| Walk 50 feet assisted* | –0.28 | 0.14 | –1.06 | 20 |
| Turn to look behind turn only* | –0.26 | 0.13 | –1.20 | 21 |
| Reach forward 12 cm* | –0.24 | 0.13 | –1.15 | 22 |
| No difficulty standing without losing balance† | 0.21 | 0.16 | 0.62 | 23 |
| Abduct arm fully | 0.24 | 0.18 | –0.32 | 24 |
| Stand-sit without hands‡ | 0.30 | 0.11 | 0.20 | 25 |
| Turn look behind & shift weight† | 0.38 | 0.13 | –1.20 | 26 |
| Ankle eversion | 0.59 | 0.18 | –0.31 | 27 |
| Reach forward > 25 cm† | 0.66 | 0.13 | –1.15 | 28 |
| Hand-forehead 5 × within 5 sec | 0.68 | 0.18 | –0.20 | 29 |
| Draw 8 with your arm fully extended | 0.90 | 0.18 | –0.07 | 30 |
| Descend 3-stairs with deviation* | 1.21 | 0.11 | –0.51 | 31 |
| Pour water into glass and reverse | 1.43 | 0.19 | –0.24 | 32 |
| Tap foot quickly 5 × in 5 sec | 1.57 | 0.19 | –0.46 | 33 |
| Personal hygiene independent | 1.70 | 0.19 | 0.02 | 34 |
| Difficulty climbing flight-of-stairs* | 1.86 | 0.14 | 0.15 | 35 |
| Descend 3-stairs assisted† | 1.93 | 0.11 | –0.51 | 36 |
| Single-leg-stance > 5 sec* | 1.97 | 0.15 | –0.03 | 37 |
| On-off toilet independently† | 2.00 | 0.13 | –0.62 | 38 |
| Trace leg pattern | 2.01 | 0.20 | –0.41 | 39 |
| Descend 3-stairs normally‡ | 2.30 | 0.11 | –0.51 | 40 |
| No difficulty climbing one flight-of-stairs† | 2.36 | 0.14 | 0.15 | 41 |
| Quick ankle circumduction | 2.43 | 0.21 | –0.30 | 42 |
| Walk 50 feet independently† | 2.53 | 0.14 | –1.06 | 43 |
| Touch fingertips quickly | 2.79 | 0.21 | –0.01 | 44 |
| Heel-forward / toe-back quickly | 3.08 | 0.22 | –0.38 | 45 |
| Single-leg-stance > 10 sec† | 3.21 | 0.15 | –0.03 | 46 |
| Bathe independently | 3.81 | 0.25 | –0.05 | 47 |
| Toe walk 2 m | 4.04 | 0.26 | –0.27 | 48 |
| Leg pattern quickly | 4.30 | 0.28 | –0.22 | 49 |
| Tandem walk 2 m in 10 sec | 4.89 | 0.32 | –0.22 | 50 |
| Bounce ball | 5.00§ | 0.33 | 0.04 | 51 |
| Items are ordered by their threshold difficulty locations, from top to bottom. Underlined items represent self-report of difficulty (2 items). Bold items are scored polytomusly (11 items) with each response option threshold indicated with the following symbols *the first for a score of 0 or 1; †the second for a score of 1 or 2 and ‡the third for a score of 2 or 3. Each item raw response option is valued (0, 1) and adds to the overall total score of 51. §Extreme scores are estimated by extrapolation from the last 3 known estimates. Fit-res: standardized fit residuals; SE: standard error. | ||||
The correlations, in Table IV, between the EPF and the indices assessing the physical aspects of functioning were greater (> 0.70) than those between sensation and cognition (< 0.40) and the physical indices, confirming convergent and divergent validity.
| Table IV. Validity correlations | |||
| Index | Convergent* EPF | Divergent* | |
| Cognition | Sensation | ||
| Cognition (MMSE) (0–22) | 0.30 | ||
| Sensation (Fugl-Meyer 0–9) | 0.36 | 0.24 | |
| Neglect (Albert’s test) | –0.34 | –0.37 | –0.24 |
| SIS-16 (0–100) | 0.88 | 0.24 | 0.33 |
| BI (discharge) (0–100) | 0.91 | 0.34 | 0.35 |
| Two-Minute-Walk test (m) | 0.84 | 0.26 | 0.29 |
| CMSA (0–42) total score | 0.94 | 0.27 | 0.34 |
| Balance scale (0–56) | 0.94 | 0.30 | 0.31 |
| Walking speed (m/sec) | 0.84 | 0.27 | 0.28 |
| Grip strength (kg) | 0.69 | 0.25 | 0.32 |
| *Significant at p < 0.0001. CMSA: Chedoke-McMaster Stroke Assessment; MMSE: Mini-Mental State Exam (telephone version); SIS-16: Stroke Impact Scale-16; BI: Barthel Index; EPF: Early Physical Functioning. | |||
The EPF discriminated significantly between all levels of stroke severity except between the very-mild and mild severity levels where the mean difference was 2.8 logits with a 95% confidence interval for the difference of –4.4 to 10.0. A comparison of the SIS-16 and EPF scores across stroke severity and the mRS categories (Table V) demonstrates the increased sensitivity of the EPF. The SIS-16 discriminated across the moderate and severe lower categories (3 and 4) of stroke severity well, but was insensitive to higher levels (1 and 2). By contrast, the EPF discriminated between all but the very mildest strokes and was slightly better than the SIS-16 in discriminating between the categories of the mRS.
| Table V. Comparing the discriminative ability of Early Physical Functioning measure (EPF) and the Stroke Impact Scale-16 (SIS-16) against discharge disability categories. | ||||||
| mRS levels | EPF mean difference | 99% confidence levels | SIS-16 mean difference | 99% confidence levels | ||
| 0–1 | 8.127 | –2.004 | 18.258 | 7.502 | –11.600 | 26.605 |
| 0–2 | 12.126 | 2.256 | 21.997* | 9.241 | –9.370 | 27.851 |
| 0–3 | 23.389 | 13.483 | 33.294* | 29.201 | 10.524 | 47.877* |
| 0–4 | 34.517 | 24.807 | 44.227* | 46.287 | 27.979 | 64.596* |
| 0–5 | 38.833 | 27.573 | 50.094* | 54.948 | 33.716 | 76.179* |
| 1–2 | 3.999 | –1.569 | 9.568 | 1.738 | –8.761 | 12.238 |
| 1–3 | 15.262 | 9.632 | 20.892* | 21.698 | 11.083 | 32.314* |
| 1–4 | 26.390 | 21.111 | 31.669* | 38.785 | 28.831 | 48.738* |
| 1–5 | 30.706 | 22.936 | 38.477* | 47.445 | 32.794 | 62.097* |
| 2–3 | 11.263 | 6.117 | 16.409* | 19.960 | 10.258 | 29.663* |
| 2–4 | 22.391 | 17.632 | 27.150* | 37.047 | 28.074 | 46.020* |
| 2–5 | 26.707 | 19.280 | 34.134* | 45.707 | 31.704 | 59.711* |
| 3–4 | 11.128 | 6.297 | 15.959* | 17.087 | 7.978 | 26.196* |
| 3–5 | 15.444 | 7.971 | 22.918* | 25.747 | 11.656 | 39.838* |
| 4–5 | 4.316 | –2.896 | 11.529 | 8.661 | –4.939 | 22.260 |
| 5–0 | –38.833 | –50.094 | –27.573* | –54.948 | –76.179 | –33.716* |
| 5–1 | –30.706 | –38.477 | –22.936* | –47.445 | –62.097 | –32.794* |
| 5–2 | –26.707 | –34.134 | –19.280* | –45.707 | –59.711 | –31.704* |
| 5–3 | –15.444 | –22.918 | –7.971* | –25.747 | –39.838 | –11.656* |
| 5–4 | –4.316 | –11.529 | 2.896 | –8.661 | –22.260 | 4.939 |
| Bonferroni significant p-value, p < 0.01. *Significantly different at p < 0.01. mRS: Modified Rankin Disability: 0 = no symptoms; 1 = no significant disability; 2 = slight disability; 3 = moderate disability; 4 = moderate-severe disability; 5 = severe disability/bed-ridden. | ||||||
In the regression analysis, the EPF explained 6% more (66%) of the variance in the discharge BI, than the SIS-16, CMSA or admission BI. Although the responsiveness of the EPF remains to be tested, the reliability of the hierarchy, the content and the spread of the measure indicate that it would be responsive.
Discussion
A 38-item measure of early physical functioning, the EPF, quantified using Rasch methodology and conceptualized using the ICF functioning framework, was developed. The EPF does not have floor or ceiling effects, discriminates across 3 of 4 levels of stroke severity and shows promise as a predictive measure. The EPF demonstrates initial content and construct validity, and excellent item-person-hierarchy reliability. The EPF expands the range of assessment in acute stroke beyond observational tasks and self-rating of performance to include both. It covers a broad spectrum of difficulty across ICF domains, including the items a rehabilitation professional would use to evaluate or plan early interventions.
That items in the EPF needed to be re-scored is not surprising. Some of these items have been re-scored by others (38) or the responses options are known to be disordered (10). The rescaled items tended to be difficult items (e.g. SIS “climb stairs”, Table III). Other populations have struggled to rate their performance on difficult tasks using multiple response options with similar results. In a study of community-dwelling elderly people (32), subjects felt that dichotomous response options were restrictive, yet only used 2 of 6 options when responding to difficult items. Decreasing the number of response options did not compromise the scope or the capacity of the EPF to measure functioning early after stroke. Based on a reliability index of 0.97, the items covered 9 distinct strata (separation index: 6.3) across 12 logits.
The preliminary validity of the measure was established by the fit of the data, the item-person-hierarchy and the high correlations between the EPF and the physical functioning indices in Table III. The ordering of items is as expected and as suggested by others (10, 15, 38).
The high correlations in Table IV are as expected given its development, but also suggest that redundancies exist both within the EPF and between the EPF and the numerous indices used to evaluate functioning. Additionally, a Cronbach’s alpha > 0.90 can indicate a potential item redundancy, as does the correlation between the PCA components of the EPF (r = 0.53) (35). Some redundant items, items at similar difficulty levels, (“getting on and off toilet independently” (0.67 logits) and “move hand to forehead quickly” (0.68 logits)), were retained for face validity, while others (the “stair” items from the SIS-16 and the STREAM) were retained to incorporate 2 perspectives on completing a task, those of the subject and of an evaluator. The EPF may benefit from a reduction in items, especially in the middle section. Although EPF defines higher levels of functioning fairly well, from 2.79 to 5.0 logits, it lacks some definition and precision at the lowest levels, from –3.9 to –5.6. Additional items at the lower end might improve the measure.
By combining the 2 types of indices the EPF may increase the understanding of the recovery of functioning early post-stroke as the ceiling effects of indices used to observe how a task is completed (39) may be mitigated by items where performance difficulty is reported. Additionally, the person’s perspective related to the effort required to perform a task may explain why some patients with ability to perform activities do not do them. This information would allow therapists to adjust the components of therapeutic sessions to the individual. A single combined measure would also reduce the response burden.
Little is know of the pattern of functioning early in the recovery phase post-stroke, the period of potential rapid improvement when even small changes are important. To date, the adequate understanding of functioning post-stroke and the evaluation of rehabilitation programmes has been with multiple indices, as in Table II, or by a single index assessing a functioning component, such as ADL, or an impairment, such as movement of a limb.
Difficulties arise in interpreting functioning early after a stroke from a single index, as the single best index has yet to be defined (40). Due to the inconsistencies in defining functioning, recovery has often been dichotomized as “independent” or “dependent” (40), which is inadequate for a number of reasons: it decreases the information obtained, limits the detection of change in outcome, and is often clinically irrelevant (40). Statistically, it causes misclassification whereby persons with different functioning levels are classified within the same range either above or below a cut-off point defining recovery. Misclassification occurring at random would increase the noise, making it difficult to find the effects, whilst a systematic misclassification would bias the results (35, 40).
The results in Table II illustrate the difficulties of using multiple indices to describe functioning. Summary scores across numerous ordinal categories increase the ambiguity in understanding an individual’s level of disability. For example, the average total CMSA impairment score (mean 30.1, SD 8.4) can be obtained from various response combinations. The impairments an individual has are indeterminate without an item by item analysis. The same can be said for the total scores on the STREAM, and BI (Table I). Multiple scores are inadequate indicators for treatment; provide a weak understanding of the relationship between the impairments a person exhibits and the activities restriction she/he has and information on how a person’s ability on one task can lead to improvement on another is lacking.
In contrast, the EPF provides a transparent single measure with an item-hierarchy that provides the necessary information to interpret a person’s early functioning ability, understanding the process of recovery and assist in developing individualized focused early interventions. This is illustrated in Fig. 2 with the starred response pattern of an average subject, an 82-year-old male with a mild, left hemisphere, ischaemic stroke. Given his total score, 22 out of 51 (–0.31 logits) and the item hierarchy a therapist can estimate his early ability. He is probably capable of completing the first 15 items, would have difficulty completing the next 15 items and would be expected to fail the top 8 items.
Most of his responses are as expected; he lacks balance (reaching forward, score 0; standing on one foot, score 0), and has poor lower extremity strength (get up off the toilet, score 0). Unexpectedly, he reported no difficulty in climbing stairs, while his performance was rated as 0: “requiring significant assistance”. His rehabilitation programme can now be defined. A goal of his therapy might be to bathe independently, a challenging self-care task to regain (15). For this subject to attain his goal, his programme could include the easier tasks leading up to bathing, e.g. strengthening his lower extremities, balance activities progressing from a moderate to a small base of support, and exercises to improve the control of his hand and foot movements. Additionally, therapists can explore the reason for his unexpected increase of confidence in climbing stairs.
Where to start an individual’s intervention is important information, especially for novice therapists. The EPF is able to estimate a subject’s probability of successfully completing an intervention targeted at improving bathing. For example, the probability of our subject’s success estimated from his initial score before receiving his therapy would be 1%. (the difference between the subject’s logit score of –0.31 and the bath item located at 3.81 (SE 0.25) logits is 4.12 logits.). The amount of improvement he achieves with the intervention and the time taken to this improvement could assist in evaluating the effectiveness of his specific bathing intervention.
There is debate as to what type of rehabilitation therapy to offer and the optimum time at which to offer it post acute stroke (41). Studies suggest that the majority of the benefits of rehabilitation are from repeated practice therapy that, if initiated early, can lead to changes in the motor cortex. The brain’s capacity to reorganize depends on usage and the relearning of skills such as those needed by our average subject (1). New rehabilitation interventions, based on animal models of early therapy (1, 2) and stroke unit care are being developed and refined (42). To date, a single comprehensive early measure of physical functioning does not exist. The EPF, which reflects the whole spectrum of functioning in the early stages after stroke, could assist not only in the planning of early interventions but, if proven valid in another sample, could adequately capture change in order to evaluate interventions and stratify subjects in trials of early therapy.
Limitations
The EPF was developed in a single sample of subjects with acute stroke. Although these stroke survivors present a typical survivor profile, it is difficult to compare their characteristics with others, beyond demographics and a general description of ability, as few other studies have measured functioning as early. However, these survivors have similar characteristics to that of a previous cohort of stroke subjects assessed at 10 days (37). The 2 groups compare well as to the proportion unable to walk, 48% vs 28%, mean hand strength 16.9 vs 17.6 kg, average score on the B&B, 23 vs 25.3, and average BI, ADL scores, 51.4 vs 58.1 out of 100, for the 3-day and 10-day cohort, respectively. Our sample does not include those stroke survivors with a very mild stroke not admitted to hospital, those admitted after 3 days, or those with dysphasia or inadequate cognition to consent to participate. Additionally, the EPF assesses a single physical construct only; other measures are required to assess such relevant concepts as perception, cognition and mood.
Although the internal consistency and separation indices are excellent, further study is necessary to confirm the revised response options, test-retest reliability, validity and responsiveness to change of the EPF in a new sample.
In conclusion, Rasch analysis was used to identify 38 items for a post-stroke measure of the EPF. This measure demonstrates good initial psychometric properties without floor or ceiling effects, expands the range of assessment in acute stroke by including observational tasks and self-rating of performance items, and covers a broad spectrum of difficulty. The EPF discriminates across stroke severity and shows promise as a predictive measure. Once the properties of the EPF are reconfirmed, the hierarchy of the items could aid in understanding the early course of recovery of functioning, what is needed successfully to complete each successive recovery stage, and assist in the development of treatment plans.
AcknowledgEments
The authors would like to thank Susan Scott MSc and Lynne Nadeau MA for assistance with statistical analysis.
The following funding agencies are acknowledged for their support: Fonds de Recherché en Santé du Québec (FRSQ), the Canadian Stroke Network (CSN), the Physiotherapy Foundation of Canada (PFC) and the Canadian Institute of Health Research (CIHR).
References
1 Ward NS, Brown MM, Thompson AJ, Frackowiak RS. Neural correlates of motor recovery after stroke: a longitudinal fMRI study. Brain 2003; 126: 2476–2496.
2 Biernaskie J, Chernenko G, Corbett D. Efficacy of rehabilitative experience declines with time after focal ischemic brain injury. J Neurosci 2004; 24: 1245–1254.
3 Gilligan AK, Thrift AG, Sturm JW, Dewey HM, Macdonell RA, Donnan GA. Stroke units, tissue plasminogen activator, aspirin and neuroprotection: which stroke intervention could provide the greatest community benefit? Cerebrovasc Dis 2005; 20: 239–244.
4 Langhorne P, Duncan P. Does the organization of postacute stroke care really matter? Stroke 2001; 32: 268–274.
5 Indredavik B, Bakke F, Slordahl SA, Rokseth R, Haheim LL. Treatment in a combined acute and rehabilitation stroke unit – which aspects are most important? Stroke 1999; 30: 917–923.
6 Granger CV, Kelly-Hayes M, Johnston M, Deutsch A, Braun S, Fiedler R, editors. Quality and outcome measures for medical rehabilitation. Rasch Measurement in health sciences. Maple Grove: JAM Press; 2005, p. 82–113.
7 World Health Organization. International Classification of Functioning, Disability and Health. Second revision edn. Geneva: World Health Organization; 2001.
8 Wright BD, Masters GN, editors. Rating scale analysis. Chicago: MESA Press; 1982.
9 Andrich D, editor. Rash models for measurement. Newbury Park: Sage Publications; 1988.
10 Duncan PW, Bode RK, Lai SM, Perera S. Rasch analysis of a new stroke-specific outcome scale: the Stroke Impact Scale. Arch Phys Med Rehabil 2003; 84: 950–963.
11 Johnston MV, Shawaryn MA, Malec J, Kreutzer J, Hammond FM. The structure of functional and community outcomes following traumatic brain injury. Brain Inj 2006; 20: 391–407.
12 Salbach NM, Mayo NE, Higgins J, Ahmed S, Finch LE, Richards CL. Responsiveness and predictability of gait speed and other disability measures in acute stroke. Arch Phys Med Rehabil 2001; 82: 1204–1212.
13 Stroke – 1989. Recommendations on stroke prevention, diagnosis, and therapy. Report of the WHO Task Force on Stroke and other Cerebrovascular Disorders. Stroke 1989; 20: 1407–1431.
14 Koenig HG. An abbreviated Mini-Mental State Exam for medically ill older adults. J Am Geriatr Soc 1996; 44: 215–216.
15 Duncan PW, Lai SM, Bode RK, Perera S, DeRosa J. Stroke Impact Scale-16: a brief assessment of physical function. Neurology 2003; 60: 291–296.
16 Daley K, Mayo N, Wood-Dauphinee S. Reliability of scores on the Stroke Rehabilitation Assessment of Movement (STREAM) measure. Phys Ther 1999; 79: 8–19.
17 Gowland C, Stratford P, Ward M, Moreland J, Torresin W, Van Hullenaar S, et al. Measuring physical impairment and disability with the Chedoke-McMaster Stroke Assessment. Stroke 1993; 24: 58–63.
18 Fugl-Meyer AR, Jaasko L, Leyman I, Olsson S, Steglind S. The post-stroke hemiplegic patient. 1. A method for evaluation of physical performance. Scand J Rehabil Med 1975; 7: 13–31.
19 Berg K, Wood-Dauphinee S, Williams JI. The Balance Scale: reliability assessment with elderly residents and patients with an acute stroke. Scand J Rehabil Med 1995; 27: 27–36.
20 Mahoney FI, Barthel DW. Functional evaluation: the Barthel lndex. Md St Med J 1965; 14: 61–65.
21 Roccaforte WH, Burke WJ, Bayer BL, Wengel SP. Validation of a telephone version of the mini-mental state examination. J Am Geriatr Soc 1992; 40: 697–702.
22 Albert ML. A simple test of visual neglect. Neurology 1973; 23: 658–664.
23 Desrosiers J, Bravo G, Hebert R, Dutil E, Mercier L. Validation of the Box and Block Test as a measure of dexterity of elderly people: reliability, validity, and norms studies. Arch Phys Med Rehabil 1994; 75: 751–755.
24 Gibbons WJ, Fruchter N, Sloan S, Levy RD. Reference values for a multiple repetition 6-minute walk test in healthy adults older than 20 years. J Cardiopulm Rehabil 2001; 21: 87–93.
25 Bohannon RW, Peolsson A, Massy-Westropp N, Desrosiers J, Bear-Lehman JB. Reference values for adult grip strength measured with a Jamar dynamometer: a descriptive meta-analysis. Physiotherapy 2006; 92: 11–15.
26 Charlson ME, Pompei P, Ales KL, MacKenzie CR. A new method of classifying prognostic comorbidity in longitudinal studies: development and validation. J Chronic Dis 1987; 40: 373–383.
27 Cote R, Battista RN, Wolfson C, Boucher J, Adam J, Hachinski V. The Canadian Neurological Scale: validation and reliability assessment. J Neurol 1989; 39: 638–643.
28 Duncan PW, Lai SM, Tyler D, Perera S, Reker DM, Studenski S. Evaluation of proxy responses to the Stroke Impact Scale. Stroke 2002; 33: 2593–2599.
29 Tabachnick BG, Fidell LS, editors. Using multivariate statistics. 4th edn. Boston: Allyn and Bacon; 2001.
30 Andrich D, Sheridan B, editors. Interpreting RUMM2020. Perth: RUMM Laboratory Pty Ltd; 2005.
31 Linacre JM. Optimizing rating scale category effectiveness. J Appl Meas 2002; 3: 85–106.
32 McHorney CA, Cohen AS. Equating health status measures with item response theory: illustrations with functional status items. Med Care 2000; 38 Suppl 9: II43–II59.
33 Penfield RD. Unique properties of Rasch model item information functions. J Appl Meas 2005; 6: 355–365.
34 Hagquist C, Andrich D. Is the Sense of Coherence-instrument applicable on adolescents? A latent trait analysis using Rasch modeling. Personality and Individual Differences 2004; 36: 955–968.
35 Streiner DL, Norman GR, editors. Health measurement scales: a practical guide to their development and use. Oxford: Oxford University Press; 1995.
36 Linacre JM. Sample size and item calibration stability. Rasch Measurement Transactions 1994; 7: 328.
37 Mayo NE, Wood-Dauphinee S, Ahmed S, Gordon C, Higgins J, McEwen S, Salbach N. Disablement following stroke. Disabil Rehabil 1999; 21: 258–268.
38 Kornetti DL, Fritz SL, Chiu YP, Light KE, Velozo CA. Rating scale analysis of the Berg Balance Scale. Arch Phys Med Rehabil 2004; 85: 1128–1135.
39 Reuben DB, Seeman TE, Keeler E, Hayes RP, Bowman L, Sewall A, et al. Refining the categorization of physical functional status: the added value of combining self-reported and performance-based measures. J Gerontol A Biol Sci Med Sci 2004; 59: 1056–1061.
40 Duncan PW, Lai SM, Keighley J. Defining post-stroke recovery: implications for design and interpretation of drug trials. Neuropharmacology 2000; 39: 835–841.
41 Kwakkel G, van Peppen R, Wagenaar RC, Dauphinee SW, Richards C, Ashburn A, et al. Effects of augmented exercise therapy time after stroke – a meta-analysis. Stroke 2004; 35: 2529–2536.
42 Masiero S, Celia A, Rosati G, Armani M. Robotic-assisted rehabilitation of the upper limb after acute stroke. Arch Phys Med Rehabil 2007; 88: 142–149.

