OBJECTIVE: To select a questionnaire and walking capacity test based on comparison of clinimetric properties and mutual association to be used as “core” qualifiers for physical functioning in patients with late-onset sequelae of poliomyelitis.
DESIGN: Repeated-measures at 3-week intervals.
SUBJECTS: An unselected sample of 57 patients with late-onset sequelae of poliomyelitis from a prospective cohort study.
METHODS: Physical functioning scales from Short Form-36 (SF36-PF), Western Ontario and McMaster Universities Osteoarthritis Index (WOMAC-PF) and Nottingham Health Profile (NHP-PM). Timed-Up-and-Go test, 10-m walking at self-preferred and maximum speed, and 2-min walk test.
RESULTS: Test-retest reliability of SF36-PF and WOMAC-PF was good (intraclass correlation coefficient (ICC) 0.92 and 0.89, respectively), sufficient for NHP-PM (ICC 0.74) and excellent for walking tests (ICC 0.93–0.96). The smallest detectable changes were 18.4 and 16.5, respectively, for WOMAC-PF and SF36-PF, and 26.7 for NHP-PM. The smallest detectable change was best for the 2-min walk test (22.9 m). Correlation coefficients between questionnaires and walking tests ranged from 0.32 to 0.69, with the highest correlation between the SF36-PF and 2-min walk test.
CONCLUSION: The SF36-PF and 2-min walk test are recommended as core qualifiers for physical functioning, the major increasing disability in late-onset sequelae of poliomyelitis, to assess perceived physical performance and walking capacity in research and clinical practice.
Key words: post-poliomyelitis syndrome, rehabilitation, walking capacity, questionnaires, reproducibility.
J Rehabil Med 2008; 40: 387–392
Correspondence address: Janneke Stolwijk-Swüste, Department of Rehabilitation Medicine, VU University Medical Center, PO Box 7057, NL-1007 MB Amsterdam, The Netherlands. E-mail: j.stolwijk@rcamsterdam.nl
Submitted October 1, 2007; accepted January 15, 2008
Introduction
Many individuals with a history of poliomyelitis suffer from post-poliomyelitis syndrome (PPS) (1) and report increasing difficulties with physical functioning, such as walking, standing, climbing stairs and other mobility-related activities of daily life (2, 3). The International Classification of Functioning, Disability and Health (ICF) is a framework that describes the functional consequences of a disease at the level of body function and structure and daily activities and participation (4). The qualifiers used for the activities and participation domain are performance and capacity. Performance describes what an individual does in his or her current environment, whereas capacity describes an individual’s ability to execute a task or action. Self-administered questionnaires about self-perceived physical functioning provide information about the appreciation of the performance of an individual in his or her own environment. Capacity can be measured in a standardized environment with time-scored walking capacity tests at self-preferred or maximum speed (5, 6). In a clinical setting, walking at a comfortable speed is assumed to reflect walking capacity in daily life (7, 8).
An essential requirement of all outcome measures is that they are valid and reproducible. In studies, group comparisons are usually made, but in clinical practice, measurements are often used for individual evaluation purposes and to detect changes over time in a patient. Therefore, parameters of measurement error or agreement are important (9).
Comparing the results of studies focusing on patients with late-onset sequelae of poliomyelitis is difficult, because many different instruments have been used to assess physical functioning. The aim of the present study was to prioritize one questionnaire and one walking test from a number of questionnaires and tests that are widely used in post-polio populations by comparing their reproducibility, measurement range and mutual associations, in order to advocate their use as core qualifiers of physical functioning in research and clinical practice.
Methods
Study population
The patients in this study formed an unselected sub-group consisting of a consecutive series of 57 patients from a cohort of 168 patients, which has already been described in detail elsewhere (10). The patients were recruited from 2 university hospitals that specialize in the treatment of late-onset sequelae of poliomyelitis. The inclusion criteria were: (i) history of poliomyelitis anterior acuta; (ii) presence of residual paresis in at least one extremity; (iii) consultation (not necessarily the first consultation) with a neurologist or physical medicine and rehabilitation specialist in the previous 5 years; (iv) age 45–85 years; (v) no medical condition indicating a life-expectancy of less than one year. All patients gave their informed consent to participate in the study. The study has been approved by the medical ethics committee.
Measurement instruments
Perceived physical performance. Two questionnaires that are widely used were selected for this study: the Short Form-36 (SF36) (11–13) and the Nottingham Health Profile (NHP) (3, 7, 14–17). Furthermore, the Western Ontario and McMaster Universities Osteoarthritis Index physical functioning scale (WOMAC-PF) was selected. The WOMAC was originally designed to assess osteoarthritis (18), but has recently been reported as a suitable instrument to measure physical functioning in patients with late-onset sequelae of poliomyelitis (Steultjens et al.1).
Short Form-36. The SF36 is a self-administered questionnaire that measures generic health concepts, consisting of 9 multi-item scales: physical functioning, role limitations due to physical functioning, bodily pain, general health perceptions, vitality, social functioning, role limitations due to emotional functioning, general mental health and change in health (11). The SF36 physical functioning sub-scale (SF36-PF) consists of 10 questions scored on a 3-point scale. A sub-scale score is calculated, and each scale is scored from 0 to 100, with higher scores indicating higher levels of functioning or well-being. The SF36 has been translated and validated for the Dutch population (19).
Nottingham Health Profile. The NHP is a self-administered questionnaire that measures self-perceived health status, divided into 6 categories: physical mobility, energy, pain, social isolation, emotional reactions and sleep. The physical mobility category (NHP-PM) consists of 9 questions, with a score ranging from 0 (no complaints) to 100 (answered yes to all questions). To compare the NHP with the SF36 and the WOMAC, we transformed the score to 0–100, with higher scores indicating higher levels of functioning or well-being (no complaints). The Dutch version of the NHP-PM has been found to have satisfactory clinimetric properties in patients with chronic heart failure and myocardial infarction or stroke (14, 20).
Western Ontario and McMaster Universities Osteoarthritis Index. The WOMAC is commonly used as an outcome measure in osteoarthritis (OA) research (18), but it has recently been reported to be an adequate questionnaire for the measurement of physical functioning in patients with late-onset sequelae of poliomyelitis (Steultjens et al.1). The physical functioning sub-scale (WOMAC-PF) consists of 17 items concerning daily activities that primarily involve the lower extremities, such as walking, stair-climbing, and other transfers (sitting down, reclining). The WOMAC-PF is scored on a 5-point scale, ranging from 0 (no difficulty at all) to 4 (very much difficulty). A sub-scale sum-score is calculated, ranging from 0 to 100, with higher scores indicating higher levels of functioning or well-being. In OA populations the WOMAC-PF has been found to have excellent clinimetric properties (21). The Dutch version of the WOMAC makes valid international Dutch-English comparison possible after correction for differential item functioning (22).
1Steultjens MPM, Stolwijk-Swuste JM, Roorda LD, Dallmeijer AJ, van Dijk G, Post B, et al. Utility of the WOMAC-PF questionnaire in patients with Parkinson’s disease and late onset sequelae of poliomyelitis, in preparation.
Walking capacity
A wide range of walking tests has been used in this field of research to measure walking capacity (16, 23, 24). We selected 10 m walking at self-preferred and maximum speed, and the distance walked in 2 min at self-preferred speed. We chose the 2-min walk test, and not the 6-min walk test that is used in many other populations because we anticipated that a number of our patients would not be able to complete the 6-min walk test, thereby introducing selection bias. We added the Timed-Up-and-Go test (TUG), which can easily be included in a routine medical examination and which measures basic mobility skills that are used in everyday life, besides walking itself, and therefore might have a higher correlation with physical functioning questionnaires (25). The walking tests were performed indoors on a marked path.
Time needed to walk 10 m at self-preferred and maximum speed. The time needed to walk 10 m at self-preferred and maximum speed was timed on a stopwatch. The 10-m walking test has been shown to be valid and reliable (26).
Distance walked in 2 min at self-preferred speed. The patients walked at a self-preferred speed for 2 min, and the distance they covered was measured. The 2 min were timed on a stopwatch.
Timed-Up-and-Go test. The time needed to stand up from a sitting position, walk 3 m, turn around, walk 3 m back and sit down again in the chair, all at a self-preferred speed, was registered. This test has been shown to be valid and reliable (25, 27).
Assessment protocol
Two test-sessions were performed on 2 visits to the hospital that were scheduled with a 3-week interval. Prior to the visit to the hospital, the patients received the questionnaires and instructions on how to complete each questionnaire. They were asked to complete the questionnaires at home and to return them when they visited the hospital. At the hospital a physician interviewed the patients and administered the tests in a standard sequence.
Data analysis
Demographic data were analysed with descriptive statistics. The test-retest reliability for the walking tests and questionnaires was assessed by calculating the intraclass correlation coefficient (ICC) and the 95% confidence interval (CI) of the ICC, using a one-way random effects analysis of variance (28). A lower CI limit of at least 0.75 is considered as good test-retest reliability (29). Systematic differences between visits were tested by Student’s t-tests and agreement of the results for all walking tests and questionnaires was analysed according to the Bland-Altman method (30). The 95% limits of agreement (LOA) were calculated as mean (visit 2 – visit 1) ± 2 standard deviations (SD). The LOA represents the smallest detectable change (SDC) that can be detected within an individual. Normalized total scores on the first study visit were calculated to compare total scores and floor and ceiling effects of the questionnaires. Correlations between the questionnaires and the walking tests were calculated with Pearson’s correlation coefficient. Furthermore the unstandardized residuals for the different walking tests were tested with a paired Wilcoxon signed-rank test. An α-level of 0.05 was used for all tests of significance. The statistical analysis was performed in SPSS, version 12.0.1, statistical software package.
Results
The 57 patients (36 women, 21 men) had a mean age of 57.3 (SD 7.2) years. Their age at the acute polio stage varied from newborn to 17 years, with a median age of 2.0 years. The mean duration of new neuromuscular symptoms was 10.3 (SD 8.0) years.
Questionnaires
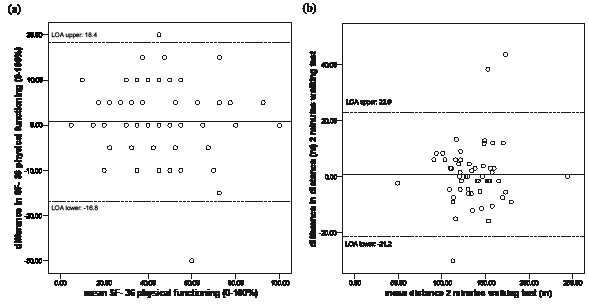
According to the ICCs the test-retest reliability of the SF36-PF and the WOMAC-PF scales was good (Table I). The test-retest reliability of the NHP-PM scale was moderate (Table I). There were no systematic differences between visits in the scores for all 3 questionnaires. The SDC within an individual was 16.5 for the WOMAC-PF, 18.4 for the SF36-PF (Fig. 1a) and 26.7 for the NHP-PM. The normalized total scores and floor and ceiling effects of the questionnaires at the first visit are presented in Table II. The mean normalized total score was highest for the WOMAC-PF (69 (SD 17)) and lowest for SF36-PF (44 (SD 22)); the NHP-PM total score was 67 (SD 17). None of the patients scored the lowest possible score on any of the 3 questionnaires. The maximum possible score was scored by one patient on the SF36-PF and the WOMAC-PF and by 2 patients on the NHP-PM.
| Table I. Reproducibility results for questionnaires to assess physical functioning |
| Outcome | Visit 1 | Visit 2 | D* | p | 95% LOA | ICC | 95% CI ICC |
| SF36 physical functioning | 44.4 (21.7) | 45.2 (20.7) | 0.8 (8.8) | 0.5 | –16.8, 18.4 | 0.92 | 0.86–0.95 |
| WOMAC physical functioning | 68.7 (16.9) | 68.9 (17.5) | 0.2 (8.2) | 0.8 | –16.1, 16.5 | 0.89 | 0.81–0.93 |
| NHP physical mobility | 67.3 (17.2) | 68.2 (18.2) | –0.9 (12.9) | 0.6 | –26.7, 24.9 | 0.74 | 0.59–0.84 |
| Values are means (standard deviation). *Mean difference between visits (second minus first visit). LOA: limits of agreement; 95% CI: 95% confidence interval; ICC: intraclass correlation coefficient; WOMAC: Western Ontario and McMaster Universities Osteoarthritis Index; NHP: Nottingham Health Profile. |
Fig. 1. Bland-Altman plots: (a) SF36 physical functioning scale; and (b) distance walking in 2 min at self-preferred speed. The solid line represents the mean difference (second minus first visit) and the dotted lines represent the 95% LOA (limits of agreement).
| Table II. Floor and ceiling effect for questionnaires on physical functioning |
| Outcome | Visit 1 | P25 | P50 | P75 | % floor | % ceiling |
| SF36 physical functioning | 44.4 (21.7) | 30.0 | 40.0 | 57.5 | 0 | 1.8 |
| WOMAC physical functioning | 68.7 (16.9) | 55.1 | 69.1 | 83.8 | 0 | 1.8 |
| NHP physical mobility | 67.3 (17.2) | 62.5 | 62.5 | 75.0 | 0 | 3.5 |
| Total scores are means (standard deviation) and 25th, 50th, 75th percentiles. % floor: % floor effect; % ceiling: % ceiling effect; WOMAC: Western Ontario and McMaster Universities Osteoarthritis Index; NHP: Nottingham Health Profile. |
Walking capacity tests
According to the ICCs, the test-retest reliability of the 10-m walking test at self-preferred and maximum speed, the distance walked in 2 min at self-preferred speed, and the TUG test was excellent (Table III). There were no systematic differences between visits in 10-m walking test at self-preferred speed, the distance walked in 2 min at self-preferred speed and the TUG. However, there was a small systematic difference between visits in 10-m walking test at maximum speed (a reduced walking speed during the second visit). For the 10-m walking at self-preferred speed and maximum speed the SDC was 1.9 sec, and 1.7 sec. For the TUG, the SDC was 2.4 sec, and for the 2-min walk test at self-preferred speed the SDC was 22.9 m (Fig. 1b).
Association between questionnaires and walking capacity tests
The correlations between the questionnaires and the walking tests are shown in Table IV, with SF36-PF (Pearson’s correlation 0.52–0.69) showing the highest correlations with the walking tests. The unstandardized residuals for the different walking tests were tested with a paired Wilcoxon signed-rank test and showed no significant differences between walking tests.
| Table IV. Correlations between questionnaires and walking capacity tests |
| | SF36 physical functioning | WOMAC physical functioning | NHP physical mobility |
| Timed-Up-and-Go test (sec) | –0.58* | –0.41* | –0.36* |
| 10-m self-preferred speed (sec) | –0.52* | –0.32* | –0.33* |
| 10-m maximum speed (sec) | –0.58* | –0.37* | –0.40* |
| Distance in 2 min walking at self-preferred speed (m) | 0.69* | 0.45* | 0.61* |
| Pearson’s correlation coefficient. *Significant at 0.05 level. WOMAC: Western Ontario and McMaster Universities Osteoarthritis Index; NHP: Nottingham Health Profile. |
Discussion
The aim of the present study was to select one physical functioning questionnaire and one walking capacity test from a number of frequently used valid instruments in patients with late-onset sequelae of poliomyelitis, as core qualifiers for the purpose of research and clinical evaluation. Based on the results, we would advocate the SF36-PF and the 2-min walk tests as the best options.
The population of this study is an unselected sample of a prospective cohort, based on a convenience sample from 2 university hospitals. Limitations to the cohort study are possible sampling biases, especially with the older patients. The 57 patients used in this study are an unselected sample of this cohort with no further bias and therefore results are in our opinion generalizable to the population of patients referred to a neurologist or physical medicine and rehabilitation specialist. The sample size of this study is adequate to answer the objectives of this study. Regarding reliability, a major criticism of the ICC is the influence of between-subjects variance on the ratio. In simple terms, the ICC is the ratio of true score variance (between-subjects variance) to true score variance plus error. If the true score variance is sufficiently large, reliability will always appear high and vice versa. Therefore, for a group of subjects with a wide range of measurement scores, the ICC is likely to be greater than for a more homogeneous sample group with similar measurement scores. Although ICCs are sensitive to variability between patients, this is of minor importance in this study since all the outcome measures are tested in the same population with the same patients with the same variability.
All the questionnaires showed good to sufficient test-retest reliability, in line with the findings reported in different diagnostic groups, such as multiple sclerosis (31). The limits of agreement indicate the ability to detect the smallest change in an individual’s self-perceived physical functioning. The SDCs of the SF36-PF and the WOMAC-PF scales were acceptable, with similar limited ability to detect change in an individual. Therefore, the 17 WOMAC-PF items scored on a 5-point scale are no more sensitive to detect change in an individual than the 10 SF36-PF items scored on a 3-point scale. The SDC for the NHP-PM was unacceptably large, and may be due to the limited number of items (9) and response options (yes/no), and the fact that one different response results in an 11% change in the total score. However, it is important to realize that, for research purposes, groups will be compared, and the sensitivity to detect a group change is considerably better than the sensitivity to detect an individual change.
The normalized scores for the NHP-PM and the WOMAC-PF are in the same range, whereas the SF36-PF scores were markedly lower, suggesting a lower health status. The dichotomous items of the NHP-PM have a high threshold for positive scoring (32), and are not likely to detect minor illnesses (33). An explanation for the lower scores on the SF36-PF is that the majority of the SF36-PF items contain walking and climbing stairs, which are increasingly difficult for our population (2, 3), whereas the WOMAC-PF also contains less difficult items, such as putting on/taking off socks, sitting, getting out of bed. For the SF36-PF, the NHP-PM, and the WOMAC-PF there was no ceiling or floor effect in our study population, and therefore this clinimetric characteristic does not limit the choice of questionnaires.
The test-retest reliability of all the walking capacity tests was good, and comparable to those reported in other studies (24, 34, 35). A significant difference between the first and the second visit was found for the 10-m walking test at maximum speed, i.e. a slower walking speed at the second visit. In the literature, findings on systematic retest differences are diverse: some studies have reported (a tendency towards) learning effects (36), whereas other studies reported no learning effect (24, 37). However, the significant difference in walking at maximum speed, i.e. slower at the second visit, was of little clinical importance, because the mean difference between the 2 visits was only 0.3 sec.
In our study population, the SDC of the distance covered in the 2-min walk test was greater than the SDC reported by Horemans et al. (24). The Bland-Altman plot (Fig. 1b) clearly shows 3 outliers with large differences between the 2 study visits in the distance walked. Omitting these outliers from the analysis results in an SDC of 14.0 m, which is comparable to the SDC reported by Horemans et al. (24).
A comparison of the SDCs of the 4 walking tests, with different measurement units (m and sec) and scale ranges, can only be made by expressing them as a percentage of the group mean scores for the test (Table III). This comparison suggests that the 2-min walk test has the best SDC.
| Table III. Reproducibility results for walking tests |
| Outcome | Visit 1 | Visit 2 | D* | p | 95% LOA (% change from the mean) | ICC | 95% CI ICC |
| Timed-Up-and-Go test (sec) | 10.8 (3.8) | 10.8 (4.1) | –0.1 (1.1) | 0.9 | –2.4, 2.1 (22.2; 19.4) | 0.96 | 0.93–0.98 |
| 10-m self-preferred speed (sec) | 9.7 (2.7) | 9.7 (3.0) | 0.1 (0.9) | 0.6 | –1.8, 1.9 (18.6; 19.6) | 0.95 | 0.91–0.97 |
| 10-m maximum speed (sec) | 7.7 (2.3) | 8.0 (2.4) | –0.2 (0.7) | 0.03 | –1.7, 1.2 (22.1; 15.6) | 0.95 | 0.92–0.97 |
| Distance in 2 min walking at self-preferred speed (m) | 136.0 (28.2) | 136.8 (29.3) | 0.9 (11.0) | 0.6 | –21.2, 22.9 (15.6; 16.8) | 0.93 | 0.88–0.96 |
| Values are means (standard deviation). *Mean difference between visits (second minus first visit). LOA: limits of agreement; 95% CI: 95% confidence interval; ICC: intraclass correlation coefficient. |
The SF36-PF scale showed the highest correlation with all the walking tests, and the 2-min walk test showed the highest correlation with all questionnaires, both without statistic significant differences. The TUG Test, which measures the basic mobility skills required for everyday life activities, did not show the highest correlation with physical functioning. The correlation of the SF36-PF with the walking capacity tests is in line with the findings of Noonan et al. (8) in patients with late-onset sequelae of poliomyelitis. The correlations found in the present study between physical functioning questionnaires and capacity measures are comparable with the correlations found in patients with fibromyalgia (38) and higher than in patients with total hip and knee arthroplasty (39). The SF36-PF and the WOMAC-PF showed similar reliability and ability to detect individual change, but because the correlations with the walking capacity tests were higher for the SF36-PF, we recommend the SF36-PF scale for the assessment of physical functioning.
In conclusion, the SF36 physical functioning scale and the 2-min walk test are recommended as core qualifiers to assess physical functioning in patients with late-onset sequelae of poliomyelitis. These should routinely be applied in research to facilitate the comparison of results, although cross-cultural differences in responses must be taken into account. They are also the most appropriate for use in clinical practice, because they have the greatest ability to detect individual changes. However, this does not exclude the addition of other outcome measures for specific research questions or evaluation purposes.
Acknowledgements
Participants in the CARPA study group: J. M. Stolwijk-Swüste, A. Beelen, F. Nollet, G. J. Lankhorst, J. Dekker, G. M. van Dijk, C. H. M. van den Ende, B. Post, R. J. de Haan and H. Speelman.
We wish to thank all those who participated in the study for their time and efforts. The study was supported by a grant from ZonMw, the Netherlands.
References
1. March of Dimes Foundation. Post-polio syndrome: identifying best practices in diagnosis & care. White Plains, NY: March of Dime; 2001.
2. Ivanyi B, Nollet F, Redekop WK, de Haan R, Wohlgemuht M, van Wijngaarden JK, de Visser M. Late onset polio sequelae: disabilities and handicaps in a population-based cohort of the 1956 poliomyelitis outbreak in the Netherlands. Arch Phys Med Rehabil 1999; 80: 687–690.
3. Nollet F, Beelen A, Prins MH, de Visser M, Sargeant J, Lankhorst GJ, et al. Disability and functional assessment in former polio patients with and without poliomyelitis syndrome. Arch Phys Med Rehabil 1999; 80: 136–143.
4. World Health Organization. International Classification of Functioning, Disability and Health: ICF. Geneva: WHO; 2001.
5. Willen C, Cider A, Sunnerhagen KS. Physical performance in individuals with late effects of polio. Scand J Rehabil Med 1999; 31: 244–249.
6. Thoren-Jonsson AL, Grimby G. Ability and perceived difficulty in daily activities in people with poliomyelitis sequelae. J Rehabil Med 2001; 33: 4–11.
7. Willen C, Grimby G. Pain, physical activity, and disability in individuals with late effects of polio. Arch Phys Med Rehabil 1998; 79: 915–919.
8. Noonan VK, Dean E, Dallimore M. The relationship between selfreports and objective measures of disability in patients with late sequelae of poliomyelitis: a validation study. Arch Phys Med Rehabil 2000; 81: 1422–1427.
9. De Vet HCW, Terwee CB, Knol DL, Bouter LM. When to use agreement versus reliability measures. J Clin Epidemiol 2006; 59: 1033–1039.
10. Stolwijk-Swuste JM, Beelen A, Lankhorst GJ, Nollet F. Impact of age and co-morbidity on the functioning of patients with late onset sequelae of poliomyelitis. J Rehabil Med 2007; 39: 56–62.
11. McHorney, CA, Ware, JE, Raczek AE. The Moss 36-item Short Form Health Survey (SF-36): II. Psychometric and clinical tests of validity in measuring physical and mental health constructs. Med Care 1993; 31: 247–263.
12. Trojan DA, Collet JP, Shapiro S, Jubelt B, Miller RG, Agre JC, et al. A multicenter, randomized, double-blinded trial of pyridostigmine in postpolio syndrome. Neurology 1999; 53: 1225–1233.
13. Finch LE, Venturini A, Mayo NE, Trojan DA. Effort-limited treadmill walk test: reliability and validity in subjects with postpolio syndrome. Am J Phys Med Rehabil 2004; 83: 613–623.
14. Erdman RA, Psschier J, Kooijman M, Stronks DL. The Dutch version of the Nottingham Health Profile: investigations of psychometric aspects. Psychol Rep 1993; 72 :1027–1035.
15. Horemans H, Nollet F, Beelen A, Lankhorst GJ. A comparison of 4 questionnaires to measure fatigue in postpoliomyelitis syndrome. Arch Phys Med Rehabil 2004; 85: 392–398.
16. Horemans H, Nollet F, Beelen A, Drost G, Stegeman DF, Zwarts MJ. Pyridostigmine in postpoliomyelitis syndrome: no decline in fatigue and limited functional improvement. J Neurol Neurosurg Psychiatry 2003; 74: 1655–1661.
17. Thoren-Jonsson AL, Hedberg M, Grimby G. Distress in everyday life in people with poliomyelitis sequelae. J Rehab Med 2001; 33: 119–127.
18. Bellamy N, Buchanan WW, Goldsmith CH, Campbell J, Stitt LW. Validation study of WOMAC: a health status instrument for measuring clinically important patient relevant outcomes to antirheumatic drug therapy in patients with osteoarthritis of the hip or knee. J Rheumatol 1988; 15: 1833–1840.
19. Aaronson NK, Muller M, Cohen PDA, Essink-Bot ML, Fekkes M, Sanderman R, et al. Translation, validation, and norming of the Dutch language version of the SF-36 Health Survey in community and chronic disease populations. J Clin Epidemiol 1998; 51: 1055–1068.
20. Visser MC, Koudstaal PJ, Erdman RA, Deckers JW, Passchier J, van Gijn J, et al. Measuring quality of life in patients with myocardial infarction or stroke: a feasibility study of four questionnaires in the Netherlands. J Epidemiol Community Health 1995; 49: 513–157.
21. Veenhof C, Bijlsma CJ, van den Ende CH, van Dijk GM, Pisters MF, Dekker J. Psychometric evaluation of osteoarthritis questionnaires: a systematic review of the literature. Arthritis Rheum 2006; 55: 480–492.
22. Roorda LD, Jones CA, Waltz M, Lankhorst GJ, Bouter LM, van der Eijken JW, et al. Satisfactory cross cultural equivalence of the Dutch WOMAC in patients with hip osteoarthritis waiting for arthroplasty. Ann Rheum Dis 2004; 63: 36–42.
23. Sorensen EJ, Daube ER, Windebank AJ. A 15-year follow-up of neuromuscular function in patients with prior poliomyelitis. Neurol 2005; 64: 1070–1072.
24. Horemans H, Beelen A, Nollet F, Lankhorst GJ. Reproducibility of walking at self-preferred and maximal speed in patients with postpoliomyelitis syndrome. Arch Phys Med Rehabil 2004; 85: 1929–1932.
25. Podsiadlo D, Richardson S. The timed “Up & Go” test: a test of basic functional mobility for frail elderly persons. J Am Geriatr Soc 1991; 39: 142–148.
26. Wade DT, Langton Hewer R. Functional abilities after stroke: measurement of natural history and prognosis. J Neurol Neurosurg Psychiatry 1987; 50: 177–182.
27. Simmonds MJ, Olson SL, Jones S, Hussein T, Lee CE, Novy D, et al. Psychometric characteristics and clinical usefulness of physical performance tests in patients with low back pain. Spine 1998; 23: 2412–2421.
28. Rankin G, Stokes M. Reliability of assessment tools in rehabilitation: an illustration of appropriate statistical analyses. Clin Rehabil 1998; 12: 187–199.
29. Fleiss J, editor. Statistical methods for rates and proportions. 2nd edn, 10th print edn. New York: Wiley; 1988.
30. Bland JM, Altman DG. Statistical methods for assessing agreement between two methods of clinical measurement. Lancet 1986; 1: 307–310.
31. Marrie RA, Miller DM, Chelune GJ, Cohen JA. Validity and reliability of the MSQLI in cognitively impaired patients with multiple sclerosis. Mult Scler 2003; 9: 621–626.
32. Prieto L, Alonso J, Ferrer M, Antó JM. Are results of the SF-36 health survey and the Nottingham Health Profile similar? A comparison in COPD patients. Quality of life in the COPD Study Group. J Clin Epidemiol 1997; 50: 463–473.
33. Hunt SM, MacEwen J, MackKenna SP, editors. Measuring health status. London: Croom Helm; 1986.
34. Rossier P, Wade DT. Validity and reliability comparison of 4 mobility measures in patients presenting with neurologic impairment. Arch Phys Med Rehabil 2001; 82: 9–13.
35. Morris ME, Cantwell C, Vowels L, Dodd K. Changes in gait and fatigue from morning to afternoon in people with multiple sclerosis. J Neurol Neurosurg Psychiatry 2002; 2: 361–365.
36. Green J, Forster A, Young J. Reliability of gait speed measured by a timed walking test in patients one year after stroke. Clin Rehabil 2002; 16: 306–314.
37. Gylfadottir S, Dallimor M, Dean E. The relation between walking capacity and clinical correlates in survivors of chronic spinal poliomyelitis. Arch Phys Med Rehabil 2006; 87: 944–952.
38. Mannerkorpi K, Svantesson U, Broberg C. Relationships between performance-based tests and patients’ ratings of activity limitations, self-efficacy, and pain in fibromyalgia. Arch Phys Med Rehabil 2006; 87: 259–264.
39. Kennedy D, Stratford PW, Pagura SM, Walsh M, Woodhouse LJ. Comparison of gender and group differences in self-report and physical performance measures in total hip and knee arthroplasty candidates. J Arthroplasty 2002; 17: 70–77.