INTERPRETING REHABILITATION OUTCOME MEASUREMENTS
Alan M. Jette, PhD, Wei Tao, BS, Anna Norweg, PhD and Stephen Haley, PhD
From the Boston University’s Health and Disability Research Institute, Boston, MA, USA
INTERPRETING REHABILITATION OUTCOME MEASUREMENTS
Alan M. Jette, PhD, Wei Tao, BS, Anna Norweg, PhD and Stephen Haley, PhD
From the Boston University’s Health and Disability Research Institute, Boston, MA, USA
OBJECTIVE: With the increased use of standardized outcome instruments in rehabilitation, questions frequently arise as to how to interpret the scores that are derived from these standardized outcome instruments. This article uses examples drawn from the Activity Measure for Post Acute Care to illustrate 4 different data analysis and presentation strategies that can be used to yield meaningful outcome data for use in rehabilitation research and practice.
DESIGN: A prospective cohort study in patients recruited at the point of discharge from a large acute care hospital or on admission to 1 of 2 rehabilitation hospitals after discharge from an acute care hospital in the greater Boston, MA region.
Sample: A total of 516 subjects in the Rehabilitation Outcome Study.
RESULTS: Four distinct approaches to analyzing and reporting outcome data are described to derive more meaningful outcome measurements: interpreting a single scale score; interpreting clinical significance of score changes; a percentile ranking method; and a functional staging approach. The first 3 methods focus on interpreting the numeric property of individual measurements and are best suited to assess individual outcomes and for detecting change. The fourth, a functional staging approach, provides an attractive feature of interpreting the clinical meaning provided by a particular quantitative score without sacrificing the inherent value of a quantitative scale for tracking change over time.
CONCLUSION: Users are encouraged to consider the range of analysis and presentation strategies available to them to evaluate a standardized scale score, both from a quantitative and a content perspective.
Key words: measurement, patient outcome assessment, statistics and numerical data, rehabilitation, methods.
J Rehabil Med 2007; 39: 585–590
Correspondence address: Alan M. Jette, Director, Health and Disability Research Institute, Boston University School of Public Health, 580 Harrison Ave., 4th floor, Boston MA 02118, USA. E-mail: ajette@bu.edu
Submitted February 22, 2007; accepted June 27, 2007.
Introduction
With the increased use of standardized outcome instruments in rehabilitation for the purposes of outcomes monitoring, quality of care monitoring, reimbursement and continuous quality improvement, as well as in rehabilitation research, questions frequently arise as how to interpret the meaning of scores that are derived from these standardized outcome instruments (1–7). For instance: What does a particular summary scale score mean? How does one interpret a change score on a particular outcome instrument? Has a particular patient achieved a level of improvement that can be judged as clinically relevant? The answers to these and related questions go beyond the question of statistical significance and are by no means obvious (8–10).
Outcome instruments used to assess the impact of rehabilitation interventions must meet several psychometric criteria. First and foremost, an outcome instrument must possess adequate levels of reliability (i.e., the degree to which they yield consistent scores when applied by different raters or over time) and demonstrate sufficient validity (i.e., measure the outcome it is intended to assess). An instrument that possesses sufficient reliability and validity still may not make a good outcome instrument. To be truly useful as an outcome tool, scores derived from an outcome instrument must also be interpretable by the user (i.e., have clinical meaning) and be sensitive to change (i.e., be able to detect a change in an outcome that has clinical relevance or importance).
The intent of this article is to provide the reader with 4 different analysis and presentation strategies drawn from the outcome measurement tradition that may be useful for deriving meaningful interpretations of scores derived from standardized outcome instruments of the type frequently used in rehabilitation. To accomplish this task, we draw on data collected using the Activity Measure for Post Acute Care (AM-PAC), an outcome instrument designed to assess elements of the activity limitations domain from the International Classification of Functioning, Disability and Health (ICF) framework (11).
Methods
Study sample
The Rehabilitation Outcomes Study is a prospective cohort study of 516 adults aged 18 years and older recruited at the point of discharge from a large acute care hospital or on admission to 1 of 2 rehabilitation hospitals after discharge from an acute care hospital in the greater Boston, MA region. Participants in the Rehabilitation Outcomes Study were interviewed at discharge, 1-, 6-, and 12-months after acute care or rehabilitation hospital care. Inclusion criteria for the Rehabilitation Outcomes Study included a primary diagnosis of neurological disorder, lower extremity orthopedic trauma, or medically complex conditions; currently receiving and/or about to be referred to skilled rehabilitation services (physiotherapy, occupational therapy, or speech and language pathology); able to speak and understand English; and a prognosis for survival of one year, as determined by the primary physician or a facility recruiter via medical record review. Exclusion criteria included inability to give informed consent based on information in the medical record and/or discussions with treating clinicians, any orientation deficit, difficulty remembering the day’s events, and receptive or expressive communication deficits that precluded the patient from communicating responses reliably (verbally or non-verbally). Details of the recruitment strategy of the Rehabilitation Outcomes Study have been described previously (12).
The initial sample comprised 516 patients. There were slightly more women than men (53% vs 47%) and a greater percentage classified in the complex medical category (44%) compared to the lower extremity orthopedic (32%) and neurological (24%) categories. The mean age of participants was 68.3 years, however the range extended from 19 to 100 years with about 20% of subjects younger than age 50 years. At follow-up, 417 (81%) of participants were seen at 1 month, 370 (72%) were interviewed at 6 months and 336 (65%) were seen again at 12 months.
AM-PAC instrument
The AM-PAC is an activity limitations measurement instrument developed based on the ICF (13). In developing the AM-PAC, we employed 2 different samples for a combined sample size of over 1000 post acute care patients (14). We developed an initial pool of AM-PAC items based upon input from measurement and content experts, suggestions from several focus groups of persons with disabilities and a comprehensive literature review. Some items were modified from existing functional instruments, and questions were framed without specific attribution to health, medical conditions, or disabling factors. AM-PAC data are collected by self-report, either through self-administration, or when administered either by a clinician or by a trained data collector. In this study, patients were asked to answer a short-form version of the AM-PAC instrument after discharge and at 1-, 6- and 12-month follow-up periods. The illustrative analyses for this paper were done on one AM-PAC scale, the Basic Mobility (BM) scale which contains 20 items drawn from a 101-item pool (15). The 20 functional tasks used to assess the BM domain of the AM-PAC use 2 different response patterns. Seventeen items rate patients’ abilities to do tasks according to a 4-option response: 1. Cannot do; 2. A lot of difficulty; 3. Some/a little difficulty; and 4. No difficulty. The remaining 3 items rate how limited patients are in doing certain tasks on a 3-option response: 1. Yes, limited a lot; 2. Yes, limited a little; and 3. Not limited at all. Test-retest reliability estimates for the AM-PAC ranged from 0.91 to 0.97 (15).
Approaches to Deriving Meaningful Measurements
There are 4 distinct data analysis and presentation approaches that we believe are worth considering when deriving meaningful and interpretable measurements for rehabilitation outcome instruments. They are: interpreting a single scale score; interpreting clinical significance of score changes; a percentile ranking method; and finally, functional stages. Each is discussed and illustrated below with data drawn from the Rehabilitation Outcome Study using the fixed-form version of the AM-PAC instrument.
Method 1. Interpreting a single scale score
The first and most basic approach to assessing and interpreting outcome data drawn from a standardized instrument is to construct a continuous scale from instrument items and to derive and interpret single quantitative scores from those scales.
We illustrate this first approach using the BM scale of the AM-PAC. The BM scale of the AM-PAC instrument was developed using Item Response Theory (IRT), a contemporary measurement technique (16). IRT models have the ability to generate a global continuous summary score (point estimate) for each patient on the AM-PAC’s BM scale, as well as standard error of estimate associated with each summary score. Metrics of the scale score could bear any form, but the most often used metrics are z-score, t-score and 0–100 scale score.
In addition to generating a summary score, using IRT models to develop a scale score allows one to generate a standard error of estimate (SEE) for each individual score. SEE is very useful since it allows the user to estimate the precision of a particular measurement. For example, if we ask a patient to take the same questionnaire infinite number of times disregarding any effect of the previous administration on the later one, each time we may get a different score due to random errors, or measurement error. If we plot all the scores for the same person on the plot, SEE is the standard deviation (SD) of this distribution around the patient’s true ability level. Therefore, SEE can be used to construct confidence intervals (CI) for a particular outcome scale score.
Example. To illustrate how to use SEE to interpret quantitative scores, we selected a subject from the Rehabilitation Outcomes Study (called Mrs Jones) and used her BM scores for the 3 follow-up visits as an example of how to use single continuous scale scores. The same case will be used later in the paper to present score interpretations using other approaches.
Table I shows Mrs Jones’ scores on the BM domain of the AM-PAC at 3 different time points. The columns of “Point Estimate” and “SEE” are estimates from IRT analysis on a 0–100 metric scale.
For Mrs Jones, her BM scale scores are 47.5, 58.8 and 76.5 on 3 follow-up visits, respectively. Since the scale metric runs from 0 to 100, we can roughly visualize the patient’s position on the scale. As time goes by, Mrs Jones’ BM score moves to a higher level each time, illustrating that her basic mobility has improved over the 12-month period.
The SEE in Table I informs us of the precision of the scale scores at each assessment. Since any short-form instrument is designed to be only good at measuring certain range of abilities, the precision level is different for each individual score and decreases as the patient’s ability deviates away from where the instrument is measuring the best.
| Table I. Activity measure for post acute care basic mobility score estimate for Mrs Jones | ||||
| Visit at month | Scale score | SEE | *95% confidence band (1.96*SEE) | CI [lower, upper] (point estimate ± c. band) |
| 1 | 47.5 | 3.12 | ± 6.1 | [41.3, 53.6] |
| 6 | 58.8 | 2.68 | ± 5.3 | [53.5, 64.0] |
| 12 | 76.5 | 4.73 | ± 9.3 | [67.2, 85.7] |
| SEE: standard error of estimate; CI: confidence interval. | ||||
Mrs Jones’ BM score at the second visit is 58.8, measured with the greatest precision (SEE = 2.68), while her BM estimate at the 12-month is 76.5, measured the least precisely (SEE = 4.73). In addition to describing how precisely scores are measured, SEE is used to construct a CI for each scale score estimate on the BM scale. The last 2 columns in Table I list the 95% confidence band in half length (calculated by multiplying SEE by 1.96) and the 95% CI for the point estimate. The CI for this patient’s ability estimate at the 1-month visit is 41.3–53.6, indicating 95% confidence that the patient’s true movement ability level, 1 month after discharge from hospital, is between 41.3 and 53.6.
There are several important drawbacks to interpreting a single scale score. First, this approach tells the user nothing about how to interpret the meaning of an individual score value along the scale being assessed. Furthermore, although this approach describes whether a particular score change is likely due to measurement error or not, it does not inform the user as to whether or not the observed change is of clinical importance. These deficiencies lead to the need for other approaches to interpreting outcome scores.
Method 2. Interpreting clinical significance of score changes
Change scores between 2 AM-PAC assessments at different time-points (e.g. admission and discharge from inpatient rehabilitation) can be calculated as a way to examine a patient’s change in function or effect of treatment. One challenge encountered when interpreting change scores, however, is to determine how much change should occur to determine whether the amount of change the patient has made is significant.
The word significance can assume 2 different meanings relevant to interpreting change scores: statistical significance and clinical significance. Statistical significance means that patients’ scores have changed after taking into account the influence of measurement and/or sampling errors. In contrast, clinical significance refers to the degree to which the amount of change has clinical meaning or relevance. Statistical significance does not necessarily imply clinical significance.
Statistical significance. As described under Method 1, statistical significance can be tested using the SEE. In IRT, the SEE will be generated for each ability score. With SEE, we can establish a CI around a scale score, and examine whether the score changes are statistically significant by comparing 2 CI. When there is no overlapping, we say the 2 scores are statistically different, meaning the magnitude of the difference is large enough to go beyond the measurement error. In practice, the Standard error of measurement (SEM) is used to calculate many change indices. Alternatively, SEM is a test statistic generated under the Classical Test Theory and can be thought of as an average of all SEEs generated from IRT models. An SEM value is invariant for every ability estimate along the scale.
The index of Minimal Detectable Change (MDC), also called smallest detectable difference, represents the safest threshold for identifying statistically detectable individual changes (16), and calculated by the following formula:
MDC = zlevel of confidence * SquareRoot[2]*SEM, (SEM = ´SD*SquareRoot [1–r])
…where z represents the z score in a unit normal distribution corresponding a desired level of confidence (e.g. 2-detailed: z0.95 = 1.96); SD is the standard deviation of the baseline (in our example, it is a previous visit to be compared with a later one); and r is the coefficient of either internal or test-retest reliability. If we set the confidence level at 0.95, z = 1.96,
MDC95 = 1.96*SquareRoot[2]*SEM = 2.77SEM
Clinical significance. Establishing statistical significance does not necessarily imply clinical meaning in the observed change. Assessing the clinical significance of scale score changes can be approached using several indices, such as Clinical Significant Difference (CSD), Minimal Clinically Important Differentce (MCID), or Minimal Important Difference (MID) (17, 18). MCID is defined as the smallest difference in a score of a domain of interest that patients perceive to be beneficial and that would mandate, in the absence of troublesome side effects and excessive costs, a change in the patient’s management (18).
Though clinical significance is the ultimate concern, identification of magnitude of MCID cannot be separated from the SEM. The question is, how many SEMS does an individual’s score need to change for that change to be considered clinically meaningful (18)? While there is no consensus, the 3 most commonly used coefficients to assess clinical significance are: 1 SEM, 1.96 SEM and 2.77 SEM (1.96*√2). In general, coefficients are established to reflect the change measured by certain external anchors such as patient self-reported change or an objective clinical assessment (18).
Example. In a previous reliability and validity study on the AM-PAC BM scale, we estimated the reliability for the BM domain to be 0.96, which will be used to calculate SEM in this example. Table II lists the SD, 1 SEM, 1.96 SEM and 2.77 SEM for Mrs Jones’ BM scores at 3 follow-up visits. Mrs Jones’ BM score increased by 10.3 points from 47.5 to 58.8 between 1- and 6-month visits. This increase exceeded even the largest criterion of 2.77 SEM indicating a significant clinical change. Similarly, her basic mobility increased by 17.7 points from 58.8 to 76.5 between the 6- and 12-month visits, which also exceeds the largest criterion. Therefore, Mrs Jones has made clinically significant improvements in her basic mobility between adjacent visits as estimated by the AM-PAC scale.
| Table II. Activity measure for post acute care basic mobility scale standard deviation (SD) and standard error of measurement (SEM) for 3 assessment periods | ||||
| Visit at month | SD | SEM | 1.96 SEM | 2.77 SEM (MDC) |
| 1 | 9.36 | 1.87 | 3.67 | 5.18 |
| 6 | 10.73 | 2.15 | 4.21 | 5.96 |
| 12 | 11.20 | 2.24 | 4.39 | 6.20 |
| MDC: minimal detectable change. | ||||
While Method 2 does inform the user as to whether or not the magnitude of the observed change is of clinical relevance, this approach still falls short of telling the user how to interpret the meaning of an individual score value along the scale being assessed. It focuses on the numeric properties of change scores rather than their clinical interpretation of a particular outcome score. Two additional approaches are available to the user to more directly address clinical meaningfulness of change scores.
Method 3. Percentile rank method
Probably the most commonly used approach for interpreting individual outcome scale scores is the percentile rank method, which compares a patient’s functional ability with a representative “normal group” of subjects who have been assessed previously with that instrument. Table III presents the percentile ranks based on the calibration group for the AM-PAC BM scale for the 1-month follow-up visit in the Rehabilitation Outcomes Study. In our example, Mrs Jones achieved a score value of 47.5 on the BM scale for this 1-month follow-up visit. As Table III illustrates, her percentile rank is 13, meaning only 13% of patients in the normative data scored below her. This information informs us that in comparison to the normative group’s basic mobility, Mrs Jones is functioning at a very low end of the scale.
| Table III. Activity measure for post acute care basic mobility domain score percentile rank (PR) | |||||
| Score | PR (%) | Score | PR (%) | Score | PR (%) |
| 29.17 | 0 | 55.58 | 46 | 65.30 | 80 |
| 35.50 | 1 | 56.20 | 48 | 65.66 | 82 |
| 37.73 | 1 | 56.38 | 50 | 66.28 | 83 |
| 39.61 | 2 | 57.18 | 53 | 66.64 | 84 |
| 41.21 | 3 | 57.98 | 54 | 67.26 | 86 |
| 42.11 | 4 | 58.79 | 56 | 67.62 | 87 |
| 42.64 | 4 | 58.97 | 57 | 68.33 | 89 |
| 43.98 | 5 | 59.68 | 60 | 68.60 | 89 |
| 45.23 | 7 | 59.86 | 61 | 69.49 | 90 |
| 46.39 | 10 | 60.48 | 63 | 69.76 | 91 |
| 47.46 | 13 | 60.75 | 64 | 70.83 | 92 |
| 48.53 | 15 | 61.28 | 65 | 71.01 | 93 |
| 49.51 | 18 | 61.64 | 67 | 72.26 | 95 |
| 50.49 | 23 | 62.18 | 70 | 72.52 | 95 |
| 51.38 | 28 | 62.53 | 72 | 74.04 | 96 |
| 52.27 | 33 | 62.98 | 75 | 74.22 | 97 |
| 53.08 | 35 | 63.43 | 75 | 76.45 | 98 |
| 53.97 | 37 | 63.87 | 76 | 79.13 | 98 |
| 54.24 | 38 | 64.41 | 78 | 83.05 | 100 |
| 54.77 | 41 | 64.76 | 78 | 100.00 | 100 |
Method 3 is more informative compared with the previous 2 methods since it provides the user with a context in which to interpret an individual functional scale score. By doing so, it provides us with additional meaningful information with which to interpret the patient’s location along the functional continuum. However, the percentile ranking method’s utility depends greatly on the quality of the available normative data for a particular scale. This can be a serious limitation with relatively new scales like the AM-PAC where normative data on representative samples of individuals are not readily available.
Method 4: Functional staging
One major disadvantage of all 3 previous methods for interpreting quantitative outcome scales is that each is focused on the numeric property of the scores rather than the clinical meaningfulness of the information provided by the particular quantitative scores. For example, the AM-PAC scores may tell us the relative position of a patient when compared with a normative population (Method 3), but they do not readily define the functional abilities of a patient at a particular scale level and thus, are less informative to a clinician who is trying to interpret the scores. This is true even for the index of MCID, which tells us whether the magnitude of change on a scale is clinically meaningful, but does not inform what the new level of the outcome means clinically.
To overcome this limitation with the 3 previously discussed methods of interpreting scale scores, we present a fourth method called “functional stages”, a data interpretation approach that helps a user interpret a patient’s quantitative outcome scores from scales derived using IRT methods (16). The “functional staging” approach uses terms that communicate functional meaning without sacrificing the inherent value of a quantitative scale for measuring change over time (19–21). We will discuss briefly the “functional stages” approach as we have used it to help interpret the BM scale of the AM-PAC, and especially focus on how to use the approach to make meaningful score interpretations.
The basic idea of functional staging is to develop a set of hierarchical stages by determining several cut scores along the outcome continuum generated from an IRT analysis. Stages are hierarchical and cover the entire range of the outcome being measured. Having established estimates of an individual’s outcome ability and the cut score values on a particular outcome scale, one can classify a patient into different stage levels to achieve a detailed description of an individual’s expected ability within each outcome stage. Categorizing an outcome scale into different stages will help the user understand the kind of activities a patient can accomplish at each stage along an outcome continuum.
The development of a functional staging plan can be summarized into 2 major steps: (i) Construct a staging definition, which specifies the number of stages and the expected functional performance of patients classified into each stage; and (ii) Based on the staging definition established in step (i), set up (m–1) cut scores (m = number of stages) along the ability continuum. A valid staging plan is closely related to the process in deciding cut scores. In our work with the AM-PAC functional stages we have applied the bookmark method in determining the cut scores on each AM-PAC scale (22).
In our analyses on the AM-PAC scale data, we defined 5 hierarchical stages by establishing 4 cut scores based on a pre-defined staging definition for the BM domain. The staging definition specifies the number of stages and describes the expected performance of patients in each stage. Table IV presents the staging definition for the BM domain. For example, lower stages describe patients’ movement as limited within a room or a building, while higher stages identify patients as being able to move outside or do sports.
In addition to the staging definition in Table IV, we have constructed a staging chart in Fig. 1 to link patients’ stage level with their expected performance on each of the functional tasks measured in the fixed form of AM-PAC’s BM scale. In Fig. 1, four cut scores divided the entire BM scale into 5 functional stages. The cut score values, indicated at the end of the chart, show that 34 is the cut score between functional stage 1 and stage 2; 52 is the cut score between functional stage 2 and stage 3; and so forth. For example, if Mrs Jones were to score 30 on the AM-PAC’s BM scale, she would belong to functional stage 1; if she achieved a score of 70, she would be functioning in stage 4.
| Table IV. Functional staging plan for activity measure for post acute care´s basic mobility scale | |||||
| Stages (score range) | |||||
| Activity range | Stage 1 (0–34) | Stage 2 (35–52) | Stage 3 (53–66) | Stage 4 (67–84) | Stage 5 (85–100) |
| One room | Unable/A lot of difficulty | Some difficulty | Able | Able | Able |
| Inside a building | Unable | limited | Some difficulty | Able | Able |
| Outside | Unable | Unable | Limited | Able | Able |
| Sports | Unable | Unable | unable | limited | Able |
As soon as a patient’s functional stage has been determined within an AM-PAC scale, the user can interpret the meaning of that stage by reflecting on the functional items within that stage. In Fig. 1, for example, each bar represents a specific functional task included in the AM-PAC’s BM domain. Since most of the BM items have 4-option responses, i.e. 1. Cannot do; 2. A lot of difficulty; 3. Some/A little difficulty; or 4. No difficulty to accomplish the task, the 4 categories are color coded in the chart. Items are grouped according to whether they are measuring 4 components in the staging plan of basic mobility: within a room, within a building, outside a building or sports activities. The item groups are sorted from the easiest to the most difficult; moving within a room is the easiest component and sports activities is the most difficult one.
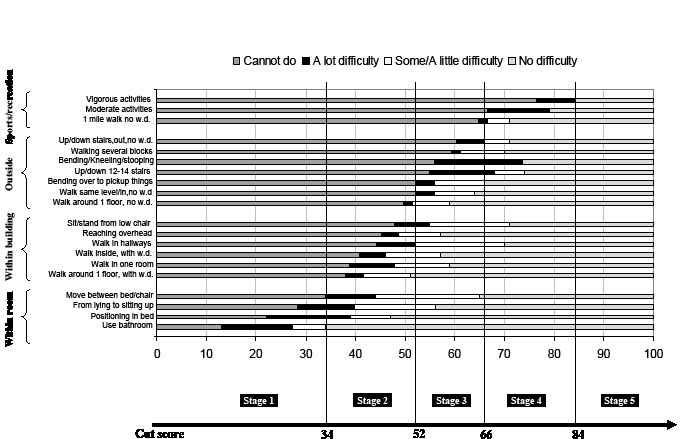
Fig. 1. Expected performance at each stage of the basic mobility domain. WD: walking device.
Using the functional stages method, we can interpret the BM stage level of a patient. For example, patients classified in BM stage 1 (score 0–34) cannot or have great difficulty in moving within a room, and cannot move within or outside a building; Patients in BM stage 2 (score 35–52) can move within a room but are limited in moving within a building and cannot move outside; patients in BM stage 3 only have a little difficulty in moving within a building, but still have great difficulty moving outside a building; while patients in BM stage 4 have a little difficulty moving outside and cannot do moderate or vigorous sports activities; and finally patients in the highest stage (BM Stage 5) have no problem in movement.
Example. Mrs Jones scored 47.5, 58.8 and 76.5 on the BM scale for the 3 follow-up visits, respectively. Based on the cut scores illustrated in Fig. 1, we know that Mrs Jones was at BM stage 2, 3 and 4 for each visit, respectively. Based on the staging definition in Fig. 1, we see that one month after discharge from the hospital, Mrs Jones’ basic mobility level was at BM stage 2, meaning that her mobility was limited within a room. She could move inside a building but with great difficulty, and couldn’t do any outside movement. At the 6th month assessment, her BM stage level had increased from BM stage 2 to 3. Now she had limitation in outside mobility and had little difficulty moving within a building. Finally, at the 12-month assessment, she reached BM stage 4, indicating she had little problem in general outside mobility, but could still not do some vigorous sports activities.
Previously, using Methods 1, 2 and 3, we knew Mrs Jones had achieved statistically significant and clinically significant changes between adjacent visits, but we did not know what kind of functional activities she could do at each assessment point. The Functional Staging approach combines the advantages of categorical and quantitative approaches to assessment.
Discussion
We have presented 4 approaches to assessing the meaning of scores derived from standardized outcome instruments used with increasing frequency within the rehabilitation field. They are: interpreting a single scale score; interpreting clinical significance of score changes; a percentile ranking method; and a functional staging approach. The first 3 of these dimensional methods for interpreting quantitative scale scores focus on the numeric property of the scores and are best suited to differentiate among different outcome scores and for interpreting the meaning of different levels of change. The fourth, a functional staging approach, although less frequently used in rehabilitation, provides an attractive option for interpreting the clinical meaning provided by a particular quantitative score derived from instruments constructed with contemporary measurement methods (23).
Because of the complexity of scoring rules inherent in most standardized outcome instruments and the difficulty in interpreting them, scale scores at times fail to provide a user with adequate descriptive information for interpreting outcome assessment scores, and thus can prove a barrier for widespread use and understanding of outcome data in rehabilitation. Functional stages, on the other hand, can assist in classifying patients according to ranges of continuous outcome scores, are easy to remember, and allow for description in simple tabular form that is more accessible to the user than continuous data. The functional staging approach helps a user interpret a patient’s quantitative scores within a particular outcome domain without sacrificing the inherent value of a quantitative scale for tracking change over time.
As standardized outcome instruments are used with increasing frequency in rehabilitation clinical practice and research, pressure will grow to provide users with better information on the clinical meaning and interpretation of scores derived from these tools. Users are encouraged to consider the range of analysis and presentation strategies available to them to evaluate a standardized scale score both from a quantitative and a content perspective. Standardized outcome instruments will become much more accepted into rehabilitation practice and research if techniques, such as those presented and discussed in this article, are used with more frequency to help users interpret score values and to evaluate the clinical meaningfulness of change associated with rehabilitation intervention.
References
1. Johnston MV, Steinman M, Velozo CA. Outcomes research in medical rehabilitation: foundations from the past and directions to the future. In: Fuhrer MJ, editor. Assessing medical rehabilitation practices: the promise of outcomes research. Baltimore, MD: Paul H. Brooks Publishing Co.; 1997, p. 1–41.
2. Beaton D, Tarasuk V, Katz JN, Wright JG, Bombardier C. Are you better? A qualitative study of the meaning of recovery. Arthritis Rheum 2001; 45: 270–279.
3. Iezzoni LI, Greenberg M. Capturing and classifying functional status information in administrative databases. Health Care Financ Rev 2003; 24: 61–76.
4. Wyrwich KW, Nienaber NA, Wolinsky FD. Linking clinical relevance and statistical significance in evaluating intra-individual changes in health-related quality of life. Med Care 1999; 37: 469–478.
5. Steinberg E. Improving the quality of care – can we practice what we preach? New Engl J Med 2003; 348: 2681–2683.
6. Institute of Medicine. Crossing the quality chasm: a new health system for the 21st century. Washington DC: National Academy Press; 2001.
7. Mitchell P, Lang NM. Framing the problem of measuring and improving health care quality: Has the quality health outcomes model been useful. Med Care 2004; 42 Suppl 2: S4–S11.
8. Baillie AJ. A new approach in the determination of the minimal clinically meaningful difference. J Clin Epidemiol 2004; 57: 647–648.
9. Wells G, Beaton D, Shea B, Maarten B, Simon L, Strand V, et al. Minimal clinically important differences: review of methods. J Rheumatol 2001; 28: 406–412.
10. Stratford PW, Riddle DL. Assessing sensitivity to change: choosing the appropriate change coefficient. Health Qual Life Outcomes 2005; 3: 23.
11. Haley SM, Coster WJ, Andres PL, Ludlow LH, Ni P, Bond TL, et al. Activity outcome measurement for post-acute care. Med Care 2004; 42: I-49–I-61.
12. Jette AM, Keysor JJ, Coster WJ, Ni PS, Haley SM. Beyond function: predicting participation outcomes in a rehabilitation cohort. Arch Phys Med Rehabil 2005; 86: 2087–2094.
13. Haley SM, Andres PL, Coster WJ, Kosinski M, Ni PS, Jette A. Short-form activity measure for post-acute care (AM-PAC). Arch Phys Med Rehabil 2004; 85: 649–660.
14. Haley S, Ni P, Hambleton R, Slavin M, Jette A. Computer adaptive testing improves accuracy and precision of scores over random item selection in a physical functioning item bank. J Clin Epidemiol 2006; 59: 1174–1182.
15. Andres P, Haley S, Ni P. Is patient-reported function reliable for monitoring postacute outcomes? Am J Phys Med Rehabil 2003; 82: 614–621.
16. Hambleton R, Swaminathan H, Rogers H, editors. Fundamentals of item response theory. Newbury Park, CA: Sage Publications; 1991.
17. Wyrwich, KW. Minimal important difference thresholds and the standard error of measurement: is there a connection? J Biopharm Stat 2004; 14: 97–110.
18. Haley SM, Fragala-Pinkham MA. Interpreting change scores of tests and measures used in physical therapy. Phys Ther 2006; 86: 735–743.
19. Stineman MG, Ross RN, Fiedler R, Granger CV, Maislin G. Staging functional independence validity and applications. Arch Phys Med Rehabil 2003; 84: 38–45.
20. Stineman MG, Ross RN, Fiedler R, Granger CV, Maislin G. Functional independence staging: conceptual foundation, face validity, and empirical derivation. Arch Phys Med Rehabil 2003; 84: 29–37.
21. Jette DU, Warren RL, Wirtalla C. Validity of functional independence staging in patients receiving rehabilitation in skilled nursing facilities. Arch Phys Med Rehabil 2005; 86: 1095–1101.
22. Lewis DM, Mitzel HC, Green DR, Patz RJ, editors. The bookmark standard setting procedure. Monterey, CA: McGraw-Hill; 1999.
23. Jette A, Haley S. Contemporary measurement techniques for rehabilitation outcome assessment. J Rehabil Med 2005; 37: 339–345.

