OBJECTIVE: The aim of this prospective study was to confirm the accuracy of a short assessment battery, used previously in a study to predict fitness-to-drive after stroke, in a new cohort of stroke survivors without severe deficits.
DESIGN: A prospective study.
SUBJECTS: A total of 43 (39 men and 4 women) consecutive survivors after stroke who were not severely impaired and who performed the pre-driving assessment, which included a standardized on-road test at the Belgian Road Safety Institute in Brussels, Belgium. On average, participants were 6 months post-stroke, independently ambulant with or without assistive devices, possessed valid drivers’ licenses and actively drove prior to stroke onset.
METHODS: Fitness-to-drive decisions based on performance in 15 tests of a full-scale assessment battery were predicted using only the scores from the 3 predictive tests previously identified.
RESULTS: When the discriminant equation from the previous study including performance in the 3 tests (figure of Rey, visual neglect (lateralized mean reaction time) and on-road test) was applied, 37 (86%) of the 43 participants were correctly predicted to pass or fail the pre-driving assessment. The sensitivity and specificity of the predictions were 77% and 92%, respectively.
CONCLUSION: This study shows that the short assessment battery is a good predictor of fitness-to-drive in stroke survivors with moderate physical and cognitive impairments.
Key words: cerebrovascular accident, motor vehicles, neuropsychological tests, visual tests, road test, rehabilitation.
J Rehabil Med 2007; 39: 698–702
Correspondence address: Akinwuntan Abiodun Emmanuel, Department of Physical Therapy, School of Allied Health Sciences, Medical College of Georgia, Augusta, 30912-0800 GA, USA. E-mail: aakinwuntan@mcg.edu
Submitted February 15, 2007; accepted May 24, 2007.
Introduction
Despite the reducing mortality rate due to stroke in industrialized countries (1), stroke remains one of the major causes of death and disabilities around the world. Annually, approximately 18,500 people experience new or recurrent stroke in Belgium, of whom 47% die within the first 12 months of the incident (2). Approximately 50% of stroke survivors wish to resume driving (3). There are only a few countries with clearly defined procedures or guidelines for resumption of driving after stroke. In these countries (4–8), stroke survivors often perform visual and cognitive off-road assessments (paper-and-pencil or computer-based) and only those who pass are further tested on-road. The eventual decision about who is fit to drive is based on performance in the on-road test.
The ability to perform well in an on-road evaluation is determined by the level of transfer of good off-road skills or adequate compensation for poor off-road skills during driving. While off-road assessments may be useful in predicting on-road performance, they cannot identify stroke survivors who are able to overcome their off-road deficits by adopting effective compensatory strategies during on-road driving. A possible compensation for inattention to one side of the visual space is to pay more attention to that side during driving (by adaptive visual search and head turn). Slow driving, especially at off-peak hours, can be adopted to compensate for problems of delayed reaction time. Patomella and colleagues (9) recommended including both off-road and on-road tests in the entire assessment to determine fitness-to-drive after stroke.
In a recent prospective study, a short battery that included an on-road test and 2 off-road tests (figure of Rey and test of visual neglect) was developed (10). The accuracy of the short battery in predicting fitness-to-drive (not just on-road performance) of a subgroup of stroke survivors was 87%. The sensitivity and specificity of the predictions were 79 and 94%, respectively. Without doubt, the high predictive accuracy of this short battery is due to the inclusion of the on-road test in the battery, which makes the prediction difficult to compare with findings in other studies (4–8). The aim of this study was to investigate whether the short battery predicts fitness-to-drive in a different cohort of stroke survivors with the same or better accuracy.
Methods
Participants
Belgian law (11) stipulates that all persons who wish to drive after a stroke must visit the Centre for Determination of Fitness to Drive and Car Adaptations (CARA), a unit of the Belgian Road Safety Institute in Brussels for a pre-driving assessment, at the earliest 6 months after stroke onset. Prior to the visit, an extensive medical questionnaire completed by each stroke survivor and his or her physician is sent to CARA. Upon arrival at CARA, a neurologist further examines each candidate and if found unfit to perform the pre-driving assessment due to the presence of severe post-stroke deficits, the candidate is asked to return at a later date in anticipation of further recovery or is referred back to a physician. In the one year period of this study, a total of 129 stroke survivors performed the visual, neuropsychological and on-road tests that make up the full assessment battery at CARA. Since the standardized version of the on-road test with established reliability and validity (12) is the major component of the short battery, only the 46 stroke survivors who performed the standardized road test were eligible for inclusion in this study. Seven of the 46 potential participants had a history of epilepsy, but 2 had had a fit in the last 6 months and were excluded in accordance with Belgian law (11). Five potential participants had aphasia, but one had severe receptive aphasia and was also excluded because of the need to comprehend the instructions and tasks of the tests in the pre-driving assessment. In all, 39 men and 4 women (age 55 ± 12 years) were included in the study. All participants were independently ambulant with or without assistive devices, possessed valid drivers’ licenses and actively drove prior to stroke onset. Those with corrective glasses or lenses performed all tests of the pre-driving assessment using the appropriate corrections. Detailed descriptive characteristics of participants are presented in Table I.
| Table I. Descriptive characteristics of the 43 and 68 participants in the present and previous studies, respectively |
| Variables | Descriptive statistics |
| Present study n = 43 | Previous study n = 68 |
| Sex, n (%) Male Female | 39 (91) 4 (9) | 57 (84) 11 (16) |
| Age (years) Mean (SD) | 55 (12) | 53 (13) |
| Side of lesion, n (%) Left Right Bilateral | 22 (51) 19 (44) 2 (5) | 31 (45) 35 (52) 2 (3) |
| Type of stroke, n (%) Ischaemic Haemorrhagic | 22 (51) 21 (49) | 53 (78)* 15 (22) |
| Number of strokes, n (%) 1 2 3 | 29 (68) 10 (23) 4 (9) | 53 (78) 13 (19) 2 (3) |
| Time since onset of last stroke (month) Median (IQR) | 9 (7–20) | 9 (6–15) |
| Driving experience (years) Mean (SD) | 33 (11) | 33 (13) |
| Distance travelled (1000 km/year) Mean (SD) | 24 (27) | 24 (18) |
| Hemi or quadrant anopia, n (%) Yes No | 8 (19) 35 (81) | 14 (21) 54 (79) |
| History of epilepsy, n (%) Yes No | 5 (12) 38 (88) | 8 (12) 60 (88) |
| Aphasia, n (%) Yes No | 4 (9) 39 (91) | 19 (28)** 49 (72) |
| Binocular visual acuity, n (%) 20/20 20/25 20/30 | 25 (58) 12 (28) 6 (14) | 50 (74) 11 (16) 7 (10) |
| *p = 0.003 and **p < = 0.02 (χ2). IQR: interquartile range; SD: standard deviation |
Evaluation
Participants performed all 15 tests of the pre-driving assessment battery at CARA, which included the 3 tests of the short battery, as follows.
Figure of Rey (I). For the figure of Rey test (13), participants were presented with a sheet of paper that contained the diagram of a complex figure (the Rey-Osterrieth Complex Figure) and asked to reproduce (copy) the figure on another piece of paper. Accuracy, correctness and organization were judged based on a unit scoring system with a maximum score of 36 for a perfect reproduction.
Visual neglect (II). The test of visual neglect (14), a part of the Test for Attentional Performance (TAP) battery was administered using a computer-based program on a computer with a 17-inch screen. Participants were instructed to respond as quickly as possible by pressing a button whenever a flickering 3-digit integer was identified. The 3-digit integer was always embedded within several other numeric stimuli during its appearance, in order to complicate the task. It appeared 44 times with a random time delay and in different random locations within the central visual field on the computer screen. Each appearance of the 3-digit integer lasted 3 seconds, during which, if no response was elicited, the stimulus was judged as unseen. This was usually the case when visual neglect was present, i.e. attention was paid predominantly to the ipsilesional visual field and the flickering 3-digit integer was missed. The mean reaction time in 10 millisec resolution and the number of omissions to the left or right sides (lateralized mean reaction time) of the screen were recorded.
On-road test (III). On-road ability was evaluated using the standardized 17 km road test (12) and performed in an adapted automatic transmission car provided by CARA. Participants’ performances were scored during and completed immediately after the road test using a 13-item checklist of driving performance. The items contained 49 sub-items that were each scored using clearly pre-defined criteria on a 4-point scale of poor = 1, fair = 2, sufficient = 3 and good = 4. Possible score in the on-road test ranged between 49 (minimum) and 196 (maximum).
Other tests of the pre-driving assessment. The tests of left (IV) and right (V) monocular as well as binocular (VI) visual acuities and kinetic vision (VII) made up the visual tests. All visual tests were performed and judged as described in a previous study (15) using the Ergovision equipment. The useful Field of View (UFOV) (VIII) is defined as the spatial area that is required to respond to visual stimuli without eye or head movement (16). The UFOV test was administered to each participant using the Visual Attention Analyzer, model 2000. The test procedure and scoring are as described in previous studies (10, 16). Participants also performed the computer-based tests of divided attention (IX), visual scanning (X), incompatibility (XI) and visual field (XII) that are also from the TAP battery (14, 15). Finally, the dot cancellation test (XIII) (3), adapted versions of square matrix (XIV) and road sign recognition (XV) tests (7, 14), which are component tests of Stroke Driver Screening Assesment (SDSA) were administered to all participants. Adaptations to the original SDSA (UK based) were necessary in view of the right-hand traffic system in Belgium. The validity and predictive accuracy of the adapted version used in this study have been established (8).
Decision about fitness-to-drive
Based on overall performance in the entire 15 tests of the pre-driving assessment, the team of assessors (neurologist, occupational therapist and neuropsychologist) decided if a participant was (I) “fit-to-drive” (II) “temporarily unfit-to-drive”, or (III) “unfit-to-drive”. Only those judged “fit-to-drive” could resume driving and were further classified as “pass”, while the others (“temporarily unfit-to-drive” and “unfit-to-drive”) were classified as “fail”. Participants’ fitness-to-drive (pass/fail) based only on performances in the tests of the short battery were also predicted by an independent person using the discriminant equation from a previous study (10).
Ethics
All study protocols were approved by the institutional review board of the Katholieke Universiteit Leuven and the ethics committee of the Belgian Road Safety Institute, Brussels, Belgium.
Data analysis
Descriptive statistics were used to describe participants’ medical and general characteristics. Since the inclusion criteria in this study are the same as in the previous study, a comparison between the population in this study and the previous one was made (Table I). The discriminant equation from the previous study in which the short battery was first identified (10) was directly applied to participants’ scores in the same tests in this study to predict the fitness-to-drive (pass/fail) of participants. To validate the predictive accuracy of the short battery, the predicted pass/fail was compared with the actual pass/fail performances of the participants. The scores of participants who were predicted as “pass” were compared with those who failed using Wilcoxon rank-sum tests to further explore the difference between both groups. A p-value of 0.05 or less was considered significant. All statistical procedures were performed with the SAS system (17).
Results
With the exceptions of number of ischaemic vs haemorrhagic strokes (Table I) and presence of moderate or mild aphasia, the population of stroke survivors in this study is similar to the population in the previous study (10). Based on performance in all 15 tests of the pre-driving assessment 26 participants passed (“fit-to-drive”) and 17 failed (“temporarily unfit to drive” + “unfit-to-drive”) the pre-driving assessment. To predict the pass or fail outcome of participants’ performance, the discriminant equation from the previous study (10) based on the 3 tests of the short battery was applied.
Pass = (figure of Rey*8.74 + visual neglect (lateralized mean reaction time)*0.06 + road test score*0.14) – 174.90
Fail = (figure of Rey*8.51 + visual neglect (lateralized mean reaction time)*0.07 + road test score*0.08) – 162.66
When the Pass score of a subject is higher than the Fail score, the subject is predicted to pass and vice versa. As seen in Table II, 37 (86%, i.e (a+d/a+b+c+d)*100) of the 43 participants were correctly predicted to either pass or fail the predriving assessment.
| Table II. Comparisons of participants’ predicted performances based on the discriminant equation vs actual performances |
| Predicted pass/fail | Participants’ actual pass/fail performance |
| Fail, n (%) | Pass, n (%) |
| Fail, n (%) | a = 13 (30) | b = 2 (5) |
| Pass, n (%) | c = 4 (9) | d = 24 (56) |
The sensitivity (a/a+c)*100) was 77%. The specificity of the prediction (d/b+d)*100) was 92%. Any participant predicted to fail based on performance in the 3 tests (positive predictive accuracy = (a/a+b)*100) had an 87% chance of actually failing, while anyone predicted to pass (negative predictive accuracy = (d/c+d)*100) had an 86% chance of actually passing.
Participants who were predicted as “pass” performed significantly better than those who failed in all 3 tests of the short battery (Table III). In the figure of Rey test, the median scores of participants predicted as “pass” (34) and “fail” (32) were not much different, but the 75th percentile score of those predicted as “fail” (33) was lower than the 25th percentile score of those predicted as “pass”.
| Table III. Performances in the 3 tests of the short battery of participants predicted as “pass” compared with those predicted as “fail” |
| Variable | Median (Q1–Q3) | Test-statistic | p-value |
| Pass n = 28 | Fail n = 15 |
| Figure of Rey | 34 (34–35) | 32 (28–33) | w = 3.06 | 0.0011 |
| Visual neglect (lateralized mean reaction time) | 386 (332–437) | 462 (378–505) | w = –2.13 | 0.016 |
| On-road test | 196 (196–196) | 127 (110–156) | w = 5.85 | < 0.0001 |
| Q1 = 25th percentile, Q3 = 75th percentile, w = Wilcoxon rank-sum test. |
The median scores in the test of visual neglect (lateralized mean reaction time) showed that a higher value corresponded with a fail outcome and vice versa. In the on-road test, the same scores showed a flawless performance by participants predicted as “pass” (196).
Discussion
The predictive accuracy (86%) of the short battery of 3 tests in this study remains impressive, as in the previous study (10). The specificity (92%) of its prediction was again better than the sensitivity, an indication that the short battery is more accurate in identifying participants who will pass the pre-driving assessment. Further analysis revealed that the 4 participants who were predicted to pass but failed did not perform significantly better in the 3 tests of the short battery than the participants who were correctly predicted to fail. This implies that stroke survivors whose performances are borderline in the 3 tests, but who are predicted to pass, need additional tests before a final decision can be made about their driving fitness. However, all participants who scored ≥ 34 in the figure of Rey test, ≤ 386 in the test of visual neglect and 196 in the on-road test were predicted and actually found fit-to-drive.
The inclusion of tests in the short battery was based on a meticulous process in which determinants of driving after stroke were first identified in a retrospective study (15). The most important determinant (on-road test) was then standardized and its reliability and validity established (12). The short battery was eventually identified in a prospective study from a redefined assessment battery that contained only predictive and road-related tests including the standardized on-road test (10). The figure of Rey test is a widely used neuropsychological test. In this study, as in the previous ones (10, 15), the test (copy subtest) was used to assess participants’ visuospatial abilities, attention, organization and problem-solving skills, all of which have been identified as vital for driving, especially after stroke (4, 15). Visual neglect is an important predictor of driving after stroke (4, 10, 18, 19). Delayed reaction time is also a problem commonly associated with stroke, especially when attempting to resume driving, which involves time-dependent activities (5, 18, 19). It is thus logical that a test that assessed visual neglect with a reaction time component is included in the short battery. In 37 states in the USA (20) and in other countries, minimum visual field standards must be met in order to qualify for a driver’s license (11, 21). The on-road test is the commonly used single criterion of fitness-to-drive (4–8). Though its reliability and validity remains a controversial issue (22), it is still the closest approximation to real life driving. In this study, no participant in the road test who scored lower than the observed minimum score (128) in the previous study (10) was predicted to pass or actually passed the pre-driving assessment. This finding suggests that 128 is perhaps the cut-off point in the standardized on-road test for a chance to be found fit-to-drive after a stroke in Belgium.
Four (9%) of the participants in this study scored less than the median values required to pass in the tests of figure of Rey and visual neglect, but scored between 150 and 196 in the on-road test and were found fit-to-drive. This finding shows that some stroke survivors are capable of compensating effectively for their off-road deficits during on-road driving and lends support to the recommendation of Patomella and colleagues (9) for the inclusion of both off- and on-road tests in determining fitness-to-drive after stroke. However, crash records of tested persons who have resumed driving need to be obtained after a period of time in order truly to validate fitness-to-drive decisions based on any battery of tests or road test.
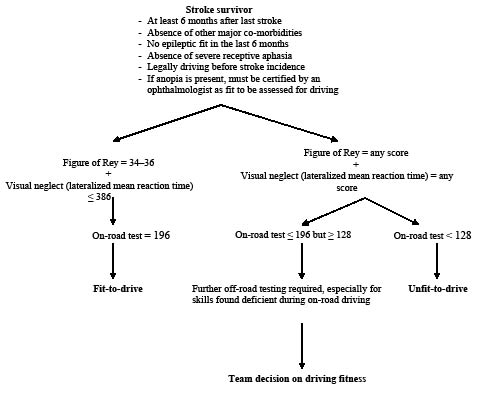
In general, the findings in the study are very similar to those of the previous study (10), which may be due largely to the similarity of the population of stroke survivors in both studies. The inclusion criteria for both studies were the same and predominantly based on Belgian laws (11), which led to a subgroup of stroke survivors who may not be representative of a general stroke population, as well as over-representation of survivors with haemorrhagic stroke in this study. These represent major limitations of this study, yet the accuracy of the short battery in predicting fitness-to-drive in the subgroup of stroke survivors is impressive. Based on our findings, we present an algorithm (Fig. 1) that can serve as a guide to neurologists, occupational therapists and neuropsychologists in Belgium in making decisions about fitness-to-drive after stroke.
Fig. 1. Proposed algorithm for deciding fitness-to-drive after stroke in Belgium.
In view of increases in survival rate after stroke globally (1) and in numbers of stroke survivors who wish to resume driving (3), professionals in other countries responsible for determining the driving fitness of stroke survivors may also find the proposed algorithm beneficial. However, due to the limited number of participants in this study (which is a further restriction) and the use of only 3 tests, the direct application of the scores given in the algorithm should be applied with caution. We suggest that where there is doubt in making a decision based on performances in the 3 tests alone, more tests can be administered to make a better judgement. Further research is, however, required into whether the short battery will be as predictive in other subgroups of stroke survivors, as well as in other neurological conditions, such as Parkinson’s disease, multiple sclerosis and Alzheimer’s disease.
Acknowledgements
We acknowledge the contributions of the staff of CARA, Belgium and the editorial contributions of Dr M. Cortez-Cooper.
References
1. Sarti C, Rastenyte D, Cepaitis Z, Tuomilehto J. International trends in mortality from stroke, 1968 to 1994. Stroke 2000; 31: 1588–1601.
2. Devroey D, Van Cateren V, Buntinx F. Registration of stroke through the Belgian sentinel network and factors influencing stroke mortality. Cerebrovasc Dis 2003; 16: 272–279.
3. Logan PA, Dyas J, Gladman JRF. Using an interview study of transport use by people who have had a stroke to inform rehabilitation. Clin Rehabil 2004; 18: 703–708.
4. Nouri FM, Lincoln NB. Validation of a cognitive assessment: predicting driving performance after stroke. Clin Rehabil 1992; 6: 275–281.
5. Heikkila VM, Korpelainen J, Turkka J, Kallanranta T, Summala H. Clinical evaluation of the driving ability in stroke patients. Acta Neurol Scand 1999; 99: 349–355.
6. Korner-Bitensky N, Mazer BL, Sofer S, Glinas I, Meyer MB, Morrison C, et al. Visual testing for readiness to drive after stroke. Am J Phys Med Rehabil 2000; 79: 253–259.
7. Myers RS, Ball KK, Kalina TD, Roth DL, Goode KT. Relation of useful field of view and other screening test to on-road driving performance. Percept Mot Skills 2000; 97: 279–290.
8. Lundberg C, Caneman G, Samuelsson S, Hakamies-Blomqvist L, Almkvist O. The assessment of fitness to drive after a stroke: the Nordic Stroke Driver Screening Assessment. Scand J Psych 2003; 44: 23–30.
9. Patomella A, Tham K, Kottorp A. P-Drive: Assessment of driving performance after stroke. J Rehabil Med 2006; 38: 273–279.
10. Akinwuntan AE, Feys H, De Weerdt W, Baten G, Arno P, Kiekens C. Prediction of driving after stroke: a prospective study. Neurorehabil Neural Repair 2006; 20: 417–423.
11. Van Den Meerschaut C. Rijgeschiktheid. Belgium: Semper October 1998; 226: 1–35.
12. Akinwuntan AE, De Weerdt W, Feys H, Baten G, Arno P, Kiekens C. The validity of a road test after stroke. Arch Phys Med Rehabil 2005; 86: 421–426.
13. Spreen O, Strauss E, editors. A compendium of neuropsychological tests. 2nd edn. New York, NY: Oxford University Press; 1998, p. 341–363.
14. Zimmermann P, Fimm B. A test battery for attentional performance. In: Leclercq M & Zimmermann P, editors. Applied neuropsychology of attention theory, diagnosis and rehabilitation. New York: Psychology Press 2002, p. 110–151.
15. Akinwuntan AE, Feys H, De Weerdt W, Pauwels J, Baten G, Strypstein E. Determinants of driving after stroke. A retrospective study. Arch Phys Med Rehabil 2002; 83: 334–341.
16. Ball KB, Roenker DL, Bruni JR. Developmental changes in attentional and visual search through adulthood. In: Enns J. editor. The development of attention: research and theory. North Holland: Elsevier Science Publishers; 1990, p. 489–508.
17. Freund RJ, Litell RC, editors. SAS system for regression, 2nd edn. Cary, NC: SAS Institute; 1991.
18. Quigley FL, DeLisa JA. Assessing the driving potentials of cerebral vascular accident patients. Am J Occup Ther 1983; 37: 474–478.
19. Lundqvist A, Gerdle B, Rönnberg J. Neuropsychological aspects of driving after stroke – in the simulator and on the road. Appl Cognit Psychol 2000; 14: 135–150.
20. American Medical Association State licensing requirements and reporting law. Available from: http://www.ama-assn.org/ama1/pub/upload/mm/433/chapter8.pdf (accessed 01/08/2005).
21. Taylor J. Vision and driving. Ophthal Physl Opt 1987; 7: 187–189.
22. Fox G, Bowden S, Smith D. On-road assessment of driving competence after brain impairment: review of current practice and recommendations for a standardized examination. Arch Phys Med Rehabil 1998; 79: 1288–1296.