IMPACT OF AGE AND CO-MORBIDITY ON THE FUNCTIONING OF PATIENTS WITH SEQUELAE OF POLIOMYELITIS: A CROSS-SECTIONAL STUDY
Janneke M. Stolwijk-Swüste1, MD Anita Beelen1,2, PhD Gustaaf J. Lankhorst1, MD, PhD and Frans Nollet1,2, MD, PhD, on behalf of the CARPA study group
From the 1Department of Rehabilitation Medicine, VU University Medical Center, and 2Department of Rehabilitation, Academic Medical Center, University of Amsterdam, Amsterdam, The Netherlands
OBJECTIVE: To investigate the impact of age and co-morbidity on the functional independence and perceived physical functioning of patients with sequelae of poliomyelitis.
DESIGN: Cross-sectional study.
SUBJECTS: A convenience sample of 168 patients with sequelae of poliomyelitis, aged 45–85 years, recruited from 2 university hospitals.
METHODS: Outcome measures were Functional Independence Measure (FIMTM) for functional independence, Short Form-36 (SF-36) for physical functioning and general mental health, Cumulative Illness Rating Scale (CIRS) for co-morbidity.
RESULTS: FIMTM scores were significantly lower for the 65–85 year age group than for the 45–54 year age group. No differences in the SF-36 were found between the age groups, except that the SF-36 general mental health sub-scale score was significantly better in the 65–85 year age group than in the 45–54 year age group. The CIRS score increased significantly with age. Linear regression showed that age, gender, polio severity, and 4 co-morbidity scores (‘‘cardiac’’, ‘‘vascular’’, ‘‘endocrine, metabolic’’ and ‘‘muscle, bone, skin’’) were significantly and inversely associated with functional independence and physical functioning.
CONCLUSION: The level of functional independence of elderly former poliomyelitis patients is lower than that of younger patients. Specific attention should be paid to co-morbidity and ageing in this increasingly older population of polio survivors, since they negatively affect functional independence and perceived functioning.
Key words: post-poliomyelitis syndrome, rehabilitation, co-morbidity.
J Rehabil Med 2007; 39: 56–62
Correspondence address: Janneke Stolwijk-Swüste, Department of Rehabilitation Medicine, VU University Medical Center, PO Box 7057, NL-1007 MB Amsterdam, The Netherlands. E-mail: jm.stolwijk@vumc.nl
Submitted February 15, 2006; accepted May 10, 2006
INTRODUCTION
Poliomyelitis is a viral infection of the motor neurons in the spinal cord, resulting in an acute flaccid paresis of a varying number of muscle groups (1). Nowadays, the incidence of acute poliomyelitis in the western world is low, but many individuals with a history of poliomyelitis report late-onset neuromuscular symptoms and a decline in functional abilities. These late symptoms are referred to as the post-poliomyelitis syndrome, and include a gradual or sudden onset of progressive and persistent new muscle weakness or abnormal muscle fatigability (decreased endurance), with or without generalized fatigue, muscle atrophy, or muscle and joint pain (2). The new symptoms cause increasing difficulties with physical functioning, such as walking, standing, climbing stairs and other mobility-related activities of daily life (3, 4).
Few cross-sectional and prognostic studies have focused on functional independence and physical functioning in subjects with sequelae of poliomyelitis (5–10). In those that have, the recruitment of subjects differed from a random selection from the population to a selection of patients referred to a specialized post-poliomyelitis clinic. Furthermore, different outcome measures were used, and the follow-up periods ranged from 2 to 15 years. The results were inconsistent, sometimes even between different outcome measures in the same study (11) and ranged from deterioration (5–7, 9, 10) to no change (7–9) and to improvement in functioning (7, 8). One study, with a 15-year follow-up period, a randomly selected population with and without post-poliomyelitis and good methodological quality, reported a modest, but significant, decline in the performance of a 100-foot walking test and a decline in upper limb functioning (10).
Measuring co-morbidity is acknowledged to be increasingly important in research, because it has been demonstrated that co-existing morbidities are associated with quality of life (12) and activities of daily living (13, 14). However, few studies have yet investigated co-morbidity in patients with sequelae of poliomyelitis (15–19). Nielsen et al. (15) reported that people with a history of poliomyelitis have a slightly increased morbidity rate compared with age-matched controls, and have a 1.2- to 1.3-fold increased risk of being hospitalized with pulmonary, heart, gastrointestinal tract and locomotor apparatus diseases. Nielsen et al. (16–18) also reported an increased risk of Parkinson’s disease, multiple sclerosis and female breast cancer. Gawne et al. (19) focussed on risk factors, and reported that the post-poliomyelitis population carries a high prevalence of 2 or more coronary heart disease risk factors, partly because of their sedentary lifestyle, controversy about the safety of exercise, and their age.
Some studies which focussed on functional independence and physical functioning in patients with sequelae of poliomyelitis excluded subjects with co-morbidity (7), did not include elderly patients (above the age of 65 years) (7, 20, 21), or did not assess or report the extent and nature of the co-morbidities or their influence on functioning (5, 6, 8–10). These differences in eligibility criteria limit the generalizability (or external validity) and may result in an underestimation of the functional problems and rate of decline in former polio patients. Therefore, the present study focuses on patients in a broad age-range, without excluding co-morbidity.
The objectives of this study were (i) to evaluate functional independence and perceived functioning, specifically physical functioning, and (ii) to explore the impact of age and co-morbidity on functional independence and perceived physical functioning in patients aged 45–85 years with sequelae of poliomyelitis.
METHODS
Study population
The patients were recruited from two university hospitals that specialize in the treatment of sequelae of poliomyelitis. To compare outcome measures according to age, the aim was to assemble 3 equally large age groups: 45–54 years, 55–64 years and 65–85 years with 60 subjects in each group. The inclusion criteria were: (i) history of poliomyelitis anterior acuta; (ii) presence of residual paresis in at least one extremity; (iii) consultation (not necessarily the first consultation) of a neurologist or physical medicine and rehabilitation specialist in the previous 5 years; (iv) age 45–85 years; (v) no medical condition indicating a life expectancy of less than one year. All patients who fulfilled the inclusion criteria were invited to participate in the study. All patients who volunteered to participate gave their informed consent.
A total of 258 subjects were invited to participate in the study by means of a letter that was sent to their last known address. Eighteen letters were returned because of an incorrect address. In all, 175 subjects (77%) volunteered to participate, 75% in the 45–54 year age group, 72% in the 55–64 year age group and 72% in the 65–85 year age group. Two subjects were excluded, one because of language problems (45–54 year age group) and one because the diagnosis of poliomyelitis anterior acuta was not confirmed (55–64 year age group). Five other subjects were not included in the study because there were already enough subjects in their age group by the time they volunteered to participate (3 in the 45–54 year age group, 2 in the 55–64 year age group). The reasons for non-participation were not known for all the patients, as the medical ethics committee did not allow to assess these reasons. Ten patients in the 65–85 year age group voluntarily responded that they were unable to participate because of poor health.
Measurement instruments
Functional Independence Measure. The FIMTM is a generic tool, which can be used to measure functional independence in functioning in patients undergoing rehabilitation (22). The FIMTM consists of 18 activities, each scored on a 7-point scale, with a score of 1 indicating total assistance and 7 indicating complete independence. A total score, ranging from 18 to 126, is calculated by summing up all the 18 activities. The FIM motor score is calculated by summing up 11 activities, the FIM bowel/bladder score by summing up 2 activities and the FIM cognitive score by summing up 5 activities. The FIMTM has been found to have good validity and reproducibility (23).
Short Form-36. The Short Form-36 (SF-36) is a self-administered questionnaire measuring generic health concepts, composed of 36 questions and standardized response choices, grouped into 9 multi-item scales: physical functioning, role limitations due to physical functioning, bodily pain, general health perceptions, vitality, social functioning, role limitations due to emotional functioning, general mental health and change in health (24). The SF-36 physical functioning sub-scale consists of 10 questions on a 3-point scale. A sub-scale score is calculated by adding the raw item scores, minus the lowest possible raw score and dividing this by the possible raw score range. Each scale is scored from 0 to 100, with higher scores indicating higher levels of functioning or well-being. The SF-36 has been translated and validated for the population of the Netherlands (25).
Muscle strength. Residual paresis in patients with sequelae of poliomyelitis varies from local paresis in one extremity to extensive paresis involving all four extremities, trunk and bulbar muscles. To quantify the degree of residual impairment of poliomyelitis, muscle strength of all extremities was measured manually (manual muscle testing, MMT) according to the Medical Research Council scale (26), with each muscle group receiving a score ranging from 0 to 5. The following muscle groups were measured: shoulder abductors, elbow flexors, elbow extensors, wrist dorsal flexors, wrist palmar flexors, hip flexors, hip extensors, hip abductors, hip adductors, knee flexors, knee extensors, ankle dorsal flexors and ankle plantar flexors. A legs strength score was obtained by adding the MMT-scores of all 16 leg muscle groups tested (range 0–80) and an arms strength score was obtained by adding the MMT-scores of all 10 arm muscle groups tested (range 0–50) (7).
Cumulative Illness Rating Scale. The Cumulative Illness Rating Scale (CIRS) is a short, physician-rated, comprehensive and reliable instrument for assessing the burden of chronic medical illness (27). The scale consists of 13 relatively independent categories grouped under body systems. Ratings are made on a 5-point ‘‘degree of severity’’ scale, ranging from ‘‘none’’ to ‘‘extremely severe’’. Only co-morbidity is rated in this scale, and not the index disease in question, i.e. poliomyelitis and resulting orthopaedic interventions (e.g. ankle arthrodesis) in early childhood. The total score is calculated by summing up the category scores. The CIRS has been found to have good validity (28) and good inter-rater and test-retest reliability (27, 29, 30).
Assessment protocol
Prior to the visit to the hospital, the patients received a questionnaire with instructions, which they returned during their visit to the hospital. At the hospital a physician interviewed the patients and administered the tests in a standard sequence.
Data analysis
Demographic data were analysed by using descriptive statistics. The outcome measures were compared according to age group by applying one-way analysis of variance (ANOVA) with a post hoc Bonferroni test. Associations between the variables of interest and the outcome measures (FIMTM total score and SF-36 physical functioning) were assessed with multivariate linear regression analysis. A forward stepwise selection method, with a p-value of less than 0.05, was used as the selection criterion, with a probability of F-to-enter <0.10. The statistical analysis was performed in SPSS, version 12.0.1, statistical software package. An α level of 0.05 was used for all tests of significance.
RESULTS
A total of 168 patients (101 women, 67 men) were included in 3 age groups: 45–54 years (n = 60), 55–64 years (n = 60) and 65–85 years (n = 48). Their age at the acute polio stage varied from newborn to 27 years, with a median value of 3.0. There was no difference between the age groups in the number of affected body sites during acute polio infection or the number of affected body sites with residual paresis. The mean duration of new neuromuscular symptoms was 12.59 ± 8.9 years. General fatigue was reported more frequently by the 45–54 year age group compared with the older age groups (p < 0.01) (Table I).
| Table I. Subject characteristics | ||||
| Age groups | ||||
| Characteristics | 45–54 years | 55–64 years | 65–85 years | Total |
| n | 60 | 60 | 48 | 168 |
| Age, mean (SD) (range) (years) | 50.8 (2.5) (45–54) | 59.6 (2.5) (55–64) | 69.1 (4.3) (65 –81) | 59.1 (7.9) |
| Gender (M/F), | 25/35 | 25/35 | 17/31 | 67/101 |
| Age at acute polio median (range) (years) | 2.5 (0–17) | 2.0 (0 –27) | 4.0 (0–21) | 3.0 (0 –27) |
| Body sites with residual paresis#, median (IQ 25-27%) | 1 (0;2) | 2 (1;2) | 1.5 (0.5;2.5) | 1.5 (0.5;2.5) |
| New symptoms (yes/no) | 59/1 | 57/3 | 46/2 | 162/6 |
| Mean duration of new symptoms (years) (SD) | 11.5 (7.2) | 12.0 (9.2) | 14.4 (10.4) | 12.5 (8.9) |
| New muscle weakness (yes/no) | 48/12 | 51/9 | 39/9 | 138/30 |
| New muscle pain (yes/no) | 32/28 | 35/25 | 24/24 | 91/77 |
| New muscle fatigue (yes/no) | 42/18 | 40/20 | 32/16 | 114/54 |
| New muscle atrophy (yes/no) | 21/39 | 18/42 | 14/34 | 53/115 |
| General fatigue (yes/no) | 59/1** | 48/12* | 40/8* | 147/21 |
| *p < 0.01 (χ2) compared with 45–54 year age group, ** p < 0.01 (χ2) compared with 55–64 year and 65–85 year age group, # range 0–8 (4 extremities, trunk, neck, face, throat). | ||||
FIMTM
The 65–85 year age group scored significantly lower than the 45–54 year age group on the total FIMTM score (p = 0.0015), the FIM motor score (p = 0.033), and the FIM bowel/bladder (p = 0.033), i.e. the oldest age group was more functionally dependent in these areas than the youngest age group. The 45–54 year age group and the 55–64 year age group did not differ in any of the scores for functional independence. There was no difference between any of the age groups in the FIM cognitive score. It must be taken into account, however, that there was a profound ceiling effect on the FIM bowel/bladder score and the FIM cognitive score in this population (Table II).
| Table II. FIMTM total score, FIM motor score, FIM bowel/bladder score, FIM cognitive score and Manual Muscle testing (MMT) | ||||
| Age groups | ||||
| Outcome measure | 45–54 years | 55–64 years | 65–85 years | Total |
| FIMTM total score (range 18–126) | 122.5 (121.0–124.0) | 122.0 (119.0–124.0) | 121.0 (118.3–123.0)* | 122.0 (120.0–124.0) |
| FIM motor score (range 11–77) | 74.0 (72.0–75.0) | 73.5 (71.3–75.0) | 73 0 (70.0–74.0)* | 73.0 (71.0–75.0) |
| FIM bowel/bladder score (range 2–14) | 14.0 (14.0–14.0) | 14.0 (14.0–14.0) | 14.0 (13.0–14.0)* | 14.0 (14.0–14.0) |
| FIM cognitive score (range 5–35) | 35.0 (35.0–35.0) | 35.0 (35.0–35.0) | 35.0 (35.0–35.0) | 35.0 (35.0–35.0) |
| Manual muscle testing leg strength sum-score | 65.9 (49.1–71.2) | 68.5 (58.1–75.9) | 67.1 (54.2–74.6) | 61.7 ± 16.7 |
| Manual muscle testing arm strength sum-score | 50.0 (49.0–50.0) | 50.0 (45.6–50.0) | 50.0 (47.1–50.0) | 47.6 ± 4.1 |
| Values are median (25 and 75 percentile scores). *p < 0.05 compared with 45–54 year age group. Sum-scores for the muscle strength of the legs and arms were calculated by adding 16 and 10 muscle groups, respectively. Each muscle group had a score between 0 and 5, MMT leg strength sum score ranged from 0 to 80 and MMT arm strength sum-score ranged from 0 to 50. | ||||
SF-36
No significant differences were found between the age groups in any of the sub-scales except general mental health, i.e. the 65–85 year age group experienced a better general mental health compared with the 45–54 year age group (p = 0.021) (Table III).
| Table III. SF-36 sub-scales | ||||
| Age groups | ||||
| SF-36 sub-scale | 45–54 years | 55–64 years | 65–85 years | Total |
| Physical functioning | 40.8 (22.1) | 42.8 (25.3) | 35.4 (22.4) | 39.5 (23.5) |
| Role limitations due to physical functioning | 45.0 (41.9) | 50.4 (42.6) | 43.6 (41.5) | 46.6 (41.9) |
| Bodily pain | 55.5 (21.6) | 58.5 (22.3) | 54.8 (23.5) | 56.4 (22.2) |
| General health perception | 55.5 (20.1) | 57.4 (22.5) | 58.5 (17.4) | 57.0 (20.2) |
| Energy vitality | 50.8 (15.8) | 56.0 (18.7) | 55.1 (18.5) | 53.9 (17.7) |
| Social functioning | 64.6 (23.9) | 68.3 (25.7) | 73.2 (26.9) | 68.4 (25.5) |
| Role limitation due to emotional problems | 75.0 (38.6) | 79.4 (35.3) | 81.3 (35.7) | 78.4 (36.5) |
| Mental health | 70.0 (17.0) | 77.3 (15.0) | 78.8 (18.4*) | 75.1 (17.1) |
| Change in health | 43.8 (18.8) | 41.3 (18.3) | 40.1 (19.1) | 41.8 (18.7) |
| Values are mean (SD). *p < 0.05 compared with 45–54 year age group. | ||||
Muscle strength
The median value of the MMT leg strength sum score was 2.6 points higher in the 55–64 year age group compared with the 45–54 age group, and 1.4 points higher compared with the 65–85 year age group. The differences in the MMT leg strength sum-score between the age groups were not significant, but it must be noted that there was a large variability in the leg strength sum-score among participants in every age group (Table II). The MMT arm strength sum-scores had a much smaller range, and there was no significant difference between the age groups (Table II).
CIRS
The 65–85 year age group had a significantly higher CIRS total score compared with the younger age groups. The 55–64 year age group had a significantly higher CIRS total score, compared with the 45–54 year age group (Table IV). The body systems ‘‘ear, nose, throat, eye (including glasses and hearing aids)’’ and ‘‘muscle, bone, skin’’ were most frequently scored as positive (136 and 128 positive scores, respectively). The CIRS ‘‘cardiac’’ score consisted of 44% heart failure, 26% myocardial infarction, 18% cardiac arrhythmias and 12% valvular heart diseases. The CIRS vascular score consisted of 88% hypertension and 12% other diseases. The CIRS ‘‘endocrine, metabolic’’ score consisted of 37% hypercholesterolemia, 27% osteoporosis, 15% thyroid diseases, 12% diabetes mellitus and 10% other diseases. The CIRS ‘‘muscle, bone, skin’’ score consisted of 43% lower extremity problems, 23% upper extremity problems, 19% back problems, 6% skin-related problems, and others (9%).
| Table IV. CIRS category scores | ||||
| Age groups | ||||
| 45–54 years | 55–64 years | 65–85 years | Total | |
| CIRS category score | n = 60 | n = 60 | n = 48 | n =1 68 |
| CIRS total score | 4 (0–13) | 6 (0-14) | 8 (2–21)*^ | 6 (0–21) |
| Cardiac | 0 (0–2) | 0 (0–3) | 0 (0–3)* | 0 (0–3) |
| Vascular | 0 (0–2) | 0 (0–3) | 0 (0–3)*^ | 0 (0–3) |
| Respiratory | 0 (0–3) | 0 (0–3) | 0 (0–3) | 0 (0–3) |
| Eye, ear, nose, throat | 1 (0–2) | 1 (0–3) | 1 (0–3)*^ | 1 (0–3) |
| Upper GI | 0 (0–2) | 0 (0–3)* | 0 (0–3) | 0 (0–3) |
| Lower GI | 0 (0–2) | 0 (0–2) | 0 (0–2) | 0 (0–2) |
| Hepatic | 0 (0) | 0 (0–2) | 0 (0–3) | 0 (0–3) |
| Renal | 0 (0–3) | 0 (0–1) | 0 (0) | 0 (0–3) |
| Other urogenital | 0 (0–2) | 0 (0–2) | 0 (0–3)* | 0 (0–3) |
| Muscle, bone, skin | 2 (0–3) | 2 (0–3) | 2 (0–3) | 2 (0–3) |
| Neurological | 0 (0–2) | 0 (0–3) | 0 (0–3) | 0 (0–3) |
| Psychiatric | 0 (0–3) | 0 (0–3) | 0 (0–2) | 0 (0–3) |
| Endocrine, metabolic | 0 (0–2) | 0 (0–2) | 0 (0–3)*^ | 0 (0–3) |
| Values are median (range). *p < 0.05 compared with 45–54 year age group, ^p < 0.05 compared with 55–64 year age group. GI: gastrointestinal tract, CIRS: Cumulative Illness Rating Scale. | ||||
Impact of age and co-morbidity on functional independence and perceived physical functioning
Two multivariate linear regression models were constructed to investigate the impact of age and co-morbidity on the dependent variables FIMTM total score and SF-36 sub-scale physical functioning. The associated factors that were analysed were age, gender, leg strength sum-score, arm strength sum-score and CIRS category scores. Thirty-four percent of the variation in the FIMTM total score could be attributed to leg strength sum-score, CIRS ‘‘cardiac’’ score, arm strength sum-score, CIRS ‘‘muscle, bone, skin’’ score, age, gender and CIRS ‘‘vascular’’ score (Table V). The co-morbidity scores added 11.4% in explaining the variance in the FIMTM total score after the leg strength sum-score had been added to the model, and age added 3%. Forty-one percent of the variation in the SF-36 sub-scale physical functioning could be attributed to the presence of leg strength sum-score, CIRS ‘‘endocrine, metabolic’’ score, gender, CIRS ‘‘vascular’’ score, and CIRS ‘‘muscle, bone, skin’’ score (Table V). The co-morbidity scores added 9.2% in explaining the variance in SF-36 sub-scale physical functioning after the leg strength sum-score had been added to the model and when age was not included in the model.
| Table V. Multivariate linear regression model for FIMTM total score and SF-36 sub-scale physical functioning | |||
| Dependent variable | B (95% CI) | p | Adjusted R2 |
| FIMTM total score | |||
| Intercept | 113.3 (105.6 to 121.0) | 0.000 | |
| Leg strength sum-score | 0.11 (0.07 to 0.14) | 0.000 | 0.14 |
| CIRS ‘‘cardiac’’ score | –0.96 (–1.63 to –0.28) | 0.006 | 0.21 |
| Arm strength sum-score | 0.20 (0.08 to 0.33) | 0.002 | 0.26 |
| CIRS ‘‘muscle, bone, skin’’ score | –0.60 (–1.13 to –0.70) | 0.027 | 0.29 |
| Age | –0.77 (–0.15 to 0.00) | 0.042 | 0.31 |
| Gender | –1.32 (–2.44 to –0.19) | 0.022 | 0.32 |
| CIRS ‘‘vascular’’ score | –0.62 (–1.21 to –0.03) | 0.041 | 0.34 |
| SF–36 Physical Functioning | |||
| Intercept | 18.3 (4.3 to 32.3) | 0.000 | |
| Leg strength sum-score | 0.77 (0.60 to 0.93) | 0.000 | 0.27 |
| CIRS ‘‘endocrine, metabolic’’ score | –5.63 (–8.95 to –2.31) | 0.002 | 0.33 |
| Gender | –10.06 (–15.80 to –4.33) | 0.015 | 0.37 |
| CIRS ‘‘vascular’’ score | –3.80 (–6.68 to –0.91) | 0.078 | 0.39 |
| CIRS ‘‘muscle, bone, skin’’ score | –3.32 (–6.01 to 0.62) | 0.073 | 0.41 |
| Factors included in regression analysis were age (years), gender (male = 1/female = 2), leg strength sum-score, arm strength sum-score, CIRS categories. B: beta, regression coefficient; CIRS: Cumulative Illness Rating Scale. | |||
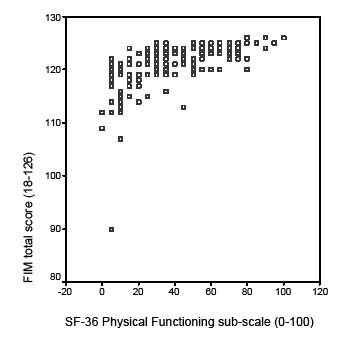
Fig. 1. FIMTM total score plotted against SF-36 sub-scale physical
functioning.
DISCUSSION
This study evaluated the level of functioning and the impact of age and co-morbidity on functioning in patients aged 45–85 years with sequelae of poliomyelitis. The study population was older than that of most earlier studies and co-morbidity was not excluded (5–8). However, sampling bias may have occurred, especially in the oldest group, i.e. 65–85 years of age, rendering the findings less generalizable. In line with the recent literature (4, 31), our population reported new physical complaints, with muscle weakness and fatigue being the most frequently reported symptoms. The youngest age group reported fatigue most frequently and this may be due to a more (physically) active lifestyle, because they are more involved in working and raising a family.
Functional independence, based on FIMTM total score, FIM motor score and FIM bowel/bladder score, was significantly lower in the 65–85 year age group compared with the 45–54 year age group. The difference in median value of the FIMTM total score between the youngest and the oldest age group was only 1.5 points, indicating only a small difference in functional independence. Farbu et al. (9) interviewed patients about daily functioning and reported a reduction in mobility daily functioning, but not in functions concerning personal care. Within the FIM motor score, the elderly group only scored significantly lower on the items ‘‘climbing stairs’’ and ‘‘transfer to bath/ shower’’, and therefore these findings confirm the results of the study carried out by Farbu et al. (9).
The SF-36 score for perceived physical functioning did not differ significantly between the age groups and perceived general mental health was even better in the older age group. Two explanations can be given for these findings. Elderly people probably experience less physical and mental stress as they are less (physically) active. Secondly, elderly patients might have adapted to their physical limitations and rate their current health status against the background of newly adapted standards. This phenomenon is called response shift, and refers to a change in the meaning of one’s self-evaluation of a target construct. Response shift is a result of a change in the respondent’s internal standards of measurement, a redefinition of the target construct or a change in the respondent’s values (the importance of component domains constituting the target construct) (32, 33).
Functional independence (FIMTM) was assessed by an investigator, whereas SF-36 physical functioning was measured with a self-administered questionnaire and is therefore a person’s perception of his or her own physical functioning. It appears that the subjective experience of physical functioning can vary widely between patients with the same high level of functional independence (FIMTM ≥ 120) (Fig. 1). Therefore functional independence and perceived physical functioning measure two different constructs.
In the past few years the importance of co-morbidity for functional prognosis in rehabilitation medicine is increasingly recognized (34–36). The present study focussed on the relation- ship of age and co-morbidity with functional independence and perceived physical functioning. Age was a factor that was significantly associated with functional independence, but not with perceived physical functioning. This corroborates an agerelated shift in the perception of physical limitations. In line with the expectation, the level of co-morbidity increased significantly with age. The body systems ‘‘cardiac’’, ‘‘vascular’’, ‘‘endocrine, metabolic’’ and ‘‘muscle, bone, skin’’ appeared to be significantly associated with both outcomes. Gawne et al. (19) advised screening for dyslipidaemia and providing education on controllable risk factors in former polio patients. This seems to be even more important because co-morbidity involving these body systems appears to be an important factor in explaining the functioning of these patients.
The three age groups appeared to have a similar level of polio impairments, because no significant differences were found in MMT. In the model explaining functional independence, both the leg and arm strength sum-score were significantly associated factors, whereas in the perceived physical functioning model only the leg strength sum-score was a significant factor. A possible explanation is that the FIMTM total score consists of 6 items involving the use of the arms, whereas the SF-36 physical mobility sub-scale consists of 10 items, with only 2 items specifically involving the use of the arms.
The female sex was a negative associated factor with both functional independence and perceived physical functioning. Women with sequelae of poliomyelitis are known to report a lower level of perceived physical functioning than men (7). In line with this finding it may be that women are more likely to report a lower level of functional independence.
In conclusion, the level of functional independence of elderly former poliomyelitis patients is lower than that of younger patients. Co-morbidity negatively affects the functional independence and perceived physical functioning. Prospective studies with unselected study populations, without the exclusion of co-morbidity or elderly patients, but including age-matched controls and measures to record co-morbidity are needed to investigate the influence of co-morbidity on the course of functioning in this population.
ACKNOWLEDGEMENTS
We thank all those who participated in the study for their time and efforts. The study was supported by a grant from ZonMw, The Netherlands.
Participants in the CARPA study group: JM Stolwijk-Swüste, A Beelen, F Nollet, GJ Lankhorst, J Dekker, GM van Dijk, C Veenhof, B Post, R de Haan, H Speelman.
REFERENCES
1. Morens DA, Pallansch MA, Moore M. Polioviruses and other enteroviruses. In: Belshe RB, ed. Textbook of Human Virology. London: Mosby; 1990, p. 427–497.
2. March of Dimes Foundation. Post-polio syndrome: identifying best practices in diagnosis & care. White Plains, NY: March of Dime; 2001.
3. Ivanyi B, Nollet F, Redekop WK, de Haan R, Wohlgemuht M, van Wijngaarden JK, et al. Late onset polio sequelae: disabilities and handicaps in a population-based cohort of the 1956 poliomyelitis outbreak in the Netherlands. Arch Phys Med Rehabil 1999; 80: 687–690.
4. Nollet F, Beelen A, Prins MH, de Visser M, Sargeant J, Lankhorst GJ, et al. Disability and functional assessement in former polio patients with and without poliomyelitis syndrome. Arch Phys Med Rehabil 1999; 80: 136–143.
5. Grimby G, Thoren Jonsson AL. Disability in poliomyelitis sequelae. Phys Ther 1994; 74: 15–24.
6. Stanghelle JK, Festvag LV. Postpolio syndrome: a 5 year follow-up. Spinal Cord 1997; 35: 503–508.
7. Nollet F, Beelen A, Twisk JW, Lankhorst GJ, de Visser M. Perceived health and physical functioning in postpoliomyelitis syndrome: a six-year prospective follow-up study. Arch Phys Med Rehabil 2003; 84: 1048–1056.
8. Windebank AJ, Litchy WJ, Daube JR, Iverson RA. Lack of progression of neurological deficit in survivors of paralytic polio: a 5-year prospective population-based study. Neurology 1996; 46: 80–84.
9. Farbu E, Rekand T, Gilhus NE. Post-polio syndrome and total health status in a prospective hospital study. Eur J Neurol 2003; 10: 407–413.
10. Sorenson EJ, Daube JR, Windebank AJ. A 15-year follow-up of neuromuscular function in patients with prior poliomyelitis. Neurology 2005; 64: 1070–1072.
11. Stolwijk-Swuste JM, Beelen A, Lankhorst GJ, Nollet F. The course of functional status and muscle strength in patients with late onset sequelae of poliomyelitis: a systematic review. Arch Phys Med Rehabil 2005; 86: 1693–1701.
12. Xuan J, Kirchdoerfer LJ, Boyer JG, Norwood GJ. Effects of comorbidity on health-related quality of life scores: an analysis of clinical trial data. Clin Ther 1999; 21: 383–403.
13. Fried LP, Bandeen-Roche K, Kasper JD, Guralnik JM. Association of co-morbidity with disability in older women: the Women’s Health and Ageing study. J Clin Epidemiol 1999; 52: 27–37.
14. Byles JE, D’Este C, Parkinson L, O’Connel R, Treloar C. Single index of multimorbidity did not predict multiple outcomes. J Clin Epidemiol 2005; 58: 997–1005.
15. Nielsen NM, Rostgaard K, Askgaard D, Skinhoj P, Aaby P. Lifelong morbidity among Danes with poliomyelitis. Arch Phys Med Rehabil 2004; 85: 385–391.
16. Nielsen NM, Rostgaard K, Hjalgrim H, Askgaard DS, Aaby P. Parkinson’s disease and poliomyelitis. JAMA 2002; 287: 1650–1651.
17. Nielsen NM, Wohlfahrt J, Melbye M, Rasmussen S, Molbak K, Askgaard DS, et al. Multiple sclerosis and poliomyelitis. A Danish historical cohort study. Acta Neurol Scand 2000; 101: 384–387.
18. Nielsen NM, Wohlfahrt J, Aaby P, Hjalgrim H, Pedersen CB, Askgaard DS, et al. Cancer risk in a cohort of polio patients. Int J Cancer 2001; 92: 605–608.
19. Gawne AC, Wells KR, Wilson KS. Cardiac risk factors in polio survivors. Arch Phys Med Rehabil 2003; 84: 694–696.
20. Agre JC, Rodriquez AA. Neuromuscular function in polio survivors at one-year follow-up. Arch Phys Med Rehabil 1991; 72: 7–10.
21. Agre JC, Grimby G, Rodriquez AA, Einarsson G, Swiggum ER, Franke TM. A comparison of symptoms between Swedish and American post-polio individuals and assessment of lower limb strength a four year cohort study. Scand J Rehabil Med 1995; 27: 138–192.
22. Keith RA, Granger CV, Hamilton BB, Sherwin FS. The functional independence measure: a new tool in rehabilitation. Adv Clin Rehab 1987; 1: 6–18.
23. Kidd D, Stewart G, Baldry J, Johnson J, Rossiter D, Petruckevitch A, et al. The functional independence measure: a comparative validity and reliability study (see comments). Disabil Rehabil 1995; 17: 10–14.
24. McHorney CA, Ware JE, Raczek AE. The Moss 36-item Short Form Health Survey (SF-36): II. Psychometric and clinical tests of validity in measuring physical and mental health constructs. Med Care 1993; 31: 247–263.
25. Aaronson NK, Muller M, Cohen PDA, Essink-Bot ML, Fekkes M, Sanderman R, et al. Translation, validation, and norming of the Dutch language version of the SF-36 Health Survey in community and chronic disease populations. J Clin Epidemiol 1998; 51: 1055–1068.
26. Medical Research Council. Aids to the examination of the peripheral nervous system. London: Her Majesty’s Stationery Office; 1976.
27. Linn BS, Linn MW, Gurel L. Cumulative illness rating scale. J Am Geriat Soc 1968; 16: 622–626.
28. Conwell Y, Forbes NT, Cox C, Caine ED. Validation of a measure of physical illness burden at autopsy: the Cumulative Illness Rating Scale. J Am Geriat Soc 1993; 41: 38–41.
29. Rochon PA, Katz JN, Morrow LA, McGlinchey-Berroth R, Ahlquist MM, Sarkarati M, et al. Comorbid illness is associated with survival and length of hospital stay in patients with chronic disability. A prospective comparison of three comorbidity indices. Med Care 1996; 34: 1093–1101.
30. Extermann M, Overcash J, Lyman GH, Parr J, Balducci L. Comorbidity and functional status are independent in older cancer patients. J Clin Oncol 1998; 16: 1582–1587.
31. Thoren-Jonsson AL, Hedberg M, Grimby G. Distress in everyday life in people with poliomyelitis sequelae. J Rehabil Med 2001; 33: 119–127.
32. Schwartz CE, Sprangers MA. Methodological approaches for assessing response shift in longitudinal health-related quality-of-life research. Soc Sci Med 1999; 48: 1531–1548.
33. Sprangers MA, Schwartz CE. Integrating response shift into healthrelated quality of life research: a theoretical model. Soc Sci Med 1999; 48: 1507–1515.
34. Di Libero F, Fargnoli M, Pittiglio S, Mascio M, Giaquinto S. Comorbidity and rehabilitation. Arch Gerontol Geriatr 2001; 32: 15–22.
35. Giaquinto S, Palma E, Maiolo I, Piro MT, Roncacci S, Sciarra A, Vittoria E. Importance and evaluation of co-morbidity in rehabilitation. Disabil Rehabil 2001; 23: 296–299.
36. de Groot V, Beckerman H, Lankhorst GJ, Bouter LM. How to measure comorbidity: a critical review of available methods. J Clin Epidemiol 2003; 56: 221–229.

