
From the 1Division of Neurology and Neurorehabilitation– IRCCS Istituto Auxologico Italiano, Verbania, Italy, 2Department of Electronics, Information and Bioengineering, Politecnico di Milano, Milan, Italy, 3Department of Neurosciences “Rita Levi Montalcini”, University of Torino, Turin, Italy and 4Manima Not-for-Profit Healthcare and Assistance, Milan, Italy
Background: Gait Profile Score (GPS) was validated as quality measure for the Gait Analysis (GA) in several patholgies, but GPS was never compared with clinical scales in post-stroke patients.
Objective: The aim of the study was to quantify functional limitation of post-stroke hemiparetic patients using clinical-functional scales and GPS and to assess the presence of correlation between GPS and the clinical-based outcome scales.
Methods: Thirty-three patients were assessed with the Berg Balance Scale (BBS), Trunk Impairment Scale (TIS), Functional Ambulation Category (FAC), Functional Independence Measure (FIM) and Ten-Meter Walk Test (10-MWT); GPS was obtained by GA.
Results: GPS showed a fair relationship with FAC (p = 0.017; r = –0.412), TIS (p = 0.011, r = –0.436) and 10-MWT (p = 0.009, r = 0.49) and good correlation with BBS (p = 0.001; r = –0.561). The three regression models were statistically significant: Model 1 showed that FAC, GPS and FIM had a statistically significant effect in the determination of the BBS, in model 2 and 3, FIM presented a statistically significant effect on TIS determination.
Conclusion: GPS seems to be an independent linear predictor of balance performance in stroke patient, and GVSs on sagittal plane might help clinicians to investigate the acquired compensatory strategies.
Key words: stroke; neurorehabilitation; Gait Profile Score; Gait Variable Score; clinical scale.
Accepted Feb 11, 2021; Epub ahead of print Mar 12, 2021.
J Rehabil Med 2021; 53: jrm00192
Correspondence address: Luca Vismara, Division of Neurology and Neurorehabilitation - IRCCS Istituto Auxologico Italiano, Verbania, Italy. E-mail: lucavisma@hotmail.com
Doi: 10.2340/16501977-2809
The relationship between Gait Profile Score and clinical assessments in 33 post-stroke patients was investigated in this study. The results exhibited that the Gait Profile Score showed a fair relationship with Functional Ambulation Category, Trunk Impairment Scale and Ten-Meter Walk Test and good correlation with the Berg Balance Scale in the hemiparetic group. This study may have clinical implications for rehabilitation evaluation of poststroke hemiparetic patients. This will enable rehabilitation clinicians to quantify the rehabilitation needs of patients more easily, measure rehabilitation progress, and study the relationship between balance and gait impairment.
Disability after stroke is a major burden on society, due to its high incidence and prevalence. This is the case not only for developed countries, but also for low- and middle-incomes countries, where stroke is the fourth-largest cause of disability among people over 65 years of age (1). However, disability after stroke is underestimated, because it is difficult to make an immediate and comprehensive assessment. In 2015 the Global Burden of Disease Study estimated 10.3 million new strokes and 113 million disability-adjusted life years per year (2). In low-income countries, there is also a higher incidence of stroke and deaths compared with high-income countries (3). Among the priorities of rehabilitation programmes, dynamic balance and falls prevention are essential features for the clinical management of hemiparetic patients (4, 5), especially in maintaining walking ability.
The assessment of gait and posture impairment in hemiparetic post-stroke patients is key to planning rehabilitative intervention. Gait and posture are among the most representative and complex human motor attributes, after speech and hand dexterity, due to their adaptation during the evolutionary process. The close physiological relationship between gait and posture has been well described, but there is little evidence regarding the adaptation of gait and posture to cerebral lesions (6).
The gait pattern of hemiparetic post-stroke patients can be variably altered by impairments in motor function, such as weakness and stiffness. These modifications can affect gait control and balance in particular, with homolateral reduction in articular range of motion, stride length and cadence reduction, and occurrence of a classical asymmetrical gait pattern (7).
Some disease-specific clinical scales include gait assessment items, but do not investigate the mechanism and reciprocal effect of balance and gait impairments. Among clinical outcome scales, the Berg Balance Scale (BBS) has been widely adopted for use in hemiparetic patients (8–9), although it is not specifically developed for patients with stroke; however, the scale has a good level of reliability and describes several relevant aspects of the patients’ functional status. Trunk impairment during walking and general ambulatory capacity are also related to balance performance, and these parameters are evaluated using the Trunk Impairment Scale (TIS) and the Functional Ambulation Category (FAC), respectively (10–11). The Ten-Meter Walk Test (10MWT) is considered an excellent measure of “speed” of ambulation (expressed in m/s) in stroke patients, and is useful to describe ambulation status, prescribe exercise, and track functional progress (12). Finally, the Functional Independence Measure (FIM) is considered a “gold standard” for the assessment of activities of daily living (ADL) in rehabilitation, and is a widely used and accepted measure of disability (13).
On the other hand, gait pattern in post-stroke patients has been described quantitativly, evidencing a reduction in walking speed, asymmetric postural behaviour during walking and standing, altered kinematics, and reduced ankle push-off ability during terminal stance (14). In these studies, gait patterns were commonly analysed using many specific parameters obtained from a gait analysis test (spatio-temporal variables, angle values in specific gait instant, range of motion, peak joint moment and power).
There is increasing evidence to support the application of summary parameters computed from gait analysis testing, i.e. the Gait Profile Score (GPS) (15), for the characterization of gait quality in different pathologies. Although the GPS has been studied in patients with celebral palsy and other conditions (16), its application in post-stroke patients has not been extensively studied (17).
GPS can be defined as a summary measure, which, together with its Gait Variable Scores (GVSs), can be used to quantify the deviation of a gait pattern from the physiological condition, thus allowing a simple, objective and immediate view that quantifies the degree of gait impairment and its deviation from normality (18–19). GPS has been shown to have excellent reliability in post-stroke patients. Devetak et al. (18), found a high intra- and inter-session reliability of GPS, in both non-paretic and paretic lower limbs in post-stroke subjects. However, in the same patients, the authors also found that GVS related to the hip joint had lower reliability than the other GVSs; which they consider may be related to the difficulty of placement of precise markers on hip landmarks. More recently, Fukuchi et al. also investigated the effect of gait speed on the GPS in post-stroke individuals, demonstrating that the gait speed significantly affects the GPS (17).
Although some clinical outcome scales have been compared with gait measures of dynamic balance (10–12), correlation of the GPS with clinical outcomes in post-stroke patients has not been investigated. The aims of the current study were: (i) to quantify the functional limitation of a sample of post-stroke hemiparetic patients using clinical-functional scales and GPS; (ii) to assess the correlation between GPS and the clinical outcome scales, in order to elucidate the relationship between balance and gait impairment.
Study sample
A total of 33 post-stroke patients (18 left and 15 right hemiplegic patients; 12 females, 21 males; mean age: 59 years (standard deviation (SD) 13 years); time since stroke event 4.46 years (SD 1.84 years) were enrolled at the San Giuseppe Hospital, Istituto Auxologico Italiano, Piancavallo, Verbania, Italy. All patients were classified according to the classification of Bamford (20) and had characteristics of partial anterior circulation infarcts (PACI). Inclusion criteria were: age > 18 years, presence of paresis in one lower limb, ability to understand instructions for performing the gait analysis test, and ability to walk 10 m without the assistance of another person or walking aids. Exclusion criteria were: patients with bilateral stroke and those with a history of other neurological or musculoskeletal disorders unrelated to stroke.
A group of 20 unaffected, age-matched, individuals (10 females, 10 males; mean age 53.9 years (SD 11.2 years); body mass index (BMI) 22.8 kg/m2 (SD 13 kg/m2) were recruited from among the hospital staff as the control group for computation of GPS normal values. The controls were free of any neurological and musculoskeletal disorder considered able to influence gait. The study procedure was explained in detail to participants, and the study was performed in accordance with the ethics standards of the Institute Auxologico Italiano and with the Declaration of Helsinki 1964 and its latest amendments. Written informed consent was obtained from all participants.
Clinical assessment
Patients were clinically evaluated with the following scales and tests:
3D-gait analysis
All participants were evaluated with 3D-Gait Analysis (3D-GA) at the Movement Analysis Laboratory of the San Giuseppe Hospital, Istituto Auxologico Italiano, Piancavallo (VB), Italy, using an optoelectronic system composed of 6 cameras (VICON, Oxford Metrics Ltd, Oxford, UK) set at 100 Hz as sample rate, and 2 force platforms (Kistler, Winterthur, CH; acquisition frequency 500 Hz). Kinematic evaluation was performed using passive reflective markers according to the Davis protocol (21). After placement of the markers, participants were asked to walk barefoot at a self-selected speed along a walkway with force platforms embedded in its central part. To ensure reproducibility of results, kinematic and kinetic data were collected from at least 5 trials for each individual.
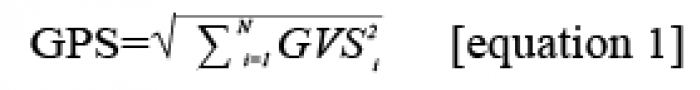
Kinematic data obtained from 3D-GA were processed to compute the GPS (and its GVSs), as described by its author, using SmartAnalyser software (BTSBioengineering, Milan, Italy; version 1.10.465). In mathematical terms, the GPS represents the root mean square (RMS) difference between the individual joint’s curve and the mean curve calculated for a reference population of unaffected individuals. The overall GPS is based on 15 clinically important kinematic variables (pelvic tilt, obliquity and rotation, hip flexion, abduction and internal rotation, knee flexion, ankle dorsiflexion and foot progression for left and right sides (given that the pelvis is common to both segments it is sensible to include pelvic kinematics from one side only and the left is used by convention in the original paper), which are expressed as GVSs, each variable representing the RMS difference between a specific time-normalized gait variable and the mean data for a population of healthy individuals. The GPS is the RMS mean of the GVS variables [see equation 1]
In this analysis, a GPS score for each side was used, based on all 9 GVSs for the same side. As the GPS represents the difference between the patient’s data and the mean from the reference dataset, the higher the GPS value, the lower the physiological gait pattern. Values for unaffected individuals lie in the range 5–6° (22).
Kinetic data were not analysed in this study, even if acquired.
Statistical analysis
All parameters were computed bilaterally for each participant. As the results for all parameters of interest were normally distributed (after the Kolmogorov–Smirnov test), a parametric statistic was used. One-way analysis of variance (ANOVA) was used to compare the paretic lower limb with the non-paretic lower limb, and with healthy controls. Furthermore, post hoc analysis was performed to assess the contribution of each group to the variance in the GPS (and its GVSs).
Pearson’s correlation coefficients were calculated to investigate the relationships between GPS and its GVSs and clinical scale scores. The magnitude of the coefficients was interpreted based on Hinkle’s guidelines, whereby r< 0.30 is considered a weak; 0.30–0.50 a fair; 0.50–0.70 a good; and r> 0.70 a high correlation (23).
Multivariate regressions were used to estimate the relationship between clinical variables, GPS, and 3 disability scales frequently used in post-stroke patients (the BBS, FIM and TIS). In the first model FAC, FIM and GPS were incorporated as independent variables, since there was no evidence of collinearity, while BBS was considered as a dependent variable. The second model considered FAC, GPS and FIM as independent variables and TIS as a dependent variable. Then, the third model was implemented, with FAC, GPS, BBS and TIS as independent variables and FIM as a dependent variable. After development of the models, several statistical procedures were performed to assess the fit of the models, including: residuals of the regression plots for examination of their normal distribution, plots of independent variables for identification of the necessity for their log transformation, and the study of potential interaction between independent variables. The goodness of fit of the models was quantified and reported as adjusted R2. Each individual regression coefficient is discussed in the results section and summarized in Table I, to enable better interpretation of the contribution of single variables when other variables are held constant. The significance level was set at p < 0.05. Statistical analyses were performed using Statistica software (Statsoft, College Station, Texas USA).
Table I. Multivariate linear models including standard error of the mean (SEM), p-values, 95% confidence interval (95% CI) and models’ R2
The clinical and functional characteristics of the post-stroke group are shown in Table II. Patients showed moderate disability in terms of balance, as indicated by the BBS score, but mild-to-moderate gait motor performance according to the FIM and FAC values.
In the hemiparetic group the GPS values for paretic and non-paretic lower limbs (10.07° ± 3.17° vs 9.26° ± 3.35°) were statistically similar (p > 0.05); no statistical differences in GVSs were observed when comparing paretic and non-paretic limbs (Table III).
Table II. Post-stroke sample characteristics (n=33)
Table III. Mean and standard deviation (SD) values of Gait Variable Score (GVS) for the paretic and non-paretic side of post-stroke group and healthy group
Table IV shows the correlation coefficients between the GVSs and GPS for the paretic and non-paretic limbs. All GVSs correlated significantly with GPS, except for the GVS related to pelvic obliquity. None of the GVSs showed particularly high correlations (r>0.70) with GPS (the highest correlation was for ankle dorsiflexion, r = 0.69).
Table IV. Correlations between Gait Profile Score (GPS) and Gait Variable Scores (GVSs)
The GPS showed a fair relationship with FAC (p = 0.017; r = –0.412), TIS (p = 0.011, r = –0.436) and 10-MWT (p = 0.009, r = 0.49) and good correlation with BBS (p = 0.001; r = –0.561). GPS of the paretic limb showed good correlations with FAC (p = 0.003, r = –0.505), BBS (p = 0.001, r = –0.557) and TIS (p = 0.011, r = –0.561) and fair correlations with 10-MWT (p = 0.012, r = 0.433). As for the GVSs (Table V), those related to knee flexion and ankle dorsiflexion of the paretic side showed significant correlations with FAC, TIS, and 10-MWT; GVS related to knee flexion also correlated with FIM. Some of these correlations were also observed in terms of GVSs of the non-paretic side. In particular, negative correlations were found between GVSs and FIM, FAC, BBS, and TIS; hence, the higher the value of the clinical scale (i.e. less functional limitation), the lower the value of the GVSs (i.e. better walking ability). In contrast, there was a positive correlation between GVSs and 10-MWT and, again, this means that the longer the time taken in the 10-MWT (i.e. lower ability in performing the test), the higher the value of the GVSs (i.e. lower walking ability).
Table V. Correlation coefficients between indices related to Gait Variable Scores (GVSs) and clinical-functional scales
The 3 regression models were statistically significant; models 1 and 2 had a p-value < 0.001, and model 3 had a p-value of 0.004. Table I describes each interaction of the variables in the 3 models in detail. Model 1 shows that FAC, total GPS and FIM had a statistically significant effect in determination of the BBS, with an adjusted R2 of 0.72. In model 2, FIM is the only variable that had a statistically significant effect on TIS determination, with a model adjusted R2 of 0.46. The results of model 3 were in agreement with model 2, with TIS being the only variable showing a significant effect on FIM determination. There was no evidence of interaction between the variables in the models; hence this was not specifically reported.
This study found that the gait pattern of chronic post-stroke patients, as summarized by GPS and GVSs, deviated from the values in the control group. Significantly larger values were observed for hip flexion, hip rotation, knee flexion and ankle dorsiflexion, whereas pelvic parameters, hip abduction and foot progression were matched those of the parameters from the control group. Notwithstanding this, a non-significant difference was observed between paretic and non-paretic sides in post-stroke patients. These results are in partial agreement with previous studies (16) that reported differences between the lower limbs in terms of knee flex-extension, ankle dorsi-plantarflexion (sagittal plane), and hip abdo-adduction (frontal plane). These different results could be explained by the variation in time since stroke, which was approximately 6 months in the study of Devetak et al. compared with more than 4.5 years in the current study (18). From a clinical viewpoint, the presence of a more stable walking pattern, acquired in the chronic post-stroke phase, can be reached with both the partial restoration of movements of the paretic limb and the development of motor compensation patterns of the non-paretic limb that lead to kinematic alterations. It is notable that, during the acute and subacute post-stroke phase, the kinematic disruption of normal gait patterns can influence the non-paretic limb.
Regarding the clinical-functional scales and biometric gait patterns, moderate correlation was found between balance functional scales with GPS or GVS. Good correlation was found between dynamic balance during gait, assessed with BBS, and some GVSs (pelvic obliquity, and hip, knee, and ankle joints on the sagittal plane) of the paretic lower limb. These results suggest a possible covariance between GPS and the clinical assessment of balance that may help in the understanding of how balance and gait are clinically linked via multiple levels of integration. In particular, a significant correlation was found for movements in the sagittal plane. This may be due to a relatively higher involvement of the movements in the sagittal plane during gait. Furthermore, model 1 found a significant involvement of GPS on dynamic balance, while it was adjusted for FAC and FIM values. As expected, FAC and FIM had an influence on BBS determination, showing a mean variation in BBS, respectively, of 6.54 p. and 0.12 p. for each variation point. Interestingly, model 1 shows that GPS has a negative interaction with BBS, with a prediction of a reduction of nearly 0.8 points in BBS for each degree of increment of the GPS. Furthermore, the model 1 presented a coefficient of determination that explains, with a good approximation, the variability in BBS. This raises the possibility of using GPS values as a predictor of risk of falling. In contrast, in models 2 and 3, the GPS did not have a significant linear effect on the determination of FIM and TIS, which were significant factors affecting determination in each of those models.
At the same time, a moderate correlation emerged between GVSs and the FIM, which is a scale that includes cognitive evaluation (24). This pattern is in agreement with recent results describing how poor cognitive function can predict lower prefrontal recruitment during walking (25).
Motor control of the trunk, assessed by TIS, presented a fair correlation with the GPS value and with some GVSs for the paretic limb. These significant results confirm the influence of the ability to control trunk movements on lower limb performance and related dynamic postural adaptations, since this scale is used during static and dynamic tasks. Ambulation classification, assessed with the FAC, presented a correlation with GPS and GVS values related to the ankle dorsi-plantarflexion and knee flex-extension of the paretic side. The scores of the hemiparetic group analysed in the current study ranged from 3 to 5, requiring verbal supervision, but no physical support during walking. In this case, the distal joints (ankle and knee joints) correlated more than the proximal ones, probably because FAC is a rather demanding test that requires subjects to perform ambulation on the ground, including on slopes and stairs, and these tasks require a relatively higher functionality and control in the distal joints (26), which is often lacking in post-stroke patients.
A possible limitation of the current study is the exclusion of data on patients’ walking speed. It has been reported that walking speed affects the gait patterns of both healthy (27) and pathological individuals (28–29). Fukuki et al. have presented a modified version of the GPS, the GPS velocity, which seems to be effective in reducing the impact of gait speed on the GPS (17). However, the observed mean difference between traditional GPS and GPS velocity in Fukuki’ study was only 0.5° (range 0.0–1.4°), lower than the minimal clinically significant difference for GPS post-stroke, which is 1.6°, and approximately 1° for the slowest patients in comparison with the reference dataset. In the current study, the traditional computation of GPS values was preferred, because the correlations with the clinical scales were considered without normalization for walking speed. Nevertheless, deviations in GPS can be used to detect specific gait impairment post-stroke at a glance, and to demonstrate the presence of compensatory strategies in the non-paretic limb, with global good clinical correlations and agreements, not yet investigated.
Conclusion
In conclusion, multivariate linear modelling in this study revealed a clinical relationship between global gait performance, selective limb performance, balance, and trunk control. GPS is an independent linear predictor of balance performance in patients with chronic stroke, and study of GVSs on the sagittal plane may help clinicians in understanding of acquired compensatory strategies. Future studies are needed to elucidate the predictive value of GPS in acute post-stroke patients and its role in the development of rehabilitative programmes for these patients.
This study was supported by Ministero dell’Istruzione, dell’Università e della Ricerca—MIUR project “Dipartimenti di Eccellenza 2018–2022” to Department of Neuroscience “Rita Levi Montalcini” and the “health and wellness technology platform” Re-Home Project (Code: 320-42; POR FERS 2014/2020).
LV would like to thank the PhD Programme in Experimental Medicine and Therapy of the University of Turin.
The authors have no conflicts of interest to declare


 Click to show fullsize
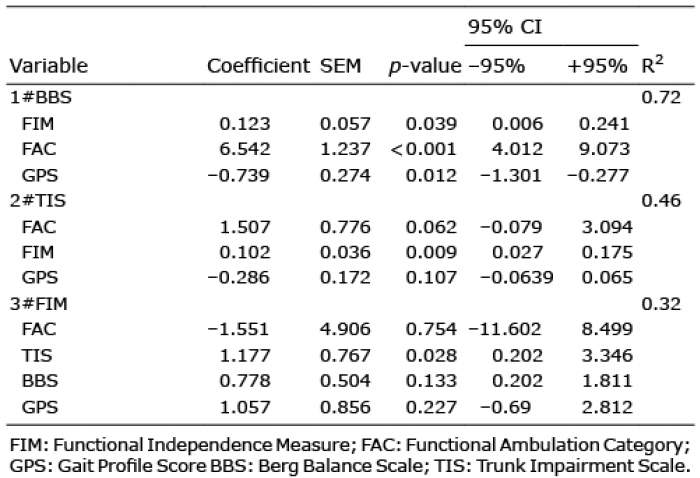 Click to show fullsize
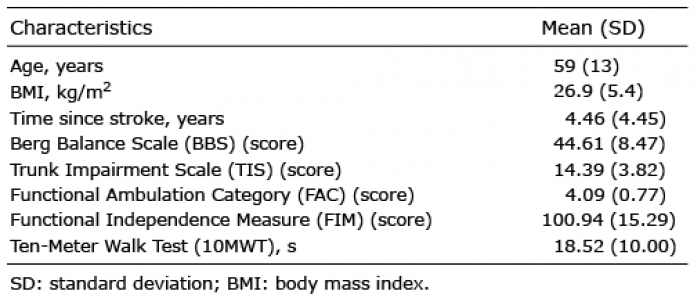 Click to show fullsize
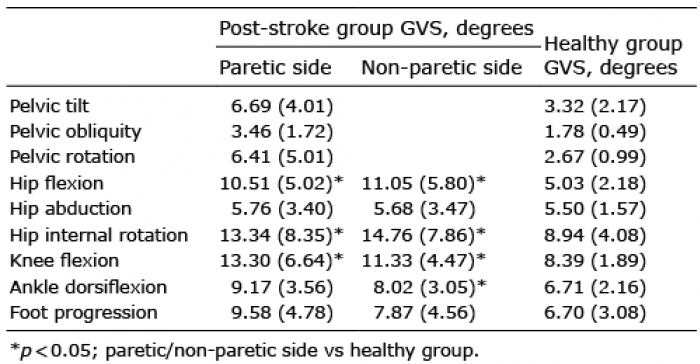 Click to show fullsize
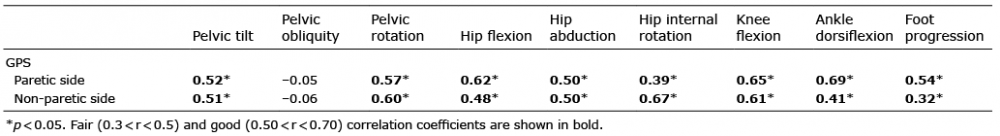 Click to show fullsize
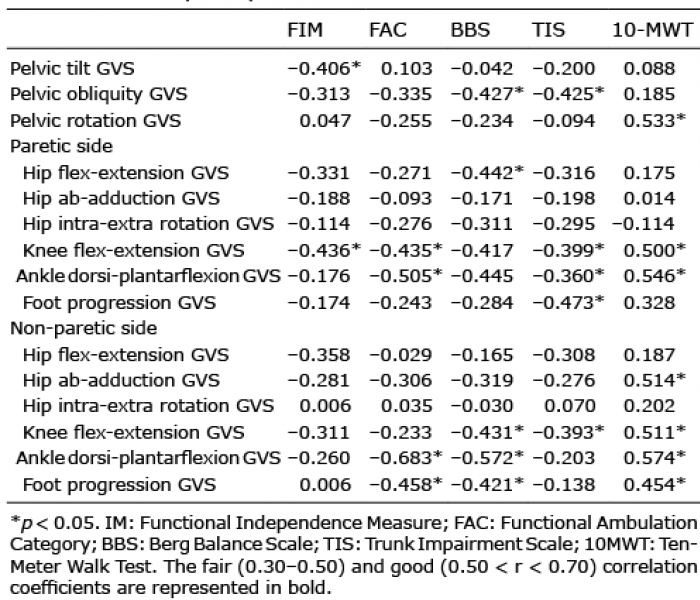 Click to show fullsize