
From the 1Department of Rehabilitation Sciences, The Hong Kong Polytechnic University, Hung Hom, 2School of Nursing and Health Studies, The Open University of Hong Kong, Ho Man Tin, and 3School of Nursing, The Hong Kong Polytechnic University, Hung Hom, Hong Kong (SAR)
Objective: To identify the psychometric properties of the Long-Distance Corridor Walk (LDCW) among community-dwelling stroke survivors.
Design: Cross-sectional.
Subjects: Twenty-five stroke survivors and 25 healthy older adults.
Methods: The LDCW was administered to the 25 stroke survivors on 2 separate days with a 7-day interval. Fugl-Meyer Assessment for the Lower Extremities (FMA-LE), measurement of lower limb muscle strength, Berg Balance Scale (BBS), limit of stability (LOS), Narrow-Corridor Walk Test (NCWT), Timed Up and Go (TUG) test, and the Community Integration Measure—Cantonese version (CIM) were performed on one of the days. The healthy older adults completed the LDCW once, and the results were recorded by a random rater.
Results: The LDCW showed excellent inter-rater reliability and test-retest reliability, and significant correlations with FMA-LE, BBS, TUG, and NCWT. A cut-off score of 127.5 m for the 2-min walk and 426.69 s for the 400-m walk distinguished stroke survivors from healthy older adults. The MDC in the LDCW in the 2-min walk and 400-m walk were 18.69 m and 121.43 s, respectively.
Conclusion: The LDCW is a reliable clinical measurement tool for the assessment of advanced walking capacity in stroke survivors.
Key words: stroke rehabilitation; walking ability; community integration.
Accepted Apr 27, 2020; Epub ahead of print May 15, 2020
J Rehabil Med 2020; 52: jrm00062
Correspondence address: Shamay S.M. Ng, Department of Rehabilitation Sciences,The Hong Kong Polytechnic University, Hong Kong. E-mail: Shamay.Ng@polyu.edu.hk
The Long-Distance Corridor Walk (LDCW) was originally used to measure the cardiorespiratory fitness of healthy older adults. We proposed that the LDCW could be used to comprehensively measure the advanced walking capacity of stroke survivors and reflect their level of community integration. The present study aims to identify the psychometric properties, including the inter-rater reliability, test-retest reliability and concurrent validity, of the LDCW, using both community-dwelling people with stroke and community-dwelling older adults as control subjects. This study also investigates the performance of LDCW with stroke survivors and healthy older adults, determines the cut-off of LDCW completion times that differentiate stroke survivors from healthy older adults and identifies the minimum detectable change (MDC) of the LDCW. The results showed that the LDCW is a reliable clinical measurement tool for the assessment of advanced walking capacity in stroke survivors.
As the worldwide prevalence of stroke is increasing (1), the cost of stroke care is placing growing pressure on the healthcare system. In Hong Kong, elderly people with strokes are expected to incur a direct medical cost of HK$3,979 million by 2036 (2). With such a foreseeable burden, more research should be dedicated to the investigation of valid tests to allow earlier and more cost-effective treatment, which could enhance the community integration of stroke survivors.
Advanced walking capacity, including walking endurance and walking speed, is significant for the community integration of stroke survivors. Previous studies have shown that walking endurance has a significant association with social participation, as reported using the Stroke Impact Scale (r = 0.56) and the Subjective Index of Physical and Social Outcome, which determines the level of community integration (r = 0.545) (3, 4). Walking speed is another valid predictor of community integration, because stroke survivors with a walking speed faster than 0.42 m/s in the first 3 months after a stroke are expected to become independent community walkers (5). Walking speed has a significant correlation (r = 0.64) with the Stroke Impact Scale score in physical and social participation domains (6).
Current assessments of walking endurance have limitations. The endurance shuttle walk test reflects the ability to perform activities of daily living to a lesser extent, because the subjects walk at an externally paced constant speed (7). As the subjects are not self-paced during this walking test, it does not simulate everyday walking (7). In the 6-min walk test, subjects walk as far as possible with no warm-up, in order to minimize learning effects (8). A consistent learning effect has been demonstrated in various subject groups, such as a 6% learning effect in cardiac patients (9). Time-based tests have also been found to be incapable of motivating older adults to achieve their maximal capacity (10). Based on the externally paced constant speed and potentially underestimated walking capacity, these existing measures may not reflect the adopted ambulation of stroke survivors when living in the community.
The Long-Distance Corridor Walk (LDCW) is a 2-staged clinical measure assessing walking speed and walking endurance and differentiating walking capacity at the high end in healthy older adults. The first stage of the LDCW records the distance of a 2-min walk (2MW) along a 20-m pathway to measure walking speed, in which the first 20-m walk is the warm-up (9). The time and the number of steps taken in the first 20 m are also recorded. The second stage records the time of a 400-m walk (400mW) on the same pathway to measure walking endurance, in which the subjects are instructed to self-pace and the distance is recorded (11). Although the LDCW was originally developed to measure the cardiorespiratory fitness of healthy older adults (9), it can minimize the learning effects and motivate subjects to achieve maximal capacity in self-paced walking.
A reliable and valid measure of advanced walking capacity in stroke survivors would help clinicians to design suitable rehabilitation programmes and monitor patients’ progression. Given that the LDCW comprises both the 2MW and the 400mW, the authors propose that the LDCW could be used to comprehensively measure the advanced walking capacity of stroke survivors. How-ever, no previous studies have tested the psychometric properties of the LDCW with stroke survivors. Only one study has demonstrated high test-retest reliability of the 400mW (intraclass correlation coefficient (ICC) 0.92– 0.97) (11) among healthy women. In addition, the potential correlations between the LDCW and stroke-specific outcome measures have not been investigated. To measure the properties of the LDCW and the potential benefits of applying it to stroke survivors, this study aimed to: (i) establish the inter-rater and test-retest reliabilities of the LDCW; (ii) investigate the performance of the LDCW with stroke survivors and healthy older adults; (iii) explore the concurrent validity between the LDCW and stroke-specific outcome measures; (iv) determine the cut-off LDCW completion times that differentiate stroke survivors from healthy older adults; and (v) identify the minimal detectable change (MDC) of the LDCW.
Participants
A convenience sample of 50 subjects was recruited through poster advertisements. Twenty-five stroke survivors were recruited from local self-help groups. Subjects were included if they: (i) were aged 50–80 years; (ii) had had a single stroke with unilateral hemiparesis at least one year before the study; (iii) were able to walk at least 10 m without an assistive device; and (iv) scored at least 7 in the Chinese version of the Abbreviated Mental Test. Stroke survivors were excluded if they: (i) had other neurological conditions or comorbid disabilities that could have distorted proper assessment, (ii) could not complete the LDCW trial independently without an assistive device, or (iii) had any additional significant medical condition, such as angina pectoris. Twenty-five healthy older adults over 50 years of age were recruited from the local community and were included if they had no condition that could distort their mobility and proper assessment.
The participants were informed of the study’s purposes and procedures. Written consent was obtained before data collection. The ethics committee of the local institution approved the study protocol. All of the procedures were conducted according to the guidelines of the Declaration of Helsinki (12).
Ethics approval and consent to participate. The Departmental Research Committee of the Hong Kong Polytechnic University approved the research protocol (HSEARS20180127001). Written informed consent was obtained from all the participants before the study started. This study followed all of the guidelines set out in the Declaration of Helsinki.
Procedure
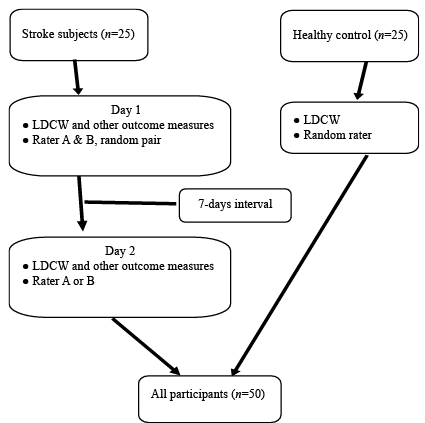
Assessments were conducted in a university-affiliated neurorehabilitation laboratory. All subjects were first asked to complete a sociodemographic and fall data extraction form. The LDCW was administered to the stroke survivors on 2 separate days, with a 7-day interval. The subjects were assessed simultaneously by a random pair of raters (raters A and B) on Day 1 and by a random rater (rater A or B) on Day 2. The raters were trained and had worked in stroke rehabilitation research for at least 6 months. The Fugl-Meyer Assessment for the Lower Extremities (FMA-LE), lower limb muscle strength, Berg Balance Scale (BBS), limit of stability (LOS), the Narrow-Corridor Walk Test (NCWT), the Timed Up and Go (TUG) test, and the Community Integration Measure – Cantonese version (CIM) were performed on either day. The sequence of the assessments was randomized by an online random generator, and a 2-min break was allowed between assessments (Fig. 1).
Fig. 1. Flow chart of assessment procedure. *Other outcome measures: FMA-LE: Fugl-Meyer Assessment for the Lower Extremities; lower limb muscle strength, BBS: Berg Balance Scale, LOS; NCWT: Narrow-Corridor Walk Test; TUG: Timed Up and Go and CIM: Community Integration Measure – Cantonese version.
The healthy older adults were assessed by other raters who were trained physiotherapy undergraduate students. Each subject completed the LDCW once, and the results were recorded by a random rater.
Long-Distance Corridor Walk test. The first stage of LDCW is a 2MW. The subjects walk back and forth along a 20-m corridor with markings at both ends. They are instructed to cover as much distance as possible. The time and steps taken in the first 20 m and the distance covered over the 2 min are recorded. Subjects are allowed to rest for 30 s after the first stage. Subjects who experience discomfort or cannot complete the 2MW do not proceed to the second stage, a 400mW in the same corridor, during which the subjects are instructed to walk at a comfortable speed while the time is recorded (10).
Fugl-Meyer Assessment for the Lower Extremities. The FMA-LE assesses motor impairment of the legs in terms of reflexes, movements, and coordination. It has been shown to possess excellent interrater reliability (ICC 0.89–0.95) and intra-rater reliability (ICC 0.96) with stroke survivors (13). It comprises 17 items, each rated on a scale of 0 to 2, for a total score of 34. A higher score indicates a lower level of motor impairment (14).
Lower limb muscle strength. Lower limb muscle strength signifies the strength of the dorsiflexors and plantarflexors in the affected and unaffected legs as measured by hand-held dynamometers. This method of dynamometry has shown excellent inter-rater reliability (ICC 0.91) and test-retest reliability (ICC 0.98) with patients with orthopaedic or neurological conditions (15). In this study, lower limb muscle strength was assessed twice on alternate sides with a 1-min interval, with the feet off plinths (subjects were lying supine with nothing to support or place under their feet), and the average strength of each muscle group was calculated.
Berg Balance Scale. The BBS evaluates functional balance. It has shown excellent intra-rater reliability (ICC 0.97) and inter-rater reliability (ICC 0.95– 0.98) with stroke survivors. It comprises 14 items, each rated on a scale of 0 to 4, for a maximum score of 56 (16).
Limit of Stability. Computed dynamic posturography (Bertec Corp., Columbus, USA) is used to measure postural balance. Computed dynamic posturography systems, such as Balance Master, have demonstrated good reliability (ICC 0.84–0.88) with stroke survivors (17). Limit of Stability (LOS) measures the maximum displacement of the centre of pressure (COP) in various directions without loss of balance. The subject stands on a force plate and moves toward targets in various directions by leaning as far and as fast as possible. The movement velocity (LOS_MV), which is the mean speed of COP movement (18), in each direction is recorded to give a composite score.
Narrow-Corridor Walk Test. The NCWT assesses gait instability and balance. It has shown good to excellent relative reliability (ICC 0.77– 0.92) with older adults (19). The time required to complete a narrow 6-m path is measured. In this study, the path width was normalized to 50% of the distance between the participant’s anterior superior iliac spine plus the width of the subject’s shoe (19). Subjects were asked to walk at a comfortable pace for 3 trials to calculate the average completion time.
Timed Up and Go test. The TUG test is a functional mobility test with excellent reliability (ICC 0.95) in stroke survivors (20). Subjects are instructed to rise from an armchair, walk back and forth once along a 3-m path, and sit back in the original chair (21). The mean time for 2 trials was obtained and recorded.
Community Integration Measure – Cantonese version. The CIM is a 10-item self-reported questionnaire regarding community integration. The Cantonese version of the CIM has demonstrated good test-retest reliability (ICC 0.84) and internal consistency (Cronbach’s alpha, 0.84) with stroke survivors (22). A higher score indicates a higher level of self-reported community integration (22).
Statistical analysis
The data were analysed with SPSS software (version 23) (IBM Corp. ). The Shapiro-Wilk statistic was used for data normality checking. Independent t-tests and the Mann–Whitney U test were used to compare the between-group differences in demographics for the parametric and non-parametric data, respectively.
ICC2,1 was chosen to assess inter-rater reliability, as the raters were randomly assigned and generalization of the results was allowed. Test-retest reliability was measured using ICC3,1 as the raters were fixed and a single measurement was taken. Reliability was defined as excellent (ICC > 0.9), good (ICC 0.75–0.9), moderate (ICC 0.50–0.75), or poor (ICC < 0.50) (23). The sample size calculations for test-retest reliability were based on an alpha level of 0.05 (2-tailed) and a power of 0.8. The expected reliability was set at ICC = 0.50 to avoid an over-estimation of the agreement at 2 time-points and the required sample size was 22 for each of the stroke subject and healthy older adult group. Allowing for a 10% of attrition, a total required sample size was 50 ((22+10%) × 2).
Correlations between the LDCW and all other outcome measures were established using Pearson’s r for parametric data and Spearman’s rho for non-parametric data. As there were 6 primary outcome measures, the p-value was set to 0.008 (0.05/6) after Bonferroni adjustment. Correlation strength was classified as good to excellent (r > 0.75), moderate to good (r = 0.50–0.75), fair (r = 0.25–0.49), or little or no correlation (r < 0.25) (23).
The MDC is defined as a valid change in score that is not due to chance and calculated as follows:
MDC = 1.96 × standard error of measurement (SEM) × √(2) (24).
It was computed with the test-retest reliabilities (24), as follows: SEM = Sx√(1–r)
(Sx: standard deviation (SD) of LDCW test results on days 1 and 2; r: test-retest reliability coefficient) (24).
Receiver operating characteristic (ROC) curves were generated to identify optimal cut-offs for the LDCW time, step count, distance of the 2MW, and time taken for the 400mW to distinguish stroke survivors from healthy older adults. The trade-off between sensitivity and specificity was determined by Youden’s index.
Twenty-five stroke survivors and 25 healthy older adults were recruited (Table I). Between-group differences were found in age, sex and body mass index.
Reliability
Excellent inter-rater (ICC2,1 0.988–0.996) and test–retest (ICC3,1 0.961–0.972) reliabilities were found for the 2MW and 400mW (Table II). The MDCs of the LDCW were summarized in Table III.
Table I. Demographics of the people with stroke and the healthy older adults
Table II. Inter-rater and test-retest reliability of Long Distance Corridor Walk in people with stroke
Table III. Minimal detectable change of Long Distance Corridor Walk in people with stroke
Performance of the Long-Distance Corridor Walk
The performance of LDCW was summarized in Table IV. The healthy older adult had better performance in both the mean time and mean step count for the first 20 m in 2MW, and the mean time in 400MW than the stroke survivors.
Table IV. Performance of Long Distance Corridor Walk in people with stroke and healthy older adults
Correlation of the Long-Distance Corridor Walk with other outcome measures
For the 2MW, the completion time and step count for the first 20 m showed a significant positive correlation with the NCWT (r = 0.694–0.794) and TUG test scores (r = 0.756–0.832) (Table V). The completion time of the 2MW had a significant negative correlation with the FMA-LE (r = –0.631) and BBS (r = –0.568) scores, and the step count for the first 20 m had a significant negative correlation with the BBS (r = –0.538). Distance showed a significant positive correlation with the FMA-LE (r = 0.595) and BBS (r = 0.578) scores and a significant negative correlation with the NCWT (r = –0.786) and TUG test (r = –0.836) scores.
For the 400mW, the completion time had a significant positive correlation with the NCWT (r = 0.767) and TUG test (r = 0.810) scores and a significant negative correlation with the FMA-LE (r = –0.519) and BBS (r = –0.595) scores.
Table V. Correlations of performance between Long Distance Corridor Walk with stroke-specific impairments in people with stroke (all correlations are Spearman’s rho coefficients unless otherwise indicated)
Sensitivity and specificity
Fig. 2 shows the area under the curve (AUC) of the LDCW that differentiated people with or without stroke. For the 2MW, the cut-off time, step count and distance were 18.33 s, 32.5, and 127.5 m with sensitivity 72–80% and specificity 80–96%, respectively. The cut-off time taken for the 400mW was 426.69 s (sensitivity 72%, specificity, 96%) (Table VI).
Fig 2. Receiver operating characteristic curves for Long Distance Corridor Walk (LDCW). a) Receiver operating characteristic curves for Long Distance Corridor Walk (LDCW) for discriminating between people with stroke and healthy older adults in 2MW – time† (area under the curve (AUC) = 0.856). † in the first 20 meter. b) Receiver operating characteristic curves for Long Distance Corridor Walk (LDCW) for discriminating between people with stroke and healthy older adults in 2MW – step count† (area under the curve (AUC) = 0.885). † in the first 20 m.
Table VI. Value of area under the receiver operating characteristic curve, sensitivity and specificity for the optimal cut-offs of Long Distance Corridor Walk
This is the first study to investigate the inter-rater reliability, test-retest reliability, and MDC of the LDCW with stroke survivors as a measure of advanced walking capacity. The LDCW results show a significant correlation with the stroke-specific outcome measures. It is also the first study to determine cut-off values for the LDCW to differentiate stroke survivors from healthy older adults.
Reliability of the Long-Distance Corridor Walk on stroke survivors
The excellent inter-rater (ICC 0.988–0.996) and test-retest reliabilities (ICC 0.961–0.972) show that the LDCW is a simple and reliable test to assess advanced walking capacity in stroke survivors. The standardized protocol and explicit instructions by well-trained raters probably helped to minimize the measurement error, contributing to the high reliability. Moreover, the high test-retest reliability might result from the use of a 7-day test-retest interval.
Despite the absence of studies investigating the reliability of the LDCW, the reliability of the 2MW and 400mW, which are components of the LDCW, has been investigated previously in different subject groups. The inter-rater reliability of the 2MW distance of the stroke survivors in the current study (ICC 0.996) was better than the inter-rater reliability (ICC 0.85) achieved by stroke survivors in a study by Kosak & Smith (25). Two raters took the measurement simultaneously during the test in the current study, while the same subjects were assessed by 2 raters on 2 separate days to construct the inter-rater reliability in the previous study (25). Greater differences arose due to the increased variability in the subjects’ performance on 2 separate days. However, another possible explanation cannot be excluded; that our subjects performed better than those in the study by Kosak & Smith (25) due to the different recovery stage. As the mean post-stroke period in Kosak & Smith (25) and the present study was 28 days and 60.6 years, respectively, the walking speed of our subjects could be more stable than those in the study by Kosak & Smith (25).
The 400mW is reliable in measuring the performance of subjects among different groups. The excellent test-retest reliability of the distance covered in the 2MW (ICC 0.964) and the time taken for the 400mW (ICC 0.961) in the current study was consistent with previous studies of people with chronic post-poliomyelitis syndrome (ICC 0.94) (26) and coronary patients at the end of the outpatient cardiac rehabilitation programme (ICC 0.932) (27), respectively. Steady conditions, including the daily functions of stroke survivors, motor neurone functions of chronic post-poliomyelitis, and physical exercise capacity of coronary patients in the studies (26, 27), helped to minimize the variability in test-retest performance (28–30). The recovery potential of stroke survivors reaches a plateau after 6 months (30). All of the subjects in the current study had had a stroke more than 12 months earlier, which indicates that their functional capacity had stabilized. Similar to the reliability found in the current study, an excellent test-retest reliability of the time taken for the 400mW (ICC 0.95) was found with healthy middle-aged women in a study led by Pettee Gabriel et al. (11), as their health conditions did not vary.
The differences in time (approximately 10 s), step count (approximately 11) and distance (approximately 47 m) in 2MW between healthy older adults and stroke survivors markedly exceeded the calculated MDC (time, 4.78 s; step count, 6.56; distance, 18.69 m). The difference in the time (approximately 208 s) taken for the 400mW between the healthy older adults and stroke survivors noticeably surpassed the calculated MDC (time 121.43 s). The disparities indicate that there was probably a genuine distinction, instead of a measurement error, between the stroke survivors and healthy older adults.
Performance of the Long-Distance Corridor Walk
No previous studies have evaluated the LDCW in stroke survivors. However, the 2MW and 400mW have been studied separately in various subject groups. The distance achieved in the 2MW by the stroke survivors in the current study (mean 103 m (SD 35.07)) was slightly shorter than that in a previous study of stroke survivors by Dawes (median 114.62 m) (31). Survivors of ischaemic and haemorrhagic strokes were both recruited in the current study (18 with ischaemic stroke, 7 with haemorrhagic stroke), whereas only those with ischaemic stroke were recruited in that study (31). Survivors of haemorrhagic stroke generally have more severe problems with leg strength and gait (32). This explains the slightly poorer performance in the current study. The distance covered by the stroke survivors in the current study (mean 103 m (SD 35.1)) was approximately double that reported in studies (mean 43.47 m (SD 7.47); mean 51.2 m (SD 38.2)) of people in the subacute stage of a stroke (i.e. mean duration since stroke ranged from 9 to 21.6 days) (33, 34). The recovery stage accounts for the difference, because the stroke survivors in the current study were better adapted to the environment functionally with their gait than people in the subacute stage of a stroke, and thus walk better (33). No previous study has investigated the step count and time for the first 20 m of the 2MW by stroke survivors.
The time and step count for the first 20 m of the 2MW of the stroke survivors in the current study (mean 24.73 s (SD10.84); mean 41.32 (SD 12.26)) were significantly greater than those of healthy older adults (mean 15.13 s (SD 2.89); mean 29.88 (SD 3.19)), possibly due to the reduced step length and gait speed of stroke survivors (35). They require more steps and more time to cover the 20 m. As expected, the stroke survivors’ distance in the 2MW (mean 103.24 (SD 35.07)) was significantly shorter than that of the healthy older adults (mean 150.70±25.31 m). The poorer performance of the stroke survivors can be explained by the reduction in the motor unit firing rates, which diminishes muscle strength and intermuscular coordination (36). Gait performance, primarily contributed by leg muscle strength and coordination, is severely jeopardized after a stroke (37).
The distance covered in the 2MW (mean 150.7 m (SD 25.31)) by the healthy older adults in the current study was comparable to that in a study by Georgiopoulou et al. (mean 155 m (SD 26)) (38). Although the mean height in that study (166.7 cm (SD 92.9)) (39) was greater than that in the healthy control group in the current study (159.2 cm (SD 7.05)), their mean age (73.5 years (SD 2.8)) was higher than that of the subjects in the current study (64.3 years (SD 6.77)). Walking speed increases with height and decreases with age (39). Subject homogeneity (i.e. similar inclusion criteria) may also explain the comparable result. The interference of these 3 factors could lead to comparable results.
The stroke survivors in the current study walked approximately 40% slower in the 400mW (mean 51.49 m/min (SD 18.43)) than coronary patients at the end of a cardiac rehabilitation outpatient programme in a study by Morard (mean 85.3 m/min) (27). The walkway in that study was a 50-m walking track (27), and that in the current study was 20 m. A greater number of turns that use up more time and effort on a shorter walkway may have contributed to the difference (40). Another possible reason is that the coronary patients in Morard’s study had recovered well by the end of the programme (27). They completed the 6MWT at a mean speed of 1.40 m/s, which reached normal walking speed. The poorer performance of the stroke survivors in the current study was expected because they had motor impairments, such as muscle weakness and impaired balance ability, as reflected by their dynamometer-measured muscle strength and BBS scores.
When comparing the performance on the 400mW of the LDCW between groups in the current study, the stroke survivors (mean 541.28 s (SD 243.74)) took 1.6 times longer than the healthy older adults (mean 333.61 s (SD 51.43)). As a long walking distance further challenges the balance and leg muscle endurance of stroke survivors (20), the poorer walking endurance was expected. Regarding the performance of the healthy subjects in the 400mW, the time in the current study (mean 333.61 S (SD 51.43)) was comparable to that in Georgiopoulou’s study (mean 331 s (SD 61)) (38), which could be explained by the reasons mentioned above concerning the 2MW.
Correlations with physical impairment
Significantly moderate to good correlations were found between the FMA-LE results and most items of the LDCW (2MW time: r = –0.631, p = 0.001; 2MW distance: r = 0.595, p = 0.002; 400mW time: r = –0.519, p = 0.008). The FMA-LE evaluates leg reflexes, movement, and coordination impairment (12). The neural control reflected by the FMA-LE affects postural timing and muscle patterns, such as hip extension and ankle dorsiflexion, which are necessary for step quality and, hence, walking. It is reasonable that better performance on the FMA-LE would coincide with a better walking performance on the LDCW.
The strength of the affected ankle dorsiflexors and plantarflexors, as measured with a dynamometer, was not correlated with the LDCW performance. This diverged from the expectations of the current study. The plantarflexors generate most of the push-off energy during the gait cycle, so their strength is expected to correlate with walking speed. Stronger dorsiflexors that help reduce foot drop are associated with walking endurance in stroke survivors who have spastic plantarflexors. Measurements of isometric muscle power in selective muscle groups could explain the current results, because walking requires comprehensive dynamic strength and endurance of the leg muscles. The leg muscle strength measured in a supine position in the current study may not apply to the LDCW, during which subjects are in an upright posture. The difference between open and closed kinetic chains also contributes to the lack of significance of the findings.
Significantly moderate to good correlations were found between the LDCW results and the BBS scores (2MW time: r:–0.568, p = 0.003; 2MW step count: r: –0.538, p = 0.006; 2MW distance: r: 0.578, p = 0.002; 400mW time: r: –0.595, p = 0.002). This could be explained by the close resemblance between the 2 tests, such as the assessment of standing unsupported and turning 360° in BBS.
No significant correlations were found between the LDCW results and the composite scores for movement velocity in the LOS test. Although both tests reflect balance performance, they evaluate different aspects of balance. LOS assessment requires subjects to shift the COP during a double-limb supported state. Walking, however, involves shifting the COP during the single-limb stance phase (17). The LDCW, in which subjects are required to walk a long distance that simulates everyday walking, challenges subjects’ dynamic balance, whereas LOS only measures static balance in a laboratory setting.
Correlations with motor function
The LDCW results showed significant good to excellent correlations with the scores in the TUG test (2MW time: r = 0.832, p < 0.001; 2MW step count: r = 0.756, p < 0.001; 2MW distance: r = –0.836, p < 0.001; 400mW time: r = 0.810, p < 0.001) and moderate to excellent correlations with the NCWT (2MW time: r = 0.794, p < 0.001; 2MW step count: r = 0.694, p = 0.001; 2MW distance: r = –0.786, p < 0.001; 400mW time: r = 0.767, p < 0.001). These significant results could be due to similarities among the tests, such as the assessment of walking and turning in TUG and balance in NCWT.
Correlations with community integration
Contrary to our expectations, no correlations were found between the LDCW results and the CIM scores. The CIM score is a subjective measurement of community integration, whereas the LDCW reflects objective walking ability; thus, the 2 tests measure different domains. The CIM focuses on subjects’ self-reported subjective feelings, as revealed by items such as “I feel like part of the community” (20). The LDCW emphasizes objective measurements of physical ability conducted in a laboratory instead of reflecting the subjective feelings of subjects in a real-life situation.
Optimal cut-offs
The LDCW results are found to be sensitive (72–84%) in separating stroke survivors from healthy older adults with an AUC of 0.837–0.885, which signifies an 83.7–88.5% probability of correctly discriminating stroke survivors from healthy older adults.
Study limitations
This study has several limitations. Firstly, the sample size was barely large enough to detect the significance of the reliability of the LDCW. The results of the ROC curves and the concurrent validity of the LDCW must be interpreted with caution due to the relatively small sample size. Secondly, the subjects were community-dwelling ambulatory stroke survivors and the majority of them were women with history of haemorrhagic stroke. Thus, the generalizability of the results is limited to the population meeting our selection criteria. Thirdly, the MDC reported in this study could only represent the change in scores on the LDCW not due to random error. It does not approximate the minimal important difference that represents a clinically noticeable change. Finally, although subjects in the stroke survivor group in the current study were younger than the healthy subjects, the majority of the stroke survivor group were women. Compared with men, women tend to be more disabled and there were sex differences in muscle strength and step length that could influence walking capacity. These age and sex differences may have also affected the findings of this study.
Thirdly, because women tend to be more disabled after a stroke and have a higher lifetime risk of stroke at all ages (40), the uneven male-female ratios in the stroke group (19:6) and healthy group (9:16) may have affected the results of the current study.
Conclusion
The LDCW is a reliable and valid clinical tool for the assessment of advanced walking capacity in stroke survivors. Given that the LDCW aims to measure the walking endurance at self-paced walking speed, it can help to reflect the maximal walking capacity of stroke survivors in the community setting. Moreover, the LDCW is easy-to-administer and requires minimal equipment. It is a convenient and feasible tool to provide clinically relevant information for rehabilitation programmes aiming at the ultimate goal of stroke rehabilitation: community reintegration.
The authors would like to thank all of the study’s participants, and to thank Mr Pei-Ming Chen and Ms Carrie Wong for their assistance in data collection. This study was supported by the General Research Fund (Ref: 15101217) from the Research Grants Council, Hong Kong, to Professor Shamay Ng and her team.
The authors have no conflicts of interest to declare.


 Click to show fullsize
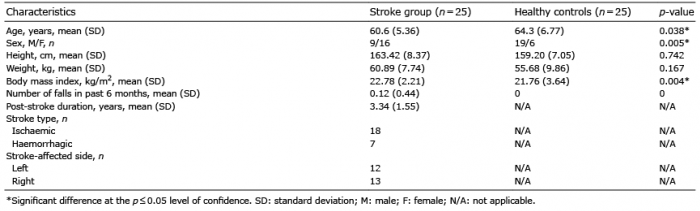 Click to show fullsize
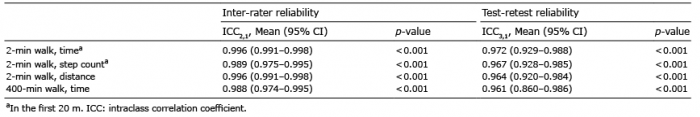 Click to show fullsize
 Click to show fullsize
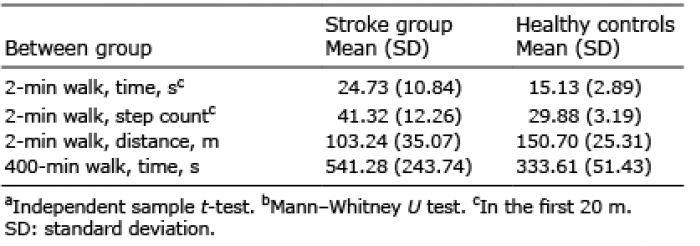 Click to show fullsize
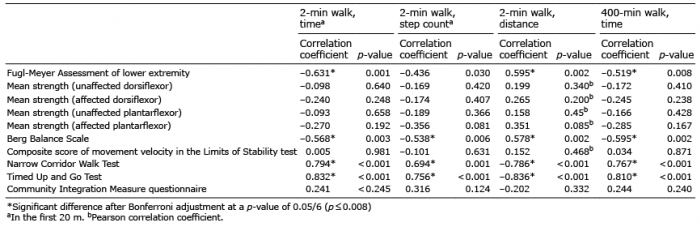 Click to show fullsize
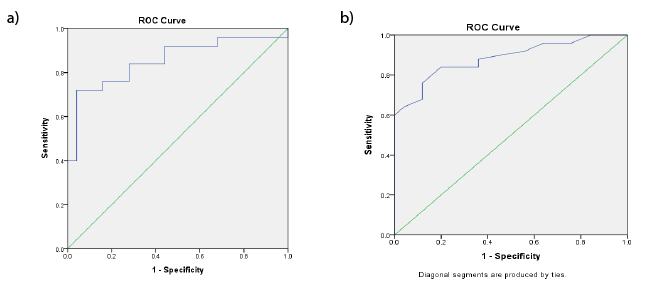 Click to show fullsize
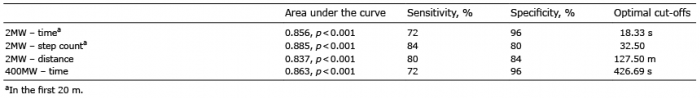 Click to show fullsize