Thibault Warlop, MD1,2, Christine Detrembleur, PT, PhD1,3, Benjamin Bollens, MD, PhD2, Gaëtan Stoquart, MD, PhD1–3, Frédéric Crevecoeur, Ir, PhD4,5, Anne Jeanjean, MD, PhD4,6 and Thierry Lejeune, MD, PhD1–3
From the 1Université catholique de Louvain, Secteur des Sciences de la Santé, Institut de Recherche Expérimentale et Clinique, Computer Assisted Robotic Surgery (CARS), 2Cliniques universitaires Saint-Luc, Service de médecine physique et réadaptation, 3Université catholique de Louvain, Louvain Bionics, Brussels, 4Université catholique de Louvain, Secteur des Sciences de la Santé, Institute of Neurosciences (IoNS), System & Cognition (COSY) 5Université catholique de Louvain, Institute of Information and Communication Technologies, Electronics and Applied Mathematics (ICTEAM), Louvain-la-Neuve and 6Cliniques universitaires Saint-Luc, Service de neurologie, Brussels, Belgium
OBJECTIVE: Gait instability and fall risk are major concerns in Parkinson’s disease. This study shows that the temporal organization of gait variability can represent a marker of gait instability that complements standard assessment of motor deficits in Parkinson’s disease.
METHODS: Temporal organization (long-range autocorrelation; LRA) of stride duration variability, collected from 20 persons with Parkinson’s disease walking overground at a comfortable speed, was studied. The presence of LRA was based on the scaling properties of the series variability and the shape of the power spectral density. Simultaneously, measures of neurological impairment (MDS-UPDRS), balance (BESTest), and balance confidence (ABC-Scale) were collected. To precisely identify the relationship between LRA and functional measures, correlation coefficients were applied.
RESULTS: Degradation of LRA was strongly correlated with other clinical scores, in such a way that the temporal organization of gait variability was more random for patients presenting with greater motor impairments. Importantly, these measures were relatively independent of age, and gait speed, thus they can be applied to a wide clinical population.
CONCLUSION: The findings of this study emphasize that temporal organization of gait variability is related to degree of functional impairment in Parkinson’s disease. LRA may thus be regarded as an objective and quantitative measure of gait stability for both clinical practice and research.
Key words: Parkinson’s disease; balance; fall risk; gait variability; non-linear dynamics; fractal; biomarker.
J Rehabil Med 2016; 00: 00–00
Correspondence address: Lejeune Thierry, Physical and Rehabilitation Medicine Department, Cliniques universitaires Saint-Luc, Avenue Hippocrate no. 10, BE-1200 Brussels, Belgium. E-mail: thierry.lejeune@uclouvain.be
Accepted Aug 29, 2016; Epub ahead of print Oct 13, 2016
INTRODUCTION
In addition to reduced gait speed, shorter stride length, stooped posture, and reduced arm swing, typical gait disorders in Parkinson’s disease (PD) are characterized by postural and gait instability, which can lead to increased fall risk (1). Thus, the detection of specific markers of gait instability appears to be critical for preventing falls and their consequences.
Gait stability has been defined as “the ability to maintain functional locomotion despite the presence of external disturbances or internal control errors” (2), and a higher fall risk has typically been associated with a lack of adaptive gait control in the presence of sensorimotor variability or external disturbances (3).
While falls generally occur during locomotion, gait variables from standard 3-dimensional quantified walking analyses would not constitute adequate predictors of falls (4). In addition, there is no accepted quantitative way to assess gait stability (5). However, stride duration variability has been mentioned as a good candidate from which to derive markers of gait instability, as it is tightly linked to rhythm control, which is particularly impaired in PD (6). Increasing number of studies have shown that human movement variability is not simply the signature of random noise, but contains hidden temporal organization that may provide insight into the neurophysiological organization of locomotion and into the regulation of the interacting subsystems, constituting the locomotor system (7).
Stride duration variability can be investigated either in terms of magnitude, using standard metrics, such as sample mean, standard deviation (SD) and coefficient of variation (CV), or in terms of its organization, which provides complementary information about how stride duration evolves with time across consecutive strides. Temporal organization of variability can be quantified using non-linear analysis to determine the evolution of a behaviour over time. Indeed, stride duration fluctuates in a structured, complex manner over the long term, displaying the presence of long-range autocorrelations (LRA) that can span hundreds of consecutive strides (8, 9). LRA result from the “memory” of the preceding values in the series, highlighting the existence of a complex temporal structure in human locomotion that is maintained across distinct tasks and even effectors (e.g. locomotion, cycling, eye-movements or upper-limb rhythmic movements) (9–12).
Interestingly, previous studies claimed that LRA would represent the signature of adaptive abilities of healthy systems and their breakdown an index of pathological condition (13–15). From a theoretical point of view, Stergiou et al. proposed that deviations from an optimal level of variability in either the direction of randomness or the over-regularity indicate the loss of the adaptive capabilities of the system and are associated with poor health (14, 15). Such adaptability is permitted by a structured optimal level of variability, which provides a wide variety of responses to any perturbations (motor redundancy) (14, 15). A tight link between LRA and the capability of physiological systems to make flexible adaptations to everyday stresses placed on the human body is thus suggested (15).
By extension, the degradation of LRA with pathology was associated with dynamic instability in locomotion (15–17). In the specific context of basal ganglia disorders, strong correlation between the temporal organization of the stride duration variability and Huntington’s disease severity was demonstrated by Hausdorff et al. (18). In addition, Ota et al. studied the interaction between neural rhythm generation disorders and physical abilities in PD, respectively assessed by the stride duration variability and the pull test (16). However, this study presents some specific methodological limitations. On the one hand, Ota et al. collected a mean number of stride intervals of 154 strides (SD 23), which appears too short to draw reliable conclusions (16). Indeed, a series length of 256 gait cycles, or, preferably, of 512, is needed to appropriately assess LRA characteristics (11, 19). On the other hand, the pull test permits the assessment of only one aspect of the balance disorders spectrum. Therefore, to our knowledge, no studies have included sound analysis of LRA in an extensive functional assessment of PD.
Considering gait instability and temporal gait disorders in PD, we hypothesized that stride duration variability will be less structured (i.e. more random) in PD and will be correlated with their functional assessment. More precisely, a poorer level of balance (Balance Evaluation Systems Test (BESTest)) and a more pronounced disease severity (modified Hoehn & Yahr scale; H&Y scale) is hypothesized to be associated with a more random gait pattern (i.e. lower LRA exponents). Complementary to the standard, validated battery of clinical tests, LRA is finally hypothesized as an objective and quantitative measure of gait stability in patients with PD.
METHODS
Participants
A total of 20 patients (11 males/9 females) with PD, aged 45–82 years (mean 65.3, SD 9.6 years) participated in the study (Table I). The diagnosis of PD was made by an experienced neurologist (AJ) according to the criteria of the UK Parkinson’s Disease Society Brain Bank (20). Medication was stable for the 4 weeks preceding the study, and was maintained throughout the study. All patients were able to walk for 10 min without walking aids. Inclusion criteria were: a minimum of 24/30 on the Mini-Mental State Examination (MMSE) (21), and patients had to be free from any muscular, neurological (other than PD) or orthopaedic pathologies that could alter gait performance. The study was approved by the local ethics committee (Clinical Trial registration: NCT02419768). Participants were informed about the experimental protocol and provided written consent prior to data collection.
|
Table I. Characteristics of the study population (n=20) |
|
|
Characteristics |
|
|
Age, years, mean (SD) |
65.3 (9.6) |
|
Gender, male/female, n |
11/9 |
|
Height, cm, mean (SD) |
170.3 (9.7) |
|
Weight, kg, mean (SD) |
74.0 (17.1) |
|
Time since the diagnosis, years, mean (SD) |
5.4 (5.3) |
|
MMSE score, mean (SD) |
28.7 (1.6) |
|
Hoehn & Yahr scale |
|
|
1, n |
3 |
|
1.5, n |
3 |
|
2, n |
5 |
|
2.5, n |
6 |
|
3, n |
3 |
|
Median [range] |
2 [1–3] |
|
MDS-UPDRS total (/260), median [range] |
51 [18–133] |
|
MDS-UPDRS III (/132), median [range] |
26.2 [9–66] |
|
BESTest total, %, mean (SD) |
77.8 (10.5) |
|
ABC-Scale, %, mean (SD) |
78.7 (12.2) |
|
Number of falls, mean (SD) |
0.4 (1.0) |
|
Walking speed, m/s, mean (SD) |
1.15 (0.16) |
|
H exponent, mean (SD) |
0.70 (0.09) |
|
α exponent, mean (SD) |
0.46 (0.15) |
|
d, mean (SD) |
0.03 (0.03) |
|
CV stride duration, %, mean (SD) |
2.75 (1.28) |
|
MDS-UPDRS: Movement Disorder Society - Unified Parkinson’s Disease Rating Scale; BESTest: Balance Evaluation Systems Test; ABC: Activities-specific Balance Confidence; CV: coefficient of variation. |
|
Apparatus and procedure
A unidimensional accelerometer was taped in the antero-posterior direction on the lateral malleolus of the most affected side. Acceleration data were recorded at 512 Hz using the Vitaport 3 ambulatory recorder (Temec Instruments BV, Kerkrade, The Netherlands), and were later transferred to a computer. Stride duration was determined from the peak of acceleration, which was detected by software and confirmed visually (Fig. 1). Accelerometer data were collected during a 10-min walking session that consisted of walking overground at a self-selected speed around a 42-m oval indoor track. The walking session was performed in a quiet environment, without any additional tasks, in order to not increase the attentional cost of walking. To familiarize themselves with the track and the maintenance of a self-selected speed, subjects completed a single-lap warm-up immediately before data acquisition. Speed steadiness was verified using a stopwatch (Polar® RCX3), which was worn by the evaluator to avoid any visual feedback to the subject and an accelerometer (Polar® S3) placed on the shoelaces of the subject’s most affected side. To avoid any perturbations, instructions to maintain walking speed were delivered only when the walking speed shifted by 10% or more of its mean value. All patients took at least 512 consecutive strides without the use of walking aids. Such a series length is required to adequately apply the LRA mathematical methods described below (11).
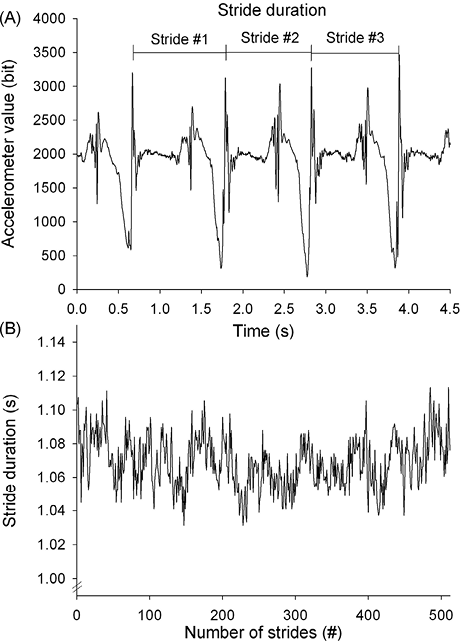
Fig. 1. Stride duration determination. (A) Example of accelerometer data over time. (B) Typical trace of stride duration over 512 strides. The stride duration, corresponding to the time between each acceleration peak, is automatically computed to determine the stride duration fluctuations over the whole walking trial.
All patients were tested when medication provided significant functional improvement (ON phase), 60–120 min after their last medication intake. For all subjects, the same medical doctor (TW) assessed the severity of PD (modified H&Y scale), the patient’s functional status (Movement Disorder Society - Unified Parkinson´s Disease Rating Scale (MDS-UPDRS)), and the subjects’ performance on a balance test (BESTest) (22); administered the Activities Balance Confidence questionnaire (Activities-specific Balance Confidence (ABC-Scale)), assessing the fear of falling (23); and asked the subjects how many times they had fallen in the previous 6 months. Note that a value of 69% is suggested as a cut-off score to discriminate fallers from non-fallers on both BESTest (22) and ABC-Scale (23).
Assessment of temporal organization of stride duration variability (LRA)
The presence of LRA was assessed using the integrated approach proposed by Rangarajan & Ding, validated in the context of a physiological time series and described in details by Crevecoeur et al. (11, 24) The method consists of estimating 2 parameters related to the autocorrelation function of the series under investigation: the Hurst exponent (H), using the Rescaled Range Analysis (RRA), and the slope of the power spectral density (PSD), plotted on a logarithmic scale (α).
In theory, the exponents H and α are asymptotically related by the equation:  (1)
(1)
Therefore, the integrated approach consists of separately computing H and α and using Eqn. (1) to verify that these 2 parameters are in agreement. The inconsistency associated with equation (1) can be defined as  . Our previous reports indicated that a value of d ≤ 0.10 can be considered acceptable because the asymptotic parameters are evaluated on a finite time series (11).
In summary, the following 3 conditions must be satisfied to conclude the presence of LRA:
Assessment of magnitude of stride duration variability (CV stride duration)
For each subject’s time series, the mean stride duration (and SD) and the CV stride duration (100×SD/mean) were calculated in a series of 512 consecutive strides.
Statistical analysis
A sample size estimation was performed based on the previous results of Hausdorff et al. collected from a similar study conducted on Huntington’s patients (18). By hypothesizing a significant correlation with a minimal correlation coefficient (r) of 0.6 and a 2-sided α of 0.05, a sample size of n = 20 was needed to obtain a power of 80%. To address the relationship between stride duration variability and functional assessment in depth, the strength and direction of that relationship were assessed using Spearman’s correlation coefficients. Correlation coefficient values of 0.00–0.25 indicate little to no relationship; 0.25–0.50, fair correlation; 0.50–0.75, moderate correlation, and 0.75–1.00, high correlation (22). Level of statistical significance was set at a p-value < 0.05. For all statistical analyses, SigmaStat 3.5 software (Systat, Richmond, CA, USA) was used.
RESULTS
Patient characteristics
Table I summarizes the anthropometric and clinical characteristics of the study population. Patients were moderately impaired, with a median H&Y stage of 2 (range 1–3), confirming that they were physically independent, and a median MDS-UPDRS of 51 (range 18–133). ABC-Scale and BESTest scores were higher than the cut-off score of 69%, indicating that “non-fallers” patients essentially constitute our population. Two patients had motor complications (1 freezing of gait and 1 dyskinesia of the upper limb). However, neither patient presented such complications during the walking trial.
Long-range autocorrelation and coefficient of variation of stride duration in Parkinson’s disease gait
Typical time series of PD and their modulation with disease severity, CV stride duration and LRA are shown in Fig. 2. Table II shows a slow decrease in H and a exponents and a trend towards an increase in CV stride duration with disease progression.
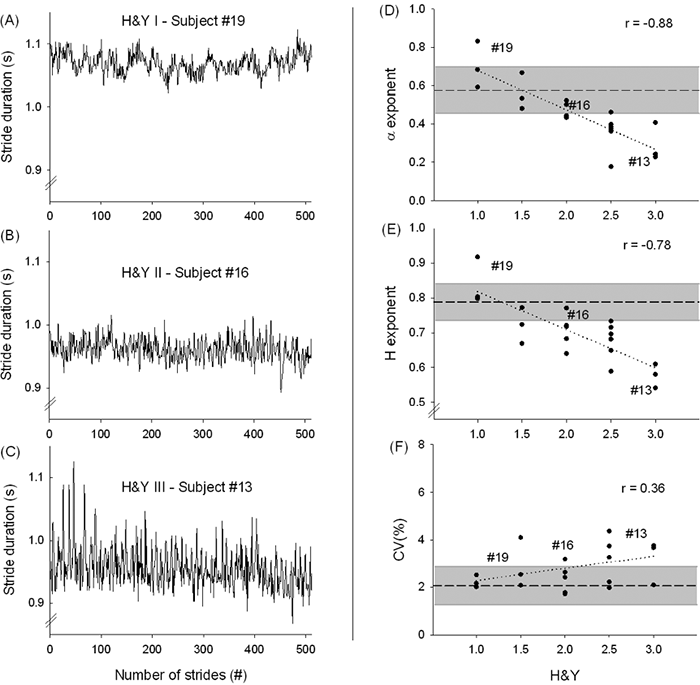
Fig. 2. Typical traces. Selected typical traces of stride duration variability of patients with Parkinson’s disease (PD) according to disease severity (Hoehn & Yahr scale; H&Y scale) (A–C). On the right side, the evolution of individual values of the α and Hurst exponents (D–E) and coefficient of variation (CV) of stride duration (F) with disease severity. Grey area indicates values from normative data set of healthy subjects (9, 27). r = Spearman’s correlation coefficient.
|
Table II. Progression of gait variability measures with disease severity |
|||
|
H&Y |
Gait variability measures |
||
|
H exponent |
α exponent |
CV (%) |
|
|
1 |
0.84 (0.06) |
0.70 (0.12) |
2.0 (0.5) |
|
1.5 |
0.72 (0.05) |
0.56 (0.09) |
2.5 (1.4) |
|
2 |
0.70 (0.05) |
0.47 (0.05) |
2.3 (0.5) |
|
2.5 |
0.67 (0.05) |
0.36 (0.09) |
2.9 (0.8) |
|
3 |
0.58 (0.03) |
0.29 (0.10) |
4.2 (2.4) |
|
H&Y: Hoehn & Yahr scale; CV: coefficient of variation; SD: standard deviation. |
|||
For all patients, the H exponent had a value between 0.5 and 1 (mean 0.70, SD 0.09), the α exponent was significantly different from 0 (mean 0.46, SD 0.15) and the value of d was also lower than the pre-specified limit of 0.10 for all patients (mean 0.03, SD 0.03). These results clearly support the presence of LRA in all time series (11). However, the LRA characteristics are modulated by the disease severity and balance status.
Concerning standard metrics, the CV of stride duration for the 20 patients were 2.75% (SD 1.28).
Study of stride duration variability correlations with disease severity and balance status
To explore relationships among stride duration variability, balance and functional status in more detail, the Spearman’s correlation coefficients are used and presented in Fig. 2 and Table III. The α exponent was highly correlated with the Hurst exponent, the H&Y scale, and the BESTest, moderately correlated with the MDS-UPDRS III and fairly correlated with the ABC-Scale. The Hurst exponent was highly correlated with the H&Y scale and moderately correlated with the BESTest and the MDS-UPDRS III. Concerning the magnitude of stride duration variability, the CV stride duration was moderately correlated with the gait speed and the ABC-Scale.
|
Table III. Correlations study between stride duration variability, disease severity, balance status, gait speed and age |
|||||||||
|
CV |
α exponent |
H exponent |
ABC-Scale |
BESTest |
MDS-UPDRS |
H&Y |
Gait |
Age |
|
|
Age |
–0.185 |
–0.005 |
0.067 |
0.029 |
–0.050 |
–0.307 |
0.026 |
–0.170 |
1.000 |
|
Gait speed |
–0.504* |
0.232 |
0.132 |
0.378 |
0.403 |
–0.343 |
–0.377 |
1.000 |
|
|
H&Y scale |
0.363 |
–0.883*** |
–0.779*** |
–0.639** |
–0.899*** |
0.821*** |
1.000 |
||
|
MDS-UPDRS III |
0.436 |
–0.581** |
–0.573* |
–0.630** |
–0.732*** |
1.000 |
|||
|
BESTest |
–0.383 |
0.886*** |
0.692*** |
0.638** |
1.000 |
||||
|
ABC-Scale |
–0.542* |
0.490* |
0.379 |
1.000 |
|||||
|
H exponent |
–0.435 |
0.894*** |
1.000 |
||||||
|
α exponent |
–0.320 |
1.000 |
|||||||
|
CV |
1.000 |
||||||||
|
*p ≤ 0.05; **p ≤ 0.01;***p ≤ 0.001. CV: coefficient of variation; ABC: Activities Balance Confidence questionnaire; BESTest: Balance test; MDS-UPDRS III: Movement Disorder Society - Unified Parkinson´s Disease Rating Scale; H&Y: Hoehn & Yahr scale. |
|||||||||
DISCUSSION
This is the first study to assess LRA in relation to the functional assessment of people with PD. Our main findings are: (i) highlighting the strong correlations of LRA with clinical measures of the patient’s balance and functional status; (ii) determining the absence of age and walking speed influence on parkinsonian gait autocorrelation; and (iii) determining the relationship between usual measures of variability (CV) and the subjective fear of falling.
The usefulness of clinical tests and questionnaires has been demonstrated in the assessment of fall risk (25). However, gait and balance impairments are sometimes quite subtle and their evaluation can be impaired by personal interpretation. By contrast, parameters collected from instrumented gait analysis provide complementary quantitative and objective information. In this way, inertia-based motion analysis (e.g. accelerometers) is a new outcome assessment tool that can produce objective movement parameters while being fast, economical and easy to use (26).
Devoid of any subjectivity, LRA could thus yield not only an objective and quantitative insight about the temporal complexity of the gait, but also a clinical measure of gait stability in people with PD. The original finding of the present study was indeed to highlight the strong relationships among LRA, balance and functional status. Indeed, following the results of correlation coefficients, the Hurst and α exponents were positively correlated with the BESTest and negatively correlated with disease severity (H&Y scale) and the motor part of the MDS-UPDRS. In such a way, a poorer level of balance (BESTest), a more pronounced disease severity (H&Y scale) are associated with lower Hurst and α exponents, indicative of a more random (less structured) walking pattern. Indeed, the closer the Hurst exponent is to 0.5 and the α exponent to 0, the more random the walking pattern where the stride duration at one moment is completely uncorrelated with any previous strides.
The increased randomness of parkinsonian gait pattern with disease severity contrasts with the structured gait pattern of healthy adults (mean H exponent = 0.79 and mean a exponent = 0.58 computed in previous studies (9, 27); Fig. 2) and could result from the defective activity among interacting subcomponents (e.g. basal ganglia). LRA are indeed thought as the result of subtle and complex interactions between subcomponents constituting dynamic systems.
In the specific context of basal ganglia disorders, Hausdorff et al. have already highlighted, in a similar way, such a breakdown of LRA and their strong correlations with neurological impairments in people with Huntington’s disease (18). In PD, Ota et al. (16) suggested that patients would firstly progress according to an increase in CV stride duration, and secondarily to a decrease in LRA. However, this latter study presents some methodological issue regarding the number of gait cycles collected. Indeed, the mean number of stride intervals of 154 (SD 23) strides collected in this study appears to be too low to generate reliable conclusions concerning the temporal organization of the stride duration variability (19, 28).
In accordance with recent studies, strong correlations between the balance test (BESTest), disease severity (H&Y) and functional status (MDS-UPDRS) have also been demonstrated (22, 25). Thus, at more advanced stages of PD, functional impairment is higher and balance performance is lower. Evidence suggests that, with disease severity, people with PD present less adaptive abilities and thus could be more prone to falls (29).
In contrast to balance and functional status, LRA were relatively independent of age and walking speed. This finding extends to PD, an observation that was already demonstrated in healthy adults, in elderly persons, and in the specific context of basal ganglia dysfunction with Huntington disease (18, 30). Often perceived as a cautious walking strategy, reduced gait speed is usually associated with an increase in SD and CV stride duration (31, 32).
Gait speed was related to such standard metrics. Evidence suggests that the influence of gait speed on CV stride duration depends on the level of gait speed (30, 32). However, a significant association with high CV stride duration was demonstrated at low speeds (i.e. 0.2 to 0.6 m/s) compared with speeds of 0.8–1.4 m/s (32). In addition, a gait speed of 1.15 m/s reported in our study population is close to the walking speed of 1.1 m/s required to safely cross the street within the time limit of traffic signals in a community (32). This confirms the functional abilities of the studied population, but the attentional load required while walking could explain such relationship.
Although CV stride duration in PD was neither associated with LRA, nor functional status, nor balance performance, CV stride duration war inversely correlated with the patient’s fear of falling, as quantified by the ABC-Scale. In terms of motor control, lower CV values reflect the reliability of lower limb movements and the automated regular rhythmic feature of gait (33). Such automatic processes require minimal attention, whereas higher variability is related to major attention involvement (32). In addition, evidence suggests that automatic gait control is reduced in people with PD and more conscious attention is required (34, 35). Thus, complementary to LRA, the correlation between the subjective fear of falling and CV stride duration may be a marker of the impairment of higher levels of gait control.
Taken together with standard clinical tests, magnitude (CV) and organization (LRA) of stride duration variability allow for a comprehensive description of balance control during walking, with the ability to describe specific deficits. LRA could be considered as a reflection of gait stability and CV stride duration as a marker of the degree of automaticity of gait, reflected by the attentional load required while walking. However, poor balance control may occur when one or more components are compromised, such as the loss of flexibility or an increased fear of falling. Balance control is usually conceived as a complex system with many elements (e.g. motor cortex, basal ganglia, cerebellum, cortico-spinal tract, peripheral nerves, muscles, osteo-articular structures) that interact permanently to produce a stable gait pattern and prevent falls (8).
Balance is multifactorial and depends on both physical (balance, flexibility, strength) and psychological (fear of falling, cognitive disorders) features. Based on the BESTest and ABC-Scale, predictive values of falls might be made to discriminate fallers from non-fallers in PD (25). Although a fall is the ultimate marker of a higher fall risk, it is clearly desirable to prevent falls and, therefore, derive markers of gait instability prior to actual falls. To this end, LRA is a good candidate to derive an objective and quantitative gait stability assessment in the mild to moderately impaired PD population.
Furthermore, using accelerometers, LRA could be routinely assessed in clinical practice simultaneously with spatiotemporal parameters, such as gait speed, cadence or step length. Equipped with an accelerometer, current smartphones are, in principle, able to perform such assessments, as well as to detect freezing of gait epochs, and to release suitable cues every time freezing of gait occurs during the patient’s daily activities (26, 36, 37).
Some limitations to this study should be noticed. Instructions used to maintain the stationarity of the time series could alter the stride duration dynamics (12, 17, 38). However, only one patient had to receive such specific instruction during the walking session. In addition, the explicit instructions used in the previous studies were delivered continuously during the whole walking session, while our instruction was delivered once and for a limited period of several seconds. In the same vein, it is now clearly established that gait represents an attention-demanding task in PD. Specific attention was paid on the walking session to reduce the attentional cost of gait and ensure neutral condition. The walking session was thus performed in a quiet and wide environment with no additional tasks.
Although the resulting findings will be important for generation of future hypotheses, it would be interesting to confirm the results of this study with a larger population. Also, the strong correlations highlighted in mildly to moderately impaired patients with PD should be carefully extended to the most impaired patients with PD (i.e. beyond H&Y III). Indeed, LRA assessment typically requires a large number of cycles to generate reliable results, which may be difficult to obtain from the most impaired patients with PD (11, 19). However, to be useful in assessment of fall risk, LRA should be assessed when the gait instability is not yet clinically evident and the patient is still functionally independent. Hence, a collection of 512 gait cycles should be not a major constraint in future prospective and longitudinal studies. Moreover, owing to the specific advantages of inertia-based motion devices, LRA could easily be assessed in daily clinical practice and collected to constitute a significant database.
In conclusion, the present study demonstrated that, using a wearable and inexpensive device, the analysis of both the magnitude and organization of stride duration variability could provide an objective and quantitative clinical measure of gait stability in people with PD for clinical practice and research.
ACKNOWLEDGEMENTS
The authors would like to acknowledge all of the subjects who participated in this study.
This project was supported by research grant from the Fondation Saint-Luc (Cliniques universitaires Saint-Luc – Brussels). TW is a research assistant supported by a grant from the Fonds National de la Recherche Scientifique (FRIA – FNRS). FC is a postdoctoral fellow supported by the Fonds National de la Recherche Scientifique (FNRS).
The authors declare no conflicts of interest.
REFERENCES

