Fary Khan, MBBS, MD, FAFRM (RACP)1,2,3*, Bhasker Amatya, MD, MPH1, Alaeldin Elmalik, MBBS, FAFRM (RACP)1, Matthew Lowe, RN1, Louisa Ng, MBBS, MD, FAFRM (RACP)1,2, Isabella Reid, BBiomedSc, MD1,2 and Mary P. Galea, PhD, BAppSci (Physio), BA, GradDipPhysio, Grad Dip Neurosci1,2
From the 1Department of Rehabilitation Medicine, Royal Melbourne Hospital, Parkville, 2Department of Medicine (Royal Melbourne Hospital), University of Melbourne, Parkville, and 3School of Public Health and Preventive Medicine, Monash University, Victoria, Australia
OBJECTIVE: To assess the effectiveness of an enriched environmental activities programme in an inpatient tertiary neuro-rehabilitation unit.
METHODS: A total of 103 participants were randomized to an intervention group (n = 52) undertaking an enriched environmental activities programme or a control group (n = 51) receiving usual ward activity. Primary outcome measure: Depression, Anxiety Stress Scale (DASS). Other measures included: Neurological Impairment Scale; Multidimensional Health Locus of Control, Rosenberg Self-Esteem Scale, Montreal Cognitive Assessment (MoCA); Functional Independence Measure (FIM), and Euro-Quality of Life-5D. Questionnaire assessments were performed at admission, discharge and 3-months post-discharge.
RESULTS: Mean age of subjects was 62.5 years (standard deviation 18.5), 63% were male; 53 had stroke and the remainder had other neurological conditions. Compared with controls, the intervention group showed significant improvement at discharge in: DASS: “total”, “depression”, and “stress” subscales (p < 0.05 for all, with small effect sizes (η2) = 0.04–0.05); MoCA (p = 0.048, η2 = 0.04) and FIM motor (total and “self-care”, “mobility” subscales (p < 0.05 for all, with moderate effect sizes, η2 = 0.0–0.08). At 3-month follow-up, significant differences were maintained in most secondary outcomes in the intervention group. Cognitive function and activities improved most in participants with stroke.
CONCLUSION: An enriched environmental programme can produce significant improvements in functional and cognitive ability in inpatient neurological cohorts compared with routine ward activity programmes.
Key words: enriched environment; rehabilitation; disability; participation; impairment; patient outcome.
J Rehabil Med 2016; 48: 00–00
Correspondence address: Fary Khan, Department of Rehabilitation Medicine, Royal Melbourne Hospital, 34-54 Poplar Road, Parkville, Victoria 3052, Australia. E-mail: fary.khan@mh.org.au
Accepted Feb 10, 2016; Epub ahead of print Apr 5, 2016
INTRODUCTION
Neurological disorders affect one billion people worldwide and constitute 6.3% of the global burden of disease (1). In Australia (in 2010), these disorders have the third greatest disease burden, estimated at 380,000 Disability-Adjusted Life Years (DALYs) (2). Neurological conditions are complex and a significant source of functional and psychosocial limitations (e.g. in mobility, and activities of daily living), and require specific management (e.g. spasticity, pain, behavioural, bladder/bowel regimens) and integrated interdisciplinary care (3–5).
Evidence suggests that inpatients in rehabilitation wards, apart from their scheduled therapy sessions, spend most of their waking hours physically inactive and relatively isolated (6–8). The amount of practice of functional and cognitive activities therefore needs to be increased to promote “neuroplastic” recovery processes and maximize the inpatient rehabilitation experience (9). Previous studies in stroke survivors demonstrated that engagement in higher levels of therapeutically-based physical activity is associated with better physical function (10, 11) and greater independence (12). Likewise, engagement in cognitive or social activities enhanced cognitive recovery and improved mood-related disorders, such as depressive symptoms (13, 14). Furthermore, a lack of environmental enrichment in patients with conditions such as traumatic brain injury (TBI) may play a role in post-acute cognitive and neural decline (15).
Environmental enrichment (EE) refers to an intervention designed to facilitate physical (motor and sensory), cognitive and social activity by provision of equipment and organization of a stimulating environment (16). The intervention is not therapist dependent and is predicated on the concept that exposure to such environments encourages patients to be more active (9). EE has been investigated extensively in animal models and shown to facilitate brain physiology and enhance recovery by triggering structural changes within the affected brain, which are significant in the process of neuroplasticity (16–18). Diamond et al. (19) showed an increase in cortical neurone size, number and length of dendrites, and number of dendritic spines in rats exposed to an EE (20). Moreover, differences were observed in cortical thickness, cortical weight, acetylcholinesterase, cholinesterase, protein and hexokinase levels. Pang & Hannan (21) demonstrated beneficial effects of EE (and exercise) in a range of animal models of brain disorders, including cognitive enhancement, delayed disease onset, enhanced cellular plasticity and associated molecular processes.
Despite a plethora of animal model data, studies exploring the effectiveness and feasibility of the equivalent human model of EE are limited. One prospective non-randomized study (n = 29) of an EE in a stroke rehabilitation unit showed significantly increased patient activity and reduced time spent alone and inactive (9). Compared with those in a non-enriched environment, the intervention group were 1.7 times more likely to be engaged in cognitive activities, 1.2 times more likely to be engaged in social activities, and 0.7 times more likely to be inactive (9). Another randomized controlled trial (n = 28) reported that 6 months of sensorimotor enrichment therapy produced significant improvements in cognition, symptom severity and quality of life (QoL) in children with autism (22). Further, studies conducted in animal models suggest that EE are also reportedly associated with improvements in physical and cognitive function in neurodegenerative and psychiatric conditions such as schizophrenia, Huntington’s, and Parkinson’s diseases (23, 24). To our knowledge, there are no RCTs to date assessing the effectiveness of an EE activities programme in an adult rehabilitation population with different neurological conditions.
The aim of this study was to conduct a RCT over 12 months, with blinded care providers and outcome assessors to compare the effectiveness of an EE activities programme with usual activities provided in an inpatient publicly-funded neuro-rehabilitation unit. We hypothesized that participants in the EE programme would show significant improvement in self-efficacy/engagement, better self-management, and improved cognitive function compared with those performing usual activities only.
METHODS
Setting
This study was part of the rehabilitation outcomes research programme and was conducted in the rehabilitation unit at the Royal Melbourne Hospital (RMH), a tertiary referral centre in Victoria, Australia. This clinical trial was registered with Melbourne Health and was approved by the Human Research Ethics Committee (MH HREC approval number: 2014.091). The rehabilitation unit at RMH has 40 medically supervised beds and an active ambulatory programme (including a community therapy service, specialist outpatient clinics and home rehabilitation services). It provides specialist rehabilitation for neurological conditions, such as stroke, multiple sclerosis (MS), Guillain-Barré Syndrome (GBS), brain tumours (BT), developmental disabilities (such as cerebral palsy (CP), spina bifida (SB), acquired brain injury (ABI), Parkinson’s disease (PD)) and others, using an integrated interdisciplinary programme. The allied health teams provide specialized input using individual and group therapies, such as progressive physical programmes to improve mobility and strength, task reacquisition programmes for adaptive techniques to improve activities of daily living, cognitive remediation, behaviour management programmes for neuropsychological sequelae, and others. As a routine practice, all inpatients are encouraged to participate in various ward-based activities in their leisure time, including access to television, music, books, board games, etc.
Participants
All patients with neurological conditions consecutively admitted to the rehabilitation ward (August 2014 to February 2015) who met the inclusion criteria were eligible to participate in the study. Patient subgroups included stroke, MS, BT, PD and others. Inclusion criteria were: age 18 years and above; stable medical course; able to communicate and understand English; ability to participate in the intervention, and provide informed consent; and the clinical judgement of the admitting rehabilitation physician that the programme would probably be beneficial to the individual. Patients were excluded if they were medically unstable, had severe cognitive deficits (e.g. post-traumatic amnesia) or unstable psychiatric issues (e.g. schizophrenia) and/or behaviour problems (e.g. agitation/aggression) or severe global communication problems that precluded participation in the programme.
All consecutive patients who fulfilled the aforementioned inclusion criteria were invited to participate in this study by an independent nurse/researcher. Participants were able to withdraw from the study at any time.
The study was approved by the Melbourne Health ethics committee and informed consent was obtained from all subjects.
Procedure
Randomization. At admission to the rehabilitation ward, all patients are routinely clinically assessed by their treating medical staff for cognitive and functional ability, specific care needs and goal-setting processes. Following these assessments, all patients were screened for their eligibility and invited to participate in the study by an independent medical practitioner. All participants were assigned a study identification number and underwent a baseline structured interview (T0) using standardized instruments (see Measures). An independent project officer used a computer-generated randomization schedule to allocate patients either to the control (routine ward activity) or treatment groups (enriched environment activities programme). The allocation sequence was concealed from the treatment teams to avoid bias. Efforts were made to ensure blinding of participants, where possible; however, this was challenging in many cases over the course of the study. Those in the control group were not disadvantaged and had access to the usual ward activity programme.
The interdisciplinary therapy teams treated all patients on the ward based on clinical need, consistent with usual practice. An independent occupational therapist and nurse were responsible for programming ward therapy timetables for participants in both groups. Usual practice in the rehabilitation unit includes “Nurse Rounding”, where the allocated nurse checks on their patients hourly, to ensure they are not in pain, that they have access to equipment, etc., and documents what the patient is doing at the time. In addition, all treating therapists provide patients with a weekly timetable for their physical, occupational or speech therapy programme, based on 30-min activity blocks. There are also designated protected meal-times for all patients on the service. All activity information was collated systematically throughout the working week using an existing log-form, nurse care plans and therapy journals. In addition, participants (and families) were asked to keep a daily-log, using therapy journals. These were collated daily by an independent research assistant on the ward.
Intervention. Participants in the intervention group were offered access to individual and/or communal EE equipment and an activities programme in a designated area; the “Activity Arcade”, commencing from Day 1 until discharge from the ward. Although the “Activity Arcade” is located close to the rehabilitation ward, it has a separate geographical location and its own lift access and entry. The interventions in the “Activity Arcade” included an additional 2-h activity session provided on weekdays (Monday to Friday), along with their daily ward activities, based on participant clinical need. Participants joined in various activities after their routine rehabilitation programme, either in the morning or afternoon EE sessions. Various enrichment activities were available for the participants to choose from (Table I). Each session was supervised daily by a trained medical or nursing staff and an allied health assistant. Each participant chose their daily activity module in 10-min blocks. These activities changed daily in complexity and task sequencing to allow exposure to a wide range of activities. All activities involved physical and cognitive exercise elements, which were initially challenging and progressed in complexity as patients made gains. Participants selected their own activity programme, which was adjusted by the programme session supervisor. An a priori level of compliance with the intervention programme was attendance for more than 80% of treatment sessions.
|
Table I. Types of enrichment activities available in the “Activity Arcade” |
|
• Computers with internet connection, Skype facility |
|
• Several workstations with computer/television based sensor and game technology for upper and lower limb exercises, such as Able-X, Able-M, Mitii, Nintendo Wii, and cognitive exercises (with assistance from a member of the rehabilitation team) |
|
• Library with reading materials (books, audio-books, magazines, newspapers etc.) |
|
• Music station |
|
• Life-size mirrors for visual-perceptive deficits |
|
• Simulated shopping corner with groceries |
|
• Electronic funds transfer at point of sale (EFTPOS) machine for making payments |
|
• Automatic bank teller machine |
|
• Board games, puzzles, chess |
|
• Painting, wood workshop and other activities |
Control group. Participants allocated to the control group participated in usual ward-based activities (such as television, radio, reading materials, Internet, Skype, games, etc.) consistent with usual practice. All assessments of the control group were completed in parallel with those of the intervention group.
Assessments. A face-to-face structured interview technique was used to conduct participant assessments using standardized instruments (see Measures section). Assessment time-points were at admission (T0), on discharge from the ward (T1) and 3 months post-discharge (by telephone) (T2). Baseline (T0) assessments were collated within 24 h of admission to the service. All outcome assessments were completed by independent assessors (3 physicians, 1 research officer) who were not part of the rehabilitation or EE “Activity Arcade” teams and were not in contact with the acute neurology or the rehabilitation treating therapy teams. These assessments took approximately 30 min. The assessors did not prompt patients, but provided assistance for those who had difficulty completing the questionnaires. The assessors were trained in cognitive and functional ability assessments and also received a further 2-day training session to ensure consistency in data collection. They did not share information about participants or assessments, and received separate case report forms at each interview. The study comprised the following phases:
• Initial assessment (at admission) (T0): included demographics (age, sex, marital status, education level, employment), disease-related characteristics (diagnosis, rehabilitation subgroup, symptoms, medications and co-morbidities) and assessment using standardized instruments (see Measures). Any patient concerns or comments were captured in an open-ended questionnaire.
• Assessment at discharge (T1): in addition to utilizing the same tools as at T0, activity logs for both groups were collated along with satisfaction with inpatient stay. Adverse events (such as falls, injury during treatment, etc.) were noted.
• Assessment at 3-months following discharge (T2): an independent blinded research officer conducted a telephone follow-up of all participants who had completed both T0 and T1 interviews. Information similar to the T1 assessment was obtained (except for NIS and MOCA, which require a face-to-face assessment). The assessor did not have access to previous assessments, treatment schedules or treating rehabilitation therapy team documentation.
All assessments were secured and filed, and opened only at the time of data entry into a special study database by an independent data-entry officer.
Measurement. The International Classification of Functioning, Disability and Health (ICF) (25) was used as a conceptual basis for choice of best outcomes for measurement for “impairment”, “activity” and “participation”.
The primary outcome measure, the Depression Anxiety Stress Scale – 21 (DASS) (26) has 3 7-item self-report subscales to measure negative emotional states of depression, anxiety and stress. Participants rated the extent to which they experienced each state over the past week on a 4-point Likert rating scale. This measure was selected as we anticipated that our EE programme would improve patient engagement and better self-management, and reduce their anxiety and stress (and indirectly depression).
The secondary outcomes included:
• Impairment: the Neurological Impairment Scale (NIS-version 8) (27), comprises 17 items (each rated 0–2 or 0–3, giving a total score range 0–50), to assess neurological impairments. It recorded severity of functional impairments across 13 domains mapped onto the ICF.
• Activity: the Multidimensional Health Locus of Control (MHLC) (28) measured personal mastery beliefs and reflects an individual’s belief about the extent to which they are able to control or influence outcomes. Form C of this scale is “condition-specific” for studying people with an existing health/medical condition.
The Rosenberg Self-Esteem Scale (RSES) (29) provided an overall evaluation of one’s worth or value (positive or negative orientation toward oneself). This Likert scale has items rated on a 4-point scale, ranging from “1 = strongly agree” to “4 = strongly disagree”.
The Functional Independence Measure (FIM) (30) has 18 categories: motor (13-items) and cognition (5 items) to assess level of function and dependency (4 subscales: Self-care, Transfers, Locomotion and Sphincter control), and cognition (3 subscales: communication, psychological and cognition). Participants rated each item on a scale of 1 to 7 (1 = total assistance, 5 = needs supervision, 6 = modified independence, 7 = independent).
• Participation and QoL. The Montreal Cognitive Assessment (MoCA) (31), a 1-page 30-point test assessed cognitive domains: short-term memory recall task, visuospatial abilities, executive function, attention, concentration, memory, language and orientation to time and place. A score of ≥ 26 indicates normal cognition.
The Euro-Quality of life (EQ-5D) (32) was used to rate 5 health dimensions: mobility, self-care, daily activity, pain/discomfort, and anxiety/depression (rated on a scale of 1 = no problems to 5 = severe or extreme problems) and a visual analogue scale (VAS) for current overall health on a scale from 0 (the worst health state they can imagine) to 100 (the best health state they can imagine). An index-based summary score for the EQ-5D was generated using a published crosswalk algorithm, which provides index-based scores ranging from –0.594 to 1.0 in the UK population, with lower values signifying worse health (33, 34).
Statistical analysis
The primary outcome for this study was defined as the impact of the EE activity programme on patient outcomes, measured by the DASS. An overall sample of 72 participants (36 participants in each arm) was needed to provide 80% power to detect a minimal clinically important difference (MCID) (35) of a change of 4 points from baseline to 3 months, between intervention and control group (2-sided α = 0.05). All analyses were completed using the IBM SPSS Statistics Package Version 21 (Chicago, IL, USA).
Data on patient demographics and disease characteristics were presented in a descriptive manner. t-tests and the χ2 test for homogeneity were used to compare baseline demographic data in participants lost to follow-up during the study period with those of the study group. The main analysis examined changes in the outcome measures over time (pre (T0) – post (T1) and pre (T0) – 3-month follow-up (T2) between the control and intervention groups, using independent-samples t-tests. Clinically important changes were estimated as effect size (eta squared “η2”), which was calculated and assessed against Cohen’s criteria (0.01 = small, 0.06 = moderate and 0.14 = large effect) (36). A p-value of < 0.05 was considered statistically significant. Analyses were on an intention-to-treat (ITT) basis, with patients assigned according to their initial allocation irrespective of their subsequent compliance to the protocol.
RESULTS
Of the 201 patients admitted to the rehabilitation unit during the study period, 145 patients with different neurological conditions were assessed for study eligibility and invited to participate. A total of 103 patients agreed to participate and provided written consent. Of these, 52 were allocated to the treatment group and 51 to the control group. Three participants each in both control (2 deceased and 1 uncontactable) and intervention (1 deceased and 2 uncontactable) groups were lost to follow-up at the 3-month follow-up assessment (T2) (Fig. 1). No participant in the control group was involved in the EE “Activity Arcade” programme during the study period. The mean duration of the enriched programme was 14 days (range 9–21 days). There was 94% compliance with treatment programme, as per the a priori compliance definition. No adverse events were reported in either group.
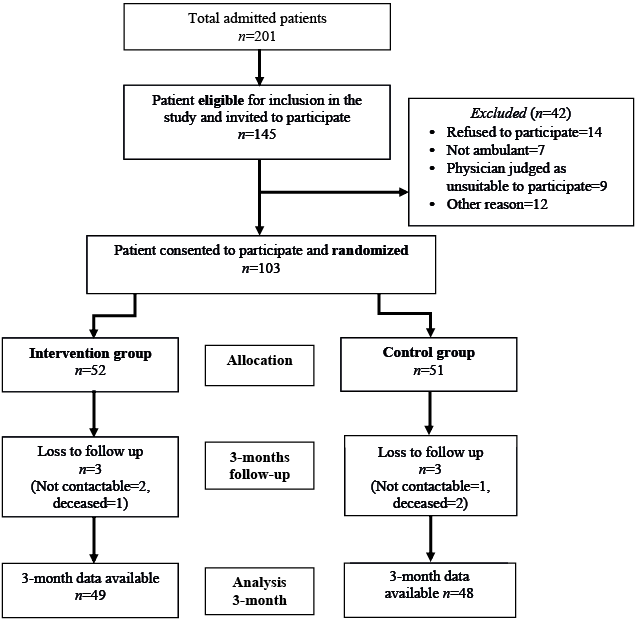
Fig. 1. Recruitment process.
Baseline characteristics
Both intervention and control groups were well-matched for demographic and clinical characteristics at baseline and are summarized in Table II. Mean age of the participants was 62.5 years (standard deviation 18.5) (range 19.9–91.8) years, the majority were male (63%) and Caucasian (84%). There were no differences between participants in the control or treatment groups in terms of sex, age, diagnosis or mean scores at baseline for the all outcome measures. However, participants in the control group had slightly longer disease duration (median = 2.3 years, interquartile range (IQR) 0.8–5.5 vs median = 1.9 years, IQR 0.8–3.8 years) compared with the treatment group; this, however, was not statistically significant. The main diagnosis of participants in both groups was stroke, with hypertension as a predominant comorbidity. Pain and cognitive issues were prevalent in both groups. Over 90% of participants in both groups were assessed as being “at risk” of falls. There was no significant difference between participants lost to follow-up and those who provided 3 months follow-up results in terms of sex, age, disease duration and median scores for measures used (Table II).
|
Table II. Socio-demographic characteristics of participants (n = 103) |
||
|
Characterisitics |
Intervention group (n = 52) |
Control group (n = 51) |
|
Demographic factors |
||
|
Age, years, mean (SD) [range] |
61.0 (18.4) [19.9–85.7] |
64.1 (18.6) [24.4–91.8] |
|
Male, n (%) |
32 (61.5) |
33 (64.7) |
|
Ethnicity: Caucasian, n (%) |
43 (82.7) |
47 (92.2) |
|
NESB, n (%) |
7 (13.5) |
8 (7.4) |
|
Living with, n (%) |
|
|
|
Alone |
18 (34.6) |
10 (19.6) |
|
Partner/family |
34 (65.4) |
38 (74.5) |
|
Education, n (%) |
|
|
|
Secondary |
29 (55.8) |
26 (51.0) |
|
Tertiary |
9 (17.3) |
11 (21.6) |
|
Employed, n (%) |
10 (19.2) |
9 (17.6) |
|
Carer, n (%) |
7 (16.7) |
10 (19.6) |
|
Clinical characterisitics |
||
|
Disease duration, years, mean (SD) |
2.4 (7.5) |
3.2 (5.7) |
|
Diagnosis, n (%) |
|
|
|
Stroke |
28 (53.8) |
25 (49.0) |
|
Multiple scerosis |
3 (5.8) |
9 (17.6) |
|
Peripheral neuropathy |
5 (9.6) |
8 (15.7) |
|
Parkinson’s disease |
4 (7.7) |
2 (3.9) |
|
Brain tumour |
4 (7.7) |
4 (7.7) |
|
Others |
8 (15.4) |
3 (9.8) |
|
Polypharmacy (on ≥ 3 medication), n (%) |
39 (75.0) |
38 (74.5) |
|
Co-morbidities, n (%) |
|
|
|
Hypertension |
44 (86.3) |
39 (83.0) |
|
Diabetes |
2 (4.3) |
2 (4.3) |
|
Depression |
4 (7.8) |
3 (6.4) |
|
Upper limb impairment, n (%) |
41 (78.8) |
40 (78.4) |
|
Lower limb impairment, n (%) |
46 (88.5) |
46 (90.2) |
|
Assisted transfers, n (%) |
28 (53.8) |
28 (54.9) |
|
Gait aid, n (%) |
46 (88.5) |
46 (90.2) |
|
Impairments/symptoms, n (%) |
|
|
|
Visual |
24 (46.2) |
17 (33.3) |
|
Hearing |
12 (23.1) |
18 (35.3) |
|
Cognition |
45 (86.5) |
37 (72.5) |
|
Sensory |
46 (88.5) |
43 (84.3) |
|
Speech |
28 (53.8) |
23 (45.1) |
|
Falls risk |
48 (92.3) |
48 (94.1) |
|
DVT risk |
25 (48.1) |
31 (60.8) |
|
Pain |
46 (88.5) |
42 (82.4) |
|
Pressure ulcers |
2 (3.8) |
4 (7.8) |
|
Bladder |
32 (61.5) |
25 (49.0) |
|
Bowel |
29 (55.8) |
22 (43.1) |
|
NIS, mean (SD) |
25.1 (5.6) |
23.6 (6.1) |
|
DASS total, mean (SD) |
53.0 (30.9) |
41.6 (35.2) |
|
Depression |
17.6 (10.6) |
13.8 (12.3) |
|
Anxiety |
16.2 (9.8) |
13.0 (11.8) |
|
Stress |
19.2 (11.5) |
15.1 (12.2) |
|
MOCA, mean (SD) |
19.6 (6.3) |
21.7 (5.7) |
|
RSES, mean (SD) |
18.9 (5.2) |
19.7 (4.6) |
|
FIM motor total, mean (SD) |
48.6 (12.3) |
50.4 (16.7) |
|
FIM cognition total, mean (SD) |
25.8 (4.5) |
27.0 (4.4) |
|
EQ-5D Overall health, mean (SD) |
49.0 (16.6) |
53.1 (18.3) |
|
CVA: cerbro-vascular incident; DVT: deep vein trhombosis; DASS: Depression Anxiety Stress Scale; EQ-5D: Euro-Quality of life scale; FIM: Functional Independent Measure; MOCA: Montreal Cognitive Assessment, n: total number; NESB: non-english speaking background; NIS: Neurological Impairment Scale; RSES: Rosenberg Self-Esteem Scale; SD; standard deviation. |
||
Outcome measurements change scores
Summary data for all outcome measures at different time periods are shown in Table III.
|
Table III. Summary of outcomes of the Enriched Environmental Programme |
|||||||||||||||
|
Scales |
Intervention group |
|
Control group |
|
Independent-samples t-test |
||||||||||
|
T0 (n = 52) Mean (SD) |
T1 (n = 52) Mean (SD) |
T2 (n = 49) Mean (SD) |
|
T0 (n = 51) Mean (SD) |
T1 (n = 51) Mean (SD) |
T2 (n = 48) Mean (SD) |
|
T1–T0 |
|
T2–T0 |
|||||
|
Mean diff (95% CI) |
p |
η2a |
|
Mean diff (95% CI) |
p |
η2a |
|||||||||
|
DASS Total |
53.0 (30.9) |
20.0 (20.3) |
15.9 (24.2) |
|
41.6 (35.2) |
20.6 (22.4) |
18.6 (22.7) |
|
–12.0 (–23.3,–0.7) |
0.037 |
0.04 |
|
–17.0 (–32.2, –1.9) |
0.028 |
0.05 |
|
Depression |
17.6 (10.6) |
6.6 (7.4) |
7.9 (11.0) |
|
13.8 (12.3) |
6.7 (7.7) |
8.9 (11.6) |
|
–4.5 (–8.5,–0.4) |
0.034 |
0.04 |
|
–6.3 (–12.6, 0.1) |
0.052 |
0.04 |
|
Anxiety |
16.2 (9.8) |
6.7 (7.0) |
3.2 (7.4) |
|
13.0 (11.8) |
6.6 (7.6) |
2.8 (5.2) |
|
–3.0 (–6.6,0.6) |
0.099 |
0.03 |
|
–3.6 (–7.9, 0.8) |
0.106 |
0.03 |
|
Stress |
19.2 (11.5) |
6.7 (7.0) |
4.8 (9.0) |
|
15.1 (12.2) |
7.1 (8.2) |
6.9 (8.4) |
|
–4.5 (–8.6,–0.4) |
0.030 |
0.05 |
|
–7.1 (–12.3, –1.9) |
0.008 |
0.07 |
|
MHLC Internal |
21.1 (6.0) |
25.8 (5.4) |
24.5 (5.1) |
|
22.2 (4.4) |
23.4 (5.0) |
22.9 (4.5) |
|
3.5 (1.2, 5.9) |
0.003 |
0.08 |
|
2.8 (0.5, 5.1) |
0.016 |
0.06 |
|
Chance |
20.9 (5.7) |
23.8 (6.6) |
24.4 (5.4) |
|
21.9 (4.7) |
23.0 (5.5) |
24.1 (5.0) |
|
1.7 (–0.8, 4.3) |
0.185 |
0.02 |
|
1.1 (–1.3, 3.4) |
0.327 |
0.01 |
|
Doctors |
13.1 (3.9) |
15.2 (2.6) |
14.8 (2.7) |
|
12.6 (2.8) |
12.7 (3.0) |
13.7 (2.3) |
|
1.8 (0.4, 3.1) |
0.012 |
0.06 |
|
0.8 (–0.7, 2.3) |
0.272 |
0.01 |
|
Other people |
11.9 (3.1) |
13.3 (2.6) |
13.3 (2.3) |
|
12.1 (2.7) |
12.7 (2.7) |
13.0 (2.3) |
|
0.8 (–0.4, 2.1) |
0.182 |
0.02 |
|
0.6 (–0.7, 1.9) |
0.335 |
0.01 |
|
MOCAc |
19.6 (6.3) |
25.2 (3.3) |
NA |
|
21.7 (5.7) |
25.3 (3.2) |
NA |
|
2.0 (0.01, 4.0) |
0.048 |
0.04 |
|
NA |
NA |
NA |
|
RSES |
18.9 (5.2) |
21.8 (4.6) |
23.0 (5.5) |
|
19.7 (4.6) |
20.9 (4.8) |
22.7 (5.1) |
|
1.9 (–0.1, 3.9) |
0.058 |
0.04 |
|
1.5 (–0.9, 4.0) |
0.214 |
0.02 |
|
FIM Motor Total |
48.6 (12.3) |
72 (14.2) |
71.1 (15.7) |
|
50.4 (16.7) |
67.9 (16.8) |
65.7 (23.6) |
|
5.9 (1.6, 10.1) |
0.007 |
0.07 |
|
7.1 (0.2, 14.0) |
0.043 |
0.04 |
|
Self-care |
21.9 (5.5) |
33.3 (7.0) |
33.3 (7.5) |
|
23.7 (7.8) |
31.8 (7.8) |
31.5 (15.0) |
|
3.3 (1.1, 5.4) |
0.003 |
0.08 |
|
3.6 (–0.6, 7.8) |
0.093 |
0.03 |
|
Sphincter |
10.6 (2.9) |
12.8 (1.9) |
12.5 (2.2) |
|
9.8 (4.0) |
11.7 (3.2) |
11.3 (3.4) |
|
0.3 (–0.7, 1.4) |
0.524 |
0.00 |
|
0.5 (0.7, –0.8) |
0.478 |
0.01 |
|
Mobility |
11.2 (3.9) |
16.8 (3.4) |
16.4 (4.0) |
|
11.8 (4.6) |
15.7 (4.4) |
14.8 (5.2) |
|
1.7 (0.5, 2.8) |
0.006 |
0.07 |
|
2.2 (0.5, 3.9) |
0.010 |
0.07 |
|
Locomotion |
5.0 (1.7) |
9.2 (3.0) |
9.0 (3.3) |
|
5.2 (2.0) |
8.7 (2.7) |
8.2 (3.1) |
|
0.6 (–0.5, 1.7) |
0.259 |
0.01 |
|
0.8 (–0.5, 2.0) |
0.250 |
0.01 |
|
FIM Cognition Total |
25.8 (4.5) |
30.3 (4.3) |
30.1 (4.4) |
|
27.0 (4.4) |
31.0 (3.1) |
29.9 (4.5) |
|
0.5 (–1.3, 2.3) |
0.565 |
0.00 |
|
1.1 (–0.9, 3.2) |
0.281 |
0.01 |
|
Communication |
11.8 (2.3) |
13.0 (1.7) |
13.0 (1.7) |
|
12.2 (2.1) |
13.1 (1.5) |
12.9 (1.8) |
|
0.3 (–0.3, 1.0) |
0.310 |
0.01 |
|
0.5 (–0.4, 1.4) |
0.245 |
0.01 |
|
Psychosocial |
4.7 (0.7) |
5.8 (0.9) |
5.6 (1.2) |
|
4.9 (0.5) |
6.0 (0.7) |
5.7 (1.3) |
|
0.0 (–0.3, 0.4) |
0.839 |
0.00 |
|
0.2 (–0.4, 0.7) |
0.531 |
0.00 |
|
Cognition |
9.4 (2.1) |
11.5 (2.4) |
11.5 (2.3) |
|
9.8 (2.8) |
11.9 (1.6) |
11.4 (2.2) |
|
0.1 (–0.9, 1.2) |
0.830 |
0.00 |
|
0.4 (–0.7, 1.5) |
0.439 |
0.01 |
|
NISc |
25.1 (5.6) |
18.3 (5.0) |
NA |
|
23.6 (6.1) |
16.0 (4.5) |
NA |
|
0.7 (–1.8, 3.3) |
0.581 |
0.00 |
|
NA |
NA |
NA |
|
EQ-5D Mobility |
3.0 (0.9) |
3.1 (0.9) |
3.5 (0.7) |
|
3.3 (0.6) |
3.2 (0.8) |
3.5 (0.7) |
|
0.2 (,0.2, 0.6) |
0.366 |
0.01 |
|
0.3 (–0.1, 0.7) |
0.172 |
0.02 |
|
Self-care |
3.1 (0.8) |
2.9 (1.1) |
3.2 (0.9) |
|
3.1 (0.7) |
3.2 (0.7) |
3.4 (0.6) |
|
0.3 (–0.7, 0.1) |
0.158 |
0.02 |
|
–0.2 (–0.6, 0.2) |
0.267 |
0.01 |
|
Daily activity |
2.9 (0.7) |
2.8 (0.8) |
3.1 (0.8) |
|
3.0 (0.6) |
2.9 (0.7) |
3.3 (0.6) |
|
0.1 (–0.3, 0.4) |
0.737 |
0.00 |
|
0.1 (–0.3, 0.4) |
0.661 |
0.00 |
|
Pain/discomfort |
2.5 (0.7) |
2.8 (1.0) |
3.0 (0.9) |
|
2.8 (0.8) |
2.8 (0.8) |
2.9 (0.8) |
|
0.2 (–0.2, 0.6) |
0.289 |
0.01 |
|
0.3 (–0.1, 0.7) |
0.100 |
0.03 |
|
Anxiety/depression |
2.9 (0.8) |
3.0 (1.0) |
3.2 (0.8) |
|
3.0 (0.7) |
3.0 (0.8) |
3.3 (0.8) |
|
0.0 (–0.4, 0.4) |
0.848 |
0.00 |
|
0.1 (–0.3, 0.5) |
0.693 |
0.00 |
|
Index valueb |
0.1 (0.3) |
0.6 (0.3) |
0.5 (0.4) |
|
0.4 (0.4) |
0.6 (0.3) |
0.4 (0.4) |
|
0.3 (0.2, 0.4) |
0.000 |
0.19 |
|
0.4 (0.2, 0.5) |
0.000 |
0.20 |
|
Overall health |
49.0 (16.6) |
71.1 (16.3) |
74.4 (22.7) |
|
53.1 (18.3) |
70.8 (18.5) |
70.4 (23.2) |
|
4.4 (–3.1, 11.9) |
0.248 |
0.01 |
|
8.4 (–2.1, 18.9) |
0.114 |
0.03 |
|
T0: Baseline, T1: discharge, T2: 3-month follow-up. Correlation significant at all levels < 0.05 (2-tailed) are in bold. aη2 (eta-squared): effect size assessed against Cohen’s criteria (0.01: small, 0.06: moderate and 0.14: large effect). bEQ-5D index-based summary score (UK). cNot assessed at 3-month follow-up (T2), as requires face-to-face assessments. DASS: Depression Anxiety Stress Scale; EQ-5D: Euro-Quality of life scale; ES: effect size; FIM: Functional Independent Measure, Mean diff: estimated mean difference; MHLC: Multidimensional Health Locus of Control; MOCA: Montreal Cognitive Assessment; NA: not applicable; n: total number, NIS: Neurological Impairment Scale; RSES: Rosenberg Self-Esteem Scale; SD: standard deviation; 95% CI: 95% confidence interval. |
|||||||||||||||
Short-term outcomes. At discharge, independent-samples t-tests showed a significant difference between treatment and control group in favour of treatment group, in DASS: “total”, “depression” and “anxiety” subscales (p < 0.05 for all) with small magnitude (eta squared (η2) = 0.04–0.05); in personal beliefs to which they were able to control or influence outcomes (MHLC subscales: “internal”: p = 0.003, η2 = 0.08 and “doctors”: p = 0.012, η2 = 0.06); and cognitive function (MoCA: p = 0.048, η2 = 0.04). Individual self-esteem of participants in the intervention group improved; however this was not statistically significant (RSES: p = 0.058, η2 = 0.04). Compared with the control group, the intervention group also showed significant improvement in activities: FIM motor: total (p = 0.007), and “self-care” (p = 0.003, η2 = 0.08), “mobility” (p = 0.006, η2 = 0.07) subscales. The magnitude of differences in the means was moderate for all these subscales (η2 = 0.07–0.08). There were no significant, short-term effects on other measures (Table III).
Long-term outcomes. At 3 months follow-up, compared with the control group, a statistically significant difference was maintained in favour of the intervention group in the cognitive outcomes: in DASS subscales: “total” (p = 0.028), and “stress” subscales (p = 0.008), with moderate effect sizes (η2 = 0.05–0.07); and for the participants’ locus of control (MHLC subscales: “internal”, p = 0.003; and “doctors”, p = 0.012), with moderate effect sizes, η2 = 0.08 and 0.06 respectively. Surprisingly, participants in intervention group reported significant improvement in mobility (FIM “mobility” subscale; p = 0.006, η2 = 0.07). No difference between groups was noted for the other subscales, including QoL and overall health of participants.
Subgroup analysis based on the diagnosis. Almost half of the participants in both groups had had a stroke. At discharge both cognitive function and activity improved significantly in intervention group participants’ with stroke. While those in the intervention group with other diagnoses (MS, brain tumours and others), only cognitive function improved as measured by MoCA (p = 0.018) at discharge. Estimated difference in scores between intervention and control groups at discharge was significantly in favour of intervention group with stroke in DASS total and all subscales (p < 0.005 for all); in MHLC “internal” subscale (p = 0.026); FIM total, self-care and mobility subscales (p < 0.05 for all). At 3-months follow-up the participants with stroke indicated improvement in their overall health (EQ-5D “overall health” (p = 0.047). No difference between groups was noted for the other subscales (Table IV).
|
Table IV. Estimated mean difference scores of outcomes variables between intervention and control groups based on diagnosis (stroke and other neurological conditions) |
|||||||||||
|
Scales |
Stroke (n = 53) |
|
Other neurological conditions (n = 50) |
||||||||
|
Discharge (T1) – Baseline (T0) |
|
3-Month (T2) – Baseline (T0) |
|
Discharge (T1) – Baseline (T0) |
|
3-Month (T2) – Baseline (T0) |
|||||
|
Mean diff. (95% CI) |
p |
|
Mean diff (95% CI) |
p |
|
Mean diff (95% CI) |
p |
|
Mean diff (95% CI) |
p |
|
|
DASS Total |
–24.1 (–40.1, –7.2) |
0.006 |
|
–8.2 (–21.9, 5.5) |
0.233 |
|
–4.8 (–21.1, 11.6) |
0.560 |
|
2.3 (–11.3, 15.8) |
0.735 |
|
Depression |
–8.3 (–41.0, –7.2) |
0.008 |
|
–2.5 (–8.7, 3.8) |
0.433 |
|
–2.8 (–9.0, 3.4) |
0.371 |
|
0.1 (–3.7, 7.0) |
0.974 |
|
Anxiety |
–7.3 (–12.7, –1.9) |
0.009 |
|
–1.4 (–5.1, 2.3) |
0.452 |
|
–0.6 (–5.9, 4.7) |
0.829 |
|
2.2 (–1.6, 5.9) |
0.255 |
|
Stress |
–8.5 (–14.6, –2.3) |
0.008 |
|
–4.4 (–9.9, 1.5) |
0.119 |
|
–1.4 (–7.0, 4.2) |
0.560 |
|
0.0 (–4.4, 4.5) |
0.990 |
|
MHLC Internal |
3.7 (0.5, 7.1) |
0.026 |
|
1.8 (–0.9, 4.4) |
0.186 |
|
3.3 (–0.2, 6.9) |
0.061 |
|
1.0 (–1.9, 3.8) |
0.500 |
|
Chance |
1.9 (–2.1, 5.9) |
0.344 |
|
0.6 (–2.7, 3.8) |
0.721 |
|
1.4 (–1.9, 4.7) |
0.383 |
|
–0.2 (–3.1, 2.6) |
0.869 |
|
Doctors |
1.6 (–0.3, 3.5) |
0.100 |
|
1.2 (–0.0, 2.4) |
0.053 |
|
1.9 (–0.1, 3.9) |
0.066 |
|
1.0 (–0.7, 2.7) |
0.257 |
|
Other people |
0.1 (–1.4, 1.7) |
0.876 |
|
–0.4 (–1.7, 0.8) |
0.508 |
|
1.5 (–0.4, 3.5) |
0.116 |
|
0.9 (–0.5, 2.2) |
0.208 |
|
MOCAa |
2.1 (–0.7, 4.9) |
0.144 |
|
NA |
NA |
|
3.8 (0.7, 6.6) |
0.018 |
|
NA |
NA |
|
RSES |
2.1 (–0.4, 4.6) |
0.097 |
|
0.5 (–2.2, 3.2) |
0.707 |
|
1.7 (–1.5, 5.0) |
0.285 |
|
0.0 (–3.5, 3.5) |
0.989 |
|
FIM Motor Total |
6.7 (0.2, 13.1) |
0.043 |
|
5.8 (–1.7, 13.4) |
0.127 |
|
4.6 (–0.8, 10.1) |
0.095 |
|
4.3 (–10.5, 19.2) |
0.558 |
|
Self-care |
3.5 (0.4, 6.6) |
0.028 |
|
3.5 (–0.2, 7.2) |
0.065 |
|
2.8 (–0.1, 5.7) |
0.060 |
|
0.2 (–8.9, 9.3) |
0.970 |
|
Sphincter |
0.2 (–1.4, 1.7) |
0.841 |
|
0.8 (–0.0, 1.6) |
0.052 |
|
0.5 (–1.0, 1.9) |
0.519 |
|
1.2 (–0.9, 3.3) |
0.247 |
|
Mobility |
2.0 (0.3, 3.8) |
0.024 |
|
1.2 (–1.0, 3.3) |
0.276 |
|
1.2 (–0.4, 2.7) |
0.135 |
|
1.9 (–1.3, 5.1) |
0.235 |
|
Locomotion |
0.9 (–0.7, 2.6) |
0.249 |
|
0.4 (–1.3, 2.1) |
0.670 |
|
0.2 (–1.2, 1.6) |
0.754 |
|
1.1 (1.0, 3.1) |
0.304 |
|
FIM Cognition Total |
1.2 (–1.6, 4.1) |
0.380 |
|
0.2 (–1.9, 2.2) |
0.871 |
|
–0.2 (–2.3, 1.9) |
0.856 |
|
0.1 (–3.0, 3.2) |
0.931 |
|
Communication |
0.5 (–0.6, 1.6) |
0.362 |
|
–0.3 (–1.2, 0.6) |
0.450 |
|
0.1 (–0.6, 0.8) |
0.802 |
|
0.5 (–0.5, 1.60 |
0.331 |
|
Psychosocial |
0.5 (–0.0, 1.0) |
0.052 |
|
0.1 (–0.5, 0.7) |
0.683 |
|
–0.1 (–0.7, 0.5) |
0.722 |
|
–0.2 (–1.1, 0.6) |
0.577 |
|
Cognition |
0.3 (–1.3, 1.8) |
0.751 |
|
0.4 (–0.7, 1.4) |
0.386 |
|
–0.2 (–1.5, 1.2) |
0.795 |
|
–0.2 (–1.7, 1.4) |
0.846 |
|
EQ-5D Mobility (1–5) |
–0.1 (–0.6, 0.4) |
0.806 |
|
–0.1 (–0.4, 0.3) |
0.636 |
|
0.4 (–0.1, 1.0) |
0.104 |
|
0.0 (–0.4, 0.5) |
0.975 |
|
Self-care (1–5) |
–0.2 (–0.8, 0.4) |
0.464 |
|
–0.2 (–0.5, 0.2) |
0.451 |
|
–0.4 (–0.9, 0.2) |
0.213 |
|
–0.2 (–0.7, 0.4) |
0.531 |
|
Daily activity (1–5) |
–0.2 (–0.7, 0.3) |
0.447 |
|
–0.1 (–0.5, 0.4) |
0.803 |
|
0.3 (–0.2, 0.8) |
0.247 |
|
–0.2 (–0.7, 0.2) |
0.328 |
|
Pain/discomfort (1–5) |
0.1 (–0.5, 0.7) |
0.719 |
|
0.1 (–0.3, 0.6) |
0.571 |
|
0.3 (–0.2, 0.9) |
0.233 |
|
–0.1 (–0.5, 0.5) |
0.845 |
|
Anxiety/depression (1–5) |
0.2 (–0.4, 0.7) |
0.477 |
|
0.1 (–0.3, 0.6) |
0.593 |
|
–0.1 (–0.7, 0.5) |
0.706 |
|
–0.2 (–0.7, 0.3) |
0.386 |
|
Index value (–0.59–1.0)b |
–0.4 (0.2, 0.5) |
0.000 |
|
0.1 (–0.0, 0.3) |
0.076 |
|
0.2 (0.0, 0.3) |
0.019 |
|
0.1 (–0.2, 0.3) |
0.714 |
|
Overall Health (0–100) |
8.0 (–1.4, 17.5) |
0.097 |
|
11.4 (0.1, 22.7) |
0.047 |
|
–0.1 (–11.9, 11.6) |
0.983 |
|
–3.9 (–18.9, 11.1) |
0.600 |
|
*Correlation significant at all velvels < 0.05 (2-tailed) are bold. aEQ-5D index-based summary score (UK). bNot assessed at 3-month follow-up (T2), as requires face-to-face assessments. DASS: Depression Anxiety Stress Scale; EQ-5D: Euro-Quality of life scale; FIM: Functional Independent Measure; MHLC: Multidimensional Health Locus of Control; MOCA: Montreal Cognitive Assessment; NA: not applicable; n: total number; NIS: Neurological Impairment Scale, RSES: Rosenberg Self-Esteem Scale; 95% CI: 95% confidence interval. |
|||||||||||
Participants’ satisfaction with the programme. At discharge overall (90%) participants were satisfied with the programme and the staff; and indicated that they would recommend the service to others. Over two-thirds (81%) of participants reported that the programme helped them to better manage their condition, and 83% reported that they were coping better since they received the service. The most common suggestion/comments made by the participants were for provision of more assisting staff and availability of more activities within the “Activity Arcade”.
DISCUSSION
To our knowledge this is the first RCT to examine the efficacy of an EE programme within an interdisciplinary rehabilitation service model for an adult inpatient neurological cohort within the Australian public hospital system. The multimodal intervention; the “Activity Arcade” significantly improved participants’ cognitive, coping and self-management skills, attention and perceptual skills; physical function and overall QoL. These functions improved mostly in participants’ with stroke and enhanced the experience of inpatient rehabilitation. The “Activity Arcade” provided opportunities for socialization, interaction and provided another platform for patients to enhance self-confidence/self-esteem, coping skills and improve understanding of their disabilities.
The findings of this study are difficult to compare with others, due to the lack of studies in a similar context. The positive effects on various aspects of cognitive scores (DASS, MoCA, locus of control), functional (FIM scores), and other outcomes (QoL) for participants in the intervention group, both at discharge and 3-months post-intervention were independent of the type of the “Activity Arcade” activities and, importantly, were achieved irrespective of variability in duration of these programmes. This suggests the need for engagement of patients in extra activities during their hospital stay and longer-term in the community. These findings are of particular relevance for long-term planning and management of this patient population, and are supported by earlier studies evaluating different forms of EE (9, 22).
There is consensus amongst rehabilitation professionals that increasing activity levels improve patient outcomes and enhance recovery. Previous attempts to increase activity levels have involved predominantly staff-driven interventions, such as group therapy and recreational activities within wards; very few studies have investigated patient self-driven strategies (37). EE has been shown to improve cognitive functioning including learning ability, spatial and problem solving skills, memory and processing speed, based on the phenomenon of neuroplasticity in which a stimulating environment triggers cellular and molecular changes within the brain (38). The “Activity Arcade” programme in this study was based on these principles, and provided additional non-therapy-based physical and cognitive activity within the formal rehabilitation programmes, in which patients voluntarily engage in different activities of their choice.
Similar to other studies, there were many challenges in conducting this RCT in a rehabilitation setting (35, 39). The study included participants with different neurological conditions, who presented with a range of issues and required an individualized approach. However, there was not the intention to compare outcomes of participants with stroke, for instance, with those with MS or brain tumours within the group or between groups. The focus was to evaluate the effect of this EE intervention compared with a control group, in accordance with the CONSORT guidelines and Good Clinical Practice principles (GCP) (all chief investigators are trained and currently certified with the GCP). Methodological issues included blinding, compliance, multilayered treatments, interdependent components, individual interventions and ethical considerations. Standardizing the intervention would have been difficult and was not done, intentionally to involve participants in different activities of their own choice. However, the programme was supervised (by a health professional) and assisted (e.g. by playing a game with the participant), and provided verbal encouragement. The likelihood of progressive functional decline, constantly changing disability and uncertain prognosis of certain patient subgroups (such as brain tumour) can make a patient’s life more challenging (40). These factors may have influenced the type and intensity of the rehabilitation intervention provided; this study, however, did not attempt to control these factors. The routine multidisciplinary rehabilitation (MDR) programme and supportive medical treatment in wards may consequently have caused the observed effects; however, the treatment protocol was consistent with the routine practice and was generalized to all participants irrespective of the group allocation. Hence, it had little confounding effect on the findings.
This study was conducted in the “real world” setting of a tertiary public hospital with finite resources and has some limitations. Selection bias cannot be ruled out, as participants who agreed to take part were recruited from a single RMH rehabilitation unit. The randomization was not stratified based on condition and disease severity; however, both groups were well matched for all diagnoses. All participants admitted to the ward during the study period were assessed, irrespective of their demographic or disease status. There was no statistically significant difference in any of the study variables between participants who completed post-treatment assessment and those lost to follow-up. It was difficult to blind the participants; however, the treating therapists and assessors were blinded to reduce potential bias. The assessors were independent of the rehabilitation or intervention teams. Though the MDR programmes were individualized for each participant during their inpatient stay based on their needs, the “Activity Arcade” was conducted in addition to these programmes. Therefore, the control group participants were not unduly disadvantaged as they participated in ward activities as per usual practice. Operationally, it was beyond the resources of our hospital to provide therapy simultaneously for this many patients. Comparison and generalizability of these results is difficult. Larger sample sizes in different settings and different patient subgroups are needed to confirm these findings. We acknowledge that other factors may have impacted participants’ overall functional and/or cognitive improvement and were not studied. Over three-quarters of participants in the present study reported some degree of physical dysfunction, cognitive issues and disease-specific symptoms, such as pain. These factors not only affect the recovery process, but also negatively influence QoL (4). A comprehensive report of particular symptoms and physical and cognitive dysfunction, however, was beyond the scope of this study.
Whilst a comprehensive approach to outcome measurement was undertaken, other important outcomes, such as impact on carers and families, may have been missed. Analysis of costs associated with care was beyond the scope of this study. The impact of other rehabilitation modalities and interventions, within the EE is unknown, and needs further research. The implications of this study include the need for triaging and prioritizing the inpatients for targeted additional therapeutic activities. Emphasis should be on a continuity of such activities post-discharge in their homes and community for maintenance of function and psychological sequelae.
This study provides evidence for effectiveness of an EE programme within the inpatient neuro-rehabilitation settings for improved patient engagement, coping, self-management and participation. These findings support the feasibility of such programmes with utilization of limited resources within busy public-funded rehabilitation services. The EE programme can provide a platform to educate healthcare professionals to enhance the quality of acute rehabilitation by addressing problems important to patients. More research in the effectiveness of specific components of the interventions is needed. EE can benefit patients throughout the disease continuum at acute or subacute levels and requires integrated care for improved outcomes. More emphasis on outcome-orientated research is needed to explore service models and integrated MDR with EE programmes to address patient needs.
ACKNOWLEDGEMENTS
The authors are grateful to all participants in this study. They particularly wish to thank Ms M. Klaic and Mr Colin J. Steel for their assistance with setting up the Activity Arcade; Dr S. Chopra, Ms L. Oscari and Mr D. Tsavios for patient assessments, and Miss S. Amatya for data entry.
The authors declare no conflicts of interest.
REFERENCES

