Katarina Skough Vreede, PT, PhD, Lisbet Broman, MLT and Kristian Borg, MD, PhD
From the Division of Rehabilitation Medicine, Department of Clinical Sciences, Karolinska Institutet, Stockholm, Sweden
OBJECTIVE: Follow-up of the health of patients with prior polio over a 17-year period.
DESIGN: Follow-up study.
Patients: Patients with prior polio.
METHODS: The study questionnaire was answered in 1995 by 270 patients. In 2012 the questionnaire was sent again to the surviving patients.
RESULTS: Of the patients who answered the questionnaire in 1995, 116 (40%) were still alive in 2012. The group of patients who had died was older, and had a mean age of 70 years in 1995. A total of 60 patients participated in the study by answering the questionnaire in both 1995 and 2012. Most of these patients (84%) reported that they felt progressively worse, with poor mobility and increased muscle weakness in 2012 compared with 1995, and more than half reported a lower quality of life in 2012. The number of wheelchair users had increased significantly. Furthermore, the patients experienced increasing problems with activities of daily living (ADL) function.
CONCLUSION: More than half of the patients with prior polio had died between 1995 and 2012. These patients were, on average, older than patients surviving in 2012. When interviewed in 2012 most of the patients felt progressively worse, with poor mobility and increased muscle weakness.
Key words: poliomyelitis; health; quality of life.
J Rehabil Med 2016; 48: 00–00
Correspondence address: Katarina Skough Vreede, Department of Rehabilitation Medicine, Danderyd University Hospital, Building 39, Floor 3, SE-182 88 Stockholm, Sweden. E-mail: katarina.skough@ki.se
Accepted Jan 20, 2016; Epub ahead of print Mar 14, 2016
INTRODUCTION
Poliomyelitis is a viral disease, which in some cases may affect the anterior horn cells, resulting in flaccid paralysis. After a period of clinical stability new or increased symptoms may occur, and are referred to as post-polio syndrome (PPS) (1). Common symptoms of PPS are muscle weakness, fatigue, and muscle and/or joint pain (2).
Currently 12–20 million people worldwide are estimated to have sequelae of poliomyelitis, according to Post-polio Health International (3). In the Swedish population the number of polio survivors is estimated to be 15,000 (4). In 1994 a project was started as a cooperation between the patient organization RTP (Swedish Society for Traffic and Polio Disabled) and the Department of Rehabilitation Medicine at Huddinge University Hospital, Stockholm, Sweden. The aim was to identify and characterize patients with sequelae of poliomyelitis in Stockholm County and to start an outpatient clinic based on a multidisciplinary rehabilitation team for diagnosis and rehabilitation. In 1995, a study questionnaire was sent to all members of RTP in Stockholm County and given to polio patients visiting the outpatient clinic at the Department of Rehabilitation Medicine at Huddinge University Hospital, providing an estimate of the current state of health of the patients (5). The aim of the present study was to conduct a follow-up of the group of patients with sequelae of poliomyelitis. The health of the patients from 1995 to 2012 was evaluated.
MATERIAL AND METHODS
Patients
A total of 270 patients (109 men, 161 women) with prior polio (pp) answered the study questionnaire in 1995. In 2012 a modified questionnaire based on the one from 1995 was sent again to the 116 surviving patients. Sixty patients answered the questionnaire again. The study was performed at the Department of Rehabilitation Medicine, Karolinska Institutet, Danderyd University Hospital, Stockholm, Sweden.
Measurements
The 1995 questionnaire included questions concerning the onset of polio, symptoms and physical, as well as medical, state of health from onset of polio until the date of completion (1995). The 2012 study questionnaire included questions regarding the situation in 2012. The questionnaire also covered symptoms and the physical as well as medical state of health during the period 1995 to 2012. In 2012, Short Form 36 (SF-36) (6) and EQ-5D (7), both measuring health-related quality of life, and the Multidimensional Fatigue Inventory (MFI-20) (8) measuring fatigue were added to the study questionnaire.
The SF-36 comprises 36 questions in the dimensions: Physical Function (PF), Role-Physical (RP), Bodily Pain (BP), General Health (GH), Vitality (VT), Social Function (SF), Role-Emotional (RE) and Mental Health (MH). A higher score indicates better health status (0–100). SF-36 also includes 2 compound scores, a Physical Component Summary (PCS) and a Mental Component Summary (MCS). The mean score of PCS and MCS is 50 and the standard deviation is 10. A higher score indicates better health status. Results of SF-36 are compared with normal values from a Swedish population (9). Outside the 8 dimensions, SF-36 also includes a question about general health a year ago.
The EQ-5D consists of 5 dimensions: mobility, hygiene, main activities, pain and anxiety/depression each with 3 alternative answers. Results are presented as Index score (0–1). Data from the patients were compared with normal values from a Swedish population (10). When analysing results from EQ-5D Index, results below 0.00 are scored as 0.00.
A visual analogue scale (VAS) for self-reported current health status is also included in EQ-5D.
The MFI-20 comprises 20 questions in the dimensions: general fatigue, physical fatigue, mental fatigue, reduced motivation and reduced activity. A higher score indicates a higher level of fatigue (4–20). The questions refer to aspects of fatigue experienced during the days prior to completion.
Statistical analysis
The statistics program IBM SPSS Statistics version 22 (IBM, Chicago, IL, USA) was used for data analysis. A p-value less than 0.05 was considered statistically significant. Descriptive statistics (mean, standard deviation (SD), median and interquartile range (IQR)) were used for patient characteristics and results of pain. The non-parametric tests McNemar test, the Wilcoxon test and Independent Sample test were used to analyse differences between different occasions.
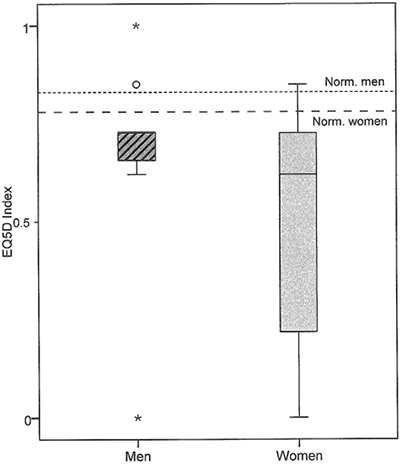
The results of EQ-5D are presented as a box plot. The bottom and top of the box represent the first and third quartiles, and the band inside the box is the median. The ends of the whiskers represent the lowest data and the highest data points that are not outliers. Any data not included between the whiskers are plotted as outliers and are more than 1.5 box-lengths from the 25th and 75th percentiles, respectively.
Ethics approval
The study was approved by the Ethics Review Board in Stockholm (Sweden; Dnr 2012/1526-31/5).
RESULTS
The questionnaire was answered by 270 patients in 1995. As shown in Table I the group of patients not answering the questionnaire in 2012 (non-respondents) was older than the group of patients answering the questionnaire (respondents). The group of patients who died before 2012 had the highest mean age.
|
Table I. Main demographic characteristics of the different samples, in the 1995 survey. Total sample (n = 270), and its 3 subgroups; Respondents 2012 (n = 60), Non-respondents 2012 (n = 56) and Died 1995–2012 (n = 154) |
||||
|
|
n |
Sex M/F |
Age, years, mean (SD) |
Age, years, min–max |
|
Survey 1995 (all) |
270 |
109/161 |
65 (12) |
18–92 |
|
Respondents 2012 |
60 |
25/35 |
56 (11) |
18–76 |
|
Non-respondents 2012 |
56 |
22/34 |
61 (10) |
32–78 |
|
Died 1995–2012 |
154 |
62/92 |
70 (10) |
39–92 |
|
SD: standard deviation; M: male; F: female. |
||||
Patient characteristics 2012
A total of 60 patients answered the questionnaire, both in 1995 and in 2012. However, the 60 patients did not answer every question. For patients’ characteristics see Table II.
|
Table II. Characteristics of the respondents 2012 (n = 60) |
|||
|
|
n |
Mean (SD) |
Min–max |
|
Age, years |
60 |
74 (11) |
36–94 |
|
Onset of polio, years |
60 |
10 (9) |
0–37 |
|
Length, m |
55 |
1.67 (0.10) |
1.38–1.85 |
|
Weight, kg |
54 |
69 (11) |
43–100 |
|
BMI |
53 |
25 (4) |
15–35 |
|
Sex, male/female |
60 |
25/35 |
– |
|
BMI: body mass index; SD: standard deviation. |
|||
Among the 2012 respondents, 30 were married or cohabiting and 25 lived alone (missing = 5). Four patients had other family members affected by polio. Nine patients were working full- or part-time, 4 patients had temporary disability or disability pension (full- or part-time) and the remainder were retired (none were on sick leave or unemployed) (missing = 1).
Estimated disability
Patients were asked to estimate their disability, in the acute phase, the best period (before 1995), 1995 and 2012 (Fig. 1). There were statistically significant differences between the acute phase and best period (p < 0.001) as well as between the best period and the estimated disability in 1995 (p < 0.001). The estimated disability was not statistically significantly different (p < 0.873) between 1995 and 2012.
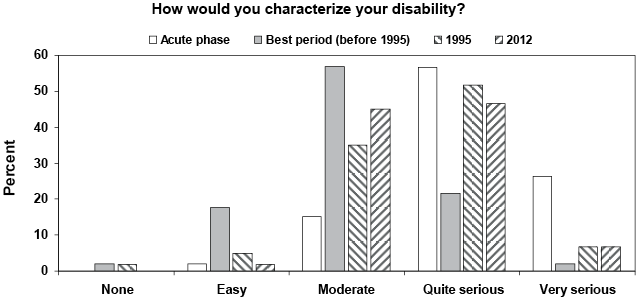
Fig. 1. Results of estimated disability in the acute phase, the best period (before 1995), 1995 and 2012, respectively. Results are shown as percentage of prior polio patients answering the questions.
Follow-up 1995–2012
A majority of the patients (n = 47/56, 84%) felt progressively worse, with poor mobility (n = 51/57, 89%) in the year 2012 compared with 1995 and a majority (n = 48/56, 86%) also reported that they moved less. Approximately half of the patients (n = 26/53, 49%) had reduced their interests and hobbies, and slightly more than half of the patients (n = 36/59, 61%) reported that their quality of life had decreased from 1995 to 2012.
Paralysis. Most (93%) of the pp patients (n = 52/56) reported increased muscle weakness since 1995. Paresis in the lower extremities was most common, and 77–78% of the patients estimated increased muscle weakness in the legs since 1995 (Table III). Paresis in the left arm was statistically significantly (p = 0.031) more common among the patients in 2012 compared with 1995.
|
Table III. Respondents 2012: patients with paralysis at onset of polio, and increased paralysis 1995–2012. Results are presented in number (n) and in percent (%) |
||||
|
Paralysis |
n |
Onset of polio n (%) |
n |
Increased 1995–2012 n (%) |
|
Right arm |
44 |
16 (36) |
39 |
22 (56) |
|
Left arm |
45 |
16 (36) |
42 |
23 (55) |
|
Right leg |
52 |
42 (81) |
47 |
36 (77) |
|
Left leg |
56 |
45 (80) |
49 |
38 (78) |
|
Trunk |
46 |
28 (61) |
42 |
17 (41) |
|
Impact on respiratory |
44 |
9 (21) |
42 |
12 (29) |
|
Swallowing/speech problem |
46 |
2 (4) |
43 |
9 (21) |
New or increased symptoms. Back pain decreased statistically significantly (p = 0.035) between 1995 and 2012 (Table IV). Muscle weakness in previously weakened body parts, general fatigue, and muscle and joint pain on exertion were the most common (in that order) new or increased symptoms in 1995. These symptoms increased for more than half of the patients from 1995 to 2012, however, without reaching statistical significance. Decreased muscle volume was another symptom that increased during this time for more than half of the patients. There were no statistically significant differences between answers regarding new or increased symptoms in 1995 and from 1995 to 2012 for men and women, respectively.
|
Table IV. Respondents 2012: prior polio patients with new or increased symptoms in 1995 and 1995–2012, respectively |
||||
|
Symptoms |
n |
New or increased symptom 1995, n (%) |
New or increased symptom 1995–2012, n (%) |
p-value |
|
General fatigue |
53 |
41 (77) |
39 (74) |
0.687 |
|
Muscle weakness in previously weakened body parts |
55 |
46 (84) |
50 (91) |
0.289 |
|
Muscle weakness in previously non weakened body parts |
45 |
23 (51) |
21 (47) |
0.774 |
|
Decreased muscle volume |
43 |
27 (63) |
32 (74) |
0.227 |
|
Muscle pain at rest |
50 |
19 (38) |
23 (47) |
0.332 |
|
Muscle pain on exertion |
49 |
35 (71) |
31 (63) |
0.424 |
|
Joint pain at rest |
49 |
19 (39) |
16 (33) |
0.607 |
|
Joint pain on exertion |
53 |
36 (68) |
31 (59) |
0.332 |
|
Back pain |
53 |
32 (60) |
23 (43) |
0.035 |
|
Loss of sensation |
52 |
10 (19) |
16 (31) |
0.109 |
|
Respiratory problems at rest |
52 |
4 (8) |
4 (8) |
1.000 |
|
Respiratory problems on exertion |
53 |
15 (28) |
16 (30) |
1.000 |
|
Cold intolerance |
56 |
28 (50) |
33 (59) |
0.383 |
|
Headache upon awakening |
53 |
14 (26) |
7 (13) |
0.065 |
|
Concentration problems |
53 |
17 (32) |
13 (25) |
0.424 |
|
Feeling low |
53 |
21 (40) |
16 (30) |
0.302 |
|
Irritability |
54 |
20 (37) |
20 (37) |
1.000 |
|
Anxiety |
51 |
13 (26) |
17 (33) |
0.388 |
|
Sleep disorders |
51 |
24 (47) |
26 (51) |
0.774 |
|
Significant value is shown in bold. |
||||
Walking aids. A description of the use of walking aids in 1995 and 2012, respectively, is given in Table V. Manual and electric wheelchairs were the aids whose use increased the most during the study period.
|
Table V. Patients use of walking aids in 1995 and in 2012, respectively |
||||
|
Walking aids |
n |
1995 n (%) |
2012 n (%) |
p-value |
|
Cane/canes |
43 |
17 (40) |
16 (37) |
1.000 |
|
Crutches |
46 |
17 (37) |
20 (44) |
0.581 |
|
Corset |
42 |
6 (14) |
6 (14) |
1.000 |
|
Lower leg bandage |
38 |
10 (26) |
9 (24) |
1.000 |
|
Whole leg bandage |
44 |
15 (34) |
13 (30) |
0.687 |
|
Customized shoes |
47 |
23 (49) |
24 (51) |
1.000 |
|
Manual wheelchair |
51 |
17 (33) |
28 (55) |
0.013 |
|
Electric wheelchair |
49 |
10 (20) |
20 (41) |
0.006 |
|
Significant values are shown in bold. |
||||
Concomitant diseases. Hypertension was reported in 2012 by more than half of the patients in the study. The increase between 1995 and 2012 reached statistical significance (p < 0.001). Other concomitant disorders did not differ significantly between 1995 and 2012.
Daily activities. In 1995 most (88%) of the patients had difficulty walking up and down stairs and 74% of the patients reported difficulty walking on flat ground (Table VI). These 2 difficulties in daily activities increased for more than 90% of the patients between 1995 and 2012. The patients had statistically significantly more difficultly performing activities of daily living (ADL) in 2012 compared with 1995 (Table VI).
|
Table VI. Patients reporting yes about new or increased difficulties in daily activities in 1995 and 1995–2012, respectively |
||||
|
Daily activities |
n |
New or increased symptom 1995, n (%) |
New or increased symptom 1995–2012, n (%) |
p-value |
|
Difficulty walking on flat ground |
54 |
40 (74) |
49 (91) |
0.049 |
|
Difficulty walking up and down stairs |
56 |
49 (88) |
52 (93) |
0.508 |
|
Difficulties dressing/undressing |
57 |
3 (5) |
21 (37) |
< 0.001 |
|
Difficulties with bath/shower |
55 |
10 (18) |
20 (36) |
0.021 |
|
Difficulties with housework |
55 |
23 (42) |
33 (60) |
0.031 |
|
Difficulties driving a car |
42 |
9 (21) |
17 (41) |
0.077 |
|
Difficulty using public transport |
55 |
39 (71) |
41 (75) |
0.754 |
|
Difficulties with hobbies |
53 |
24 (45) |
29 (55) |
0.227 |
|
Significant values are shown in bold. |
||||
Physiotherapy. Patients were undergoing physiotherapy treatment to a greater extent in 1995 compared with 2012 (69% and 56%, respectively). Fewer patients were being treated for pain in 2012 compared with 1995 (16% and 35%, respectively). The same pattern was also seen for movement and strength training. However, the differences were not statistically significant.
Quality of life, fatigue and pain in 2012
All dimensions of health-related quality of life (SF-36), except for Mental Health, Social Functioning and Mental Component Summary (MCS), differed statistically significantly between the pp patients and the Swedish normal values (Table VII).
|
Table VII. Results of the questionnaires Short Form 36 (SF-36) and EQ-5D for the patients (for n, see the Table) and the Swedish normal values (n = 59). p-values between patients and normal values are also shown |
|||||||
|
|
n |
Patients |
|
Swedish normal values |
p-value |
||
|
Mean |
SD |
|
Mean |
SD |
|||
|
SF-36 |
|
|
|
|
|
|
|
|
Physical Functioning |
56 |
21.9 |
20.1 |
|
67.0 |
10.7 |
< 0.001 |
|
Role-Physical |
56 |
43.3 |
42.5 |
|
58.8 |
12.0 |
0.003 |
|
Bodily Pain |
58 |
58.1 |
26.5 |
|
65.6 |
4.7 |
0.042 |
|
General Health |
57 |
50.5 |
22.7 |
|
62.8 |
6.2 |
< 0.001 |
|
Vitality |
58 |
48.0 |
26.3 |
|
60.9 |
9.0 |
0.001 |
|
Social Functioning |
58 |
73.1 |
31.0 |
|
82.7 |
5.4 |
0.091 |
|
Role-Emotional |
54 |
59.0 |
43.8 |
|
71.5 |
9.6 |
0.030 |
|
Mental Health |
58 |
72.9 |
22.1 |
|
77.8 |
5.4 |
0.331 |
|
PCS |
51 |
27.8 |
10.6 |
|
43.1 |
2.4 |
< 0.001 |
|
MCS |
51 |
48.8 |
13.6 |
|
50.7 |
0.9 |
0.349 |
|
EQ-5D |
|
|
|
|
|
|
|
|
Index |
47 |
0.571 |
0.264 |
|
0.800 |
0.023 |
< 0.001 |
|
Current health status (VAS) |
51 |
55 |
21 |
|
|
|
|
|
Significant values are shown in bold. PCS: Physical Component Summary; MCS: Mental Component Summary; SD: standard deviation. |
|||||||
Women rated the dimensions Physical Function (p = 0.028), Role-Physical (p = 0.002), Bodily Pain (p = 0.043), Role-Emotional (p = 0.017) and PCS (p = 0.025) significantly lower than did men. On the question about patients general health one year previously (SF-36, question 2), 31/59 answered “much better – about the same”, 28/59 answered “slightly – much worse now than a year ago”.
For results of EQ-5D Index and EQ-5D VAS, see Table VII and Fig. 2. A wider distribution of answers was seen for women compared with men (Fig. 2). The patients had a significantly (p ≤ 0.001) lower score on the EQ-5D Index compared with normal values.
The patients experienced more general fatigue, physical fatigue and reduced activity than mental fatigue, as measured by means of MFI-20. This pattern was also reflected by higher/better SF-36 MCS than Physical Component Summary (PCS).
The pp patients (n = 56) rated their pain on a VAS as 19 (median), 3–48 (Q25–Q75). Women rated their pain higher (median 28) (p = 0.047) compared with men (median 6). Sixty percent (n = 31/52) of the patients reported polio-specific pain, 43% (n = 22/51) in paralysed muscles and 41% (n = 19/46) in non-paralysed muscle. Women reported polio-specific pain (male 41%, female 73%) more often than men (p = 0.018).
DISCUSSION
When analysing differences in health status of pp patients between 1995 and 2012, approximately 40% of the patients were still alive in 2012. An important question is whether or not pp patients have a higher morbidity than the normal population. Kay et al.1 showed a slightly higher morbidity in pp patients. The present study is not able to answer this question. The patients who had died during the period were, on average, older. Records for the cause of death were not available, but we believe that the causes of death were age-related and not related to polio sequelae. Independent of the cause of death of the patient, the information is useful when planning for the dimension of care of pp patients. The decrease in number of patients of Swedish ethnicity has been compensated for by an increasing number of younger polio patients who are immigrants from countries with other cultures. Thus the spectrum of medical and physical, as well as social, challenges encountered in the post-polio outpatient clinic has changed with time (Werhagen & Borg, personal communication, 2015) and constitutes a challenge for the multi-professional teams engaged in post-polio rehabilitation. We believe that this is a general pattern for polio outpatient clinics in western countries that introduced vaccination programmes in the late 1950s.
The number of patients in the present study is small and selected. However, larger epidemiological and follow-up studies have been performed in other countries, such as Denmark, Norway and The Netherlands (11–13) and Kay et al.1,

1Kay L. Long-term morbidity among 4267 persons, who contracted poliomyelitis in Copenhage, Denmark 1920–1954. Follow-up for more than 60 years. 2nd European Polio Conference Amsterdam 25–27 June 2014 and personal communication [2015 May].
with follow-up times in a range comparable to that of the present study. The results of these studies, the present study and forthcoming studies with longer follow-up times are of importance to establish the rate of decline and major clinical problems of polio patients in order to plan for appropriately dimensioned clinics in western countries.
The statistically significant improvement between the patient’s estimated disability in the acute phase and the best period, seen in the present study, follows the expected course, with a period of partial or complete functional recovery after acute poliomyelitis, followed by a period of stable neurological function and, thus, the criteria for PPS (14). This is most probably due to reinnervation resulting in amelioration of function and activity followed by a stable period. The decline between the estimated disability during the best period and the estimated disability in 1995 is also expected and part of PPS. This is probably due to an ongoing denervation-reinnervation process reaching an upper limit, when further reinnervation is no longer possible (11).
Although the patients reported a decrease in mobility and increasing ADL problems there were, surprisingly, no statistically significant differences between the estimated disability in 1995 and 2012. This may be due to a longstanding disability and an effective coping process. An increased discrepancy between self-reported quality of life and physical function with increasing age has been described and has been called response shift (15). Jung et al. (16) described an increased quality of life in terms of vitality in PPS patients with increasing age and attributed this to response shift. The finding of poorer mobility and decreased ADL function, although there were no differences in the patients’ self-estimated disability between 1995 and 2012 may thus also be due to response shift.
Our findings that the patients reported poorer mobility, the increase in patients using wheelchairs, and increasing problems with ADL function, was also found in the study by Bickerstaffe et al. (12), who reported a modest rate of decline in mobility over a 10-year follow-up study. This may be due to progress of PPS, but it may also be a part of normal ageing. There is a progressive loss of muscle mass and strength (i.e. sarcopaenia) (17) as well as age-related loss of neurones in the ventral horn of the spinal cord (18, 19). In order to evaluate the influence of the ageing process further research is needed to objectively measure parameters of muscle mass and strength in different age groups and different groups regarding duration of time since acute polio compared with control groups.
Muscle weakness in previously weakened body parts, general fatigue, and muscle and joint pain on exertion were the most common symptoms among the patients included in the study, consistent with the most common symptoms reported in earlier studies (2). The paresis was most often found in the lower extremities and more than half of the patients reported increased muscle weakness. This difference over time in the lower extremities did not reach statistical significance, while paresis in the left arm was significantly more common among the patients in 2012 compared with 1995. This is contrast with earlier results in the study by Sandberg & Stålberg (20), indicating a more pronounced ongoing denervation-reinnervation process over time in the lower extremity (tibialis anterior muscle) compared with upper extremity (biceps brachii muscle). One may speculate that the difference could be activity-dependent, and that patients are forced to use the upper extremities more due to a decrease in muscle power in the lower extremities.
The current patients with polio rated their health-related quality of life (SF-36) lower than the normal Swedish population, most markedly regarding physical dimensions, general health and vitality. Women rated several dimensions of quality of life significantly lower than men, in accordance with the results of an earlier study (16). Women with polio also had significantly more pain compared with men, also in accordance with earlier studies (16, 21–25). An earlier study showed pain to affect quality of life only for Vitality and General Health, but not for other physical and mental domains (24). Similarly, in this study, as discussed above, decreased mobility did not seem to affect the perception of disability, a phenomenon most probably due to the long-standing disability and to an effective coping process.
A limitation of the current study was the small number of patients, and that the participating patients did not answer every question. One explanation for the high rate of surviving patients not responding to the questionnaire in 2012 could be age and health status. The majority of the patients not responding were 80 years or older and some of these patients may not have been capable of answering the questionnaires. The questionnaire was neither easy nor designed to be answered by relatives. In 1995 the questionnaire was sent to members of the patient organization (RTP). They were mainly native Swedes and older than other groups of polio patients, explaining the high age of patients included in the study. Another study limitation was that that no clinical examination was performed.
In conclusion, more than half of the pp patients had died between 1995 and 2012. These patients were, on average, older than surviving patients in 2012. Most of the patients reported that they felt progressively worse, with poor mobility, increased muscle weakness, increasing problems with ADL function and increased wheelchair use in the year 2012 compared with 1995. Slightly more than half of the patients also rated their health-related quality of life lower with the passage of time.
ACKNOWLEDGEMENTS
The authors would like to thank the patient organization RTP and the Foundation for Traffic and Polio victims in Stockholm for their contribution and financial support; all patients who participated in the study; colleagues at the post-polio outpatient clinic at the Department of Rehabilitation Medicine, Huddinge Hospital for the administration of the questionnaires in 1995, KI and SLL.
REFERENCES

