Gökhan Çağlayan, MD1, Levent Özçakar, MD1, Semra Ulusoy Kaymak, MD2, Bayram Kaymak, MD1 and Ayşen Akıncı Tan, MD1
From the 1Department of Physical and Rehabilitation Medicine, Hacettepe University Medical School and 2Atatürk Training and Research Hospital, Department of Psychiatry, Ankara, Turkey
OBJECTIVE: To determine whether (diagnostic and interventional) ultrasound imaging can be used to provide visual feedback affecting treatment outcome (pain and disability).
DESIGN: Controlled clinical trial.
SUBJECTS: A total of 52 patients with (ultrasonographically confirmed) symptomatic Baker’s cysts were enrolled.
METHODS: The cysts were drained under ultrasound guidance and, if necessary, corticosteroid injections were given on the follow-up visit. In group I (n = 26) the patients did not observe the procedures on the ultrasound (US) screen. In group II (n = 26) the US images/videos were shown and explained to the patients. The patients were included in one of the groups consecutively, unless they refused the protocol of that group. Treatment outcome was assessed via US measurements, aspirate volumes, visual analogue scale (VAS) (knee pain, procedure discomfort), Western Ontario and McMaster Universities Osteoarthritis Index (WOMAC), Rauschning-Lindgren Classification (RLC), Kellgren–Lawrence grading scale, Hospital Anxiety and Depression Scale, and paracetamol intake.
RESULTS: The 2 groups were similar regarding US measurements, aspirate volume and paracetamol use (p-values > 0.05). In both groups all VAS (p < 0.001) and WOMAC (p < 0.05) scores decreased after treatment. Although initial VAS and WOMAC scores were similar between the groups, all VAS/WOMAC scores, except VAS-2, WOMAC-2 pain, and WOMAC-3 stiffness, were significantly lower in group II (all p < 0.05). Initial RLC scores were similar between the groups; however, group II had significantly lower scores at visits 2 and 3.
CONCLUSION: In patients with Baker’s cysts (diagnostic/interventional) US imaging can be used as a simple means of visual biofeedback, favourably affecting the treatment outcome (pain and disability).
Key words: ultrasound; biofeedback; Baker’s cyst; knee; intervention.
J Rehabil Med 2016; 00: 00–00
Correspondence address: Levent Özçakar, Hacettepe Üniversitesi Tıp Fakültesi Hastaneleri Zemin Kat FTR AD, Sıhhıye, Ankara, Turkey. E-mail: lozcakar@yahoo.com
Accepted Nov 11, 2015; Epub ahead of print Dec 21, 2015
INTRODUCTION
Ultrasound (US) imaging has long been used in the diagnosis of various musculoskeletal disorders. Real-time US guidance is now increasingly being used to enable more precise performance of interventions (1–3). However, it is not known whether treatment outcomes are favourably affected by the use of US guidance (4). Published studies, generally of US-guided vs. blind injections, have reported conflicting results (1, 5).
Since US imaging is interactive, the images/videos could be used as a form of visual feedback to inform and reassure patients, and it is possible that this could alter treatment outcomes. The aim of this study was to determine whether patients who observe diagnostic and interventional procedures on the screen during US imaging have better outcomes. The model used to test this hypothesis was aspiration of Baker’s cysts, which is a common clinical procedure during which US images/videos can readily be explained to the patients.
METHODS
The study protocol was approved by the local ethics committee and the study was performed between December 2013 and July 2014.
Subjects and study protocol
Study subjects were recruited consecutively from patients presenting to our outpatient department with swelling/pain on the posterior side of the knee. Subjects were informed substantially about the study procedure and volunteered to participate.
Inclusion criteria were: age over 18 years, and ultrasonographically confirmed, symptomatic Baker’s cysts. Exclusion criteria were: inflammatory arthritis; contraindication for aspiration or corticosteroid injections; non-steroidal anti-inflammatory drug use in the last week; physical therapy in the last month; knee/Baker’s cyst injection or knee surgery within the last 3 months; and psychiatric/cognitive disorders.
A medical history was taken, physical examination performed, and the presence of Baker’s cyst confirmed by US examination. At visit 1, prior to initial aspiration, subjects were evaluated with visual analogue scale (VAS-1), Western Ontario and McMaster Universities Osteoarthritis Index (WOMAC-1), Rauschning-Lindgren Classification (RLC-1), Kellgren–Lawrence grading scale (K-L), Hospital Anxiety and Depression Scale (HADS) and US imaging. Subjects were then categorized one by one consecutively into 2 groups, i.e. group I: not observing the US screen; group II: observing the US screen during the procedure (Fig. 1). The subject’s preference was also considered when they were assigned to the groups. In the presence of bilateral Baker’s cysts, the more symptomatic side of the subject was included in the analysis.
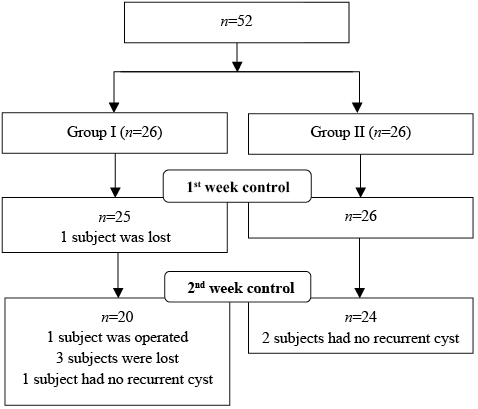
Fig. 1. CONSORT (Consolidated Standards of Reporting Trials) diagram showing the patients’ enrollment and follow-up.
During the whole procedure, both groups were informed in detail about the presence/nature of the Baker’s cyst, and the aspirate was shown each patient. However, only patients in group II were asked to observe the US screen during diagnostic/interventional imaging.
Immediately after aspiration, subjects were re-assessed with VAS for procedure pain (VAS-p) and knee pain (VAS-r). In addition, the physician was asked to score the difficulty of the procedure (VAS-d). Subjects were recalled for a follow-up visit one week later. If they experienced severe pain, they were only allowed to use paracetamol and the dose was recorded.
On visit 2, repeat evaluations were performed using VAS-2, WOMAC-2, RLC-2 and US-2. Subjects with recurrent Baker’s cysts were re-aspirated, but this time also injected with corticosteroids (6.43 mg betamethasone dipropionate and 2.63 mg betamethasone sodium phosphate). Subjects were invited to attend the final follow-up visit (visit 3) one week later, whereby they were re-evaluated using VAS-3, WOMAC-3, RLC-3 and US-3 (Table I).
|
Table I. Patient evaluation protocol |
||
|
Visit 1 (day 0) |
Visit 2 (day 7) |
Visit 3 (day 14) |
|
VAS-1 |
VAS-2 |
VAS-3 |
|
WOMAC-1 |
WOMAC-2 |
WOMAC-3 |
|
RLC-1 |
RLC-2 |
RLC-3 |
|
HADS |
US-2 |
US-3 |
|
K-L |
Aspirate volume |
Paracetamol |
|
US-1 |
Paracetamol |
|
|
Aspirate volume |
||
|
VAS-p |
||
|
VAS-d |
||
|
VAS-r |
||
|
VAS: visual analogue scale: WOMAC: Western Ontario and McMaster Universities Osteoarthritis Index; RLC: Rauschning-Lindgren Classification; HADS: Hospital Anxiety and Depression Scale; K-L: Kellgren–Lawrence Classification; US: ultrasound; VAS-p: VAS-procedure; VAS-d: VAS-difficulty; VAS-r: VAS-relief. |
||
Pain and functional assessment
VAS (0–10 cm) was used to assess the subjects’ current knee pain. A Turkish version of the WOMAC scale was used to evaluate knee pain, stiffness and function (6). RLC, a semi-quantitative (0–3) scale for grading knee pain, swelling and range of motion, was also scored by the same physician (7).
Hospital Anxiety and Depression Scale
Patients were asked to complete the Turkish version of the Hospital Anxiety and Depression Scale (HADS), a simple 14-question form that evaluates depression and anxiety in patients with physical health problems (8). Each item is scored 0–3 as Likert type. The maximum score for the anxiety or depression subscale is 21.
Radiographic evaluation
Antero-posterior and lateral radiographs were obtained for the symptomatic knees and graded (0–4) according to the K-L scale (9).
Ultrasound examination
Subjects lay in the prone position during examination. US imaging was performed by an expert physiatrist (with more than 15 years of experience in musculoskeletal US) using a 5–12 MHz linear probe (Logiq P5, General Electric Medical Systems, Wisconsin, USA). After transverse and longitudinal scanning, Baker’s cyst was defined as anechoic enlargement of the semimembranous-gastrocnemius bursa. Short- and long-axis diameters of the cyst were measured on axial view, with gentle positioning of the probe to avoid compression. The intervention (aspiration or corticosteroid injection) was carried out using the direct in-plane method (1) with a 21-G needle under aseptic conditions using poviodine-iodine. Aspirate volumes were noted.
Statistical analysis
SPSS Statistics for Windows, Version 21.0 (IBM Corp., Armonk, NY, USA) was used for the analysis. Shapiro-Wilk test was used for normality of the variables. Descriptive values are expressed using mean and standard deviation (SD) or median (interquartile range; IQR). Mean comparisons between groups were made using Student’s t-test or Mann Whitney U test, where appropriate. Categorical variables were compared using χ2 test or Fisher’s exact test.
Repeated measures analysis of variance and post hoc test, least significant difference, were used for the repeat measurements. For VAS/WOMAC scores and US measurements, homogeneity of variance was assessed using Mauchly’s test of sphericity. Comparisons were made for VAS scores (p = 0.258), using within-subjects effects test; and for WOMAC scores (p = 0.022) and US measurements (p = 0.01), using Greenhouse-Geisser test, respectively. Dependent t-test or Wilcoxon signed-rank test were also used for comparison of paired measurements, where appropriate.
Stepwise regression was used to analyse the possible effect of HADS on VAS and WOMAC scores. Statistical significance was set at p < 0.05.
RESULTS
A total of 52 subjects participated in this study (Table II). The 2 groups were similar in terms of age, body mass index (BMI), sex distribution, symptom duration and K-L grading (all p > 0.05).
Although HADS anxiety scores were similar between groups, HADS depression scores were higher in group II (p = 0.014). However, this difference had no impact on VAS and WOMAC scores (p > 0.05).
|
Table II. Demographic and clinical characteristics of the subjects |
|||
|
|
Group I (n = 26) |
Group II (n = 26) |
p-value |
|
Age, years, mean (SD) |
58.9 (12.96) |
56.0 (2.63) |
0.479 |
|
BMI, kg/m2, mean (SD) |
29.0 (5.40) |
28.9 (6.60) |
0.268 |
|
M/F, n |
7/19 |
7/19 |
|
|
Symptom duration, months, mean (SD) |
12.0 (22.50) |
12.0 ( 25.00) |
0.832 |
|
R/L, n |
11/15 |
8/18 |
|
|
HAD-A, mean (SD) |
5.0 (6.25) |
1.0 (8.25) |
0.106 |
|
HAD-D, mean (SD) |
6.0 (7.25) |
1.0 (5.00) |
0.014* |
|
*p < 0.05. BMI: body mass index; M: male: F: female; R: right; L: left; HAD-A: Hospital Anxiety and Depression-Anxiety; HAD-D: Hospital Anxiety and Depression-Depression. |
|||
The US measurements are given in Table III. In both groups, the dimensions of the recurrent Baker’s cysts were smaller than the initial sizes (all p < 0.05) and there were no differences between groups (all p > 0.05). Likewise, the groups were similar regarding amount of aspirate and, in both groups, second aspirations yielded less fluid (p-values > 0.05) (Table III).
|
Table III. Ultrasound measurements (cm) and aspirate volumes (ml) |
|||
|
Group I Median (IQR) |
Group II Median (IQR) |
p-value |
|
|
Visit 1 |
|||
|
Long axis |
2.5 (1.11) |
3.1 (1.08) |
0.054 |
|
Short axis |
1.4 (0.69) |
1.4 (0.59) |
0.912 |
|
Visit 2 |
|
||
|
Long axis |
2.3 (1.18) |
2.7 (1.26) |
0.299 |
|
Short axis |
1.1 (0.63) |
1.1 (0.63) |
0.844 |
|
Visit 3 |
|
||
|
Long axis |
2.3 (1.04) |
2.6 (1.24) |
0.438 |
|
Short axis |
1.1 (0.99) |
0.8 (0.50 |
0.487 |
|
V1 |
7.5 (13.75) |
10.0 (26.50) |
0.480 |
|
V2 |
6.5 ( 12.88) |
5.5 (19.13) |
0.502 |
|
p |
0.009* |
0.001* |
|
|
*p < 0.05, volume comparisons within groups. V: volume. |
|||
While VAS-p and VAS-d values were similar between groups (both p > 0.05), group II had significantly lower VAS-r values (p = 0.043). VAS and WOMAC scores of the subjects at 3 visits are given in Table IV. Compared with the initial scores, all VAS (p < 0.001) and WOMAC scores were decreased in both groups (all p < 0.05). However, although initial VAS and WOMAC scores were similar between groups, all VAS/WOMAC scores, except VAS-2, WOMAC-2 pain and WOMAC-3 stiffness, were significantly lower in group II (all p < 0.05).
|
Table IV. Pain and functional assessment scores |
|||
|
|
Group I Median (IQR) |
Group II Median (IQR) |
p-value |
|
Visit 1 |
|||
|
VAS |
9.0 (5.00) |
8.0 (3.08) |
0.309 |
|
WOMAC-P |
11.3 (4.94) |
11.6 (3.67) |
0.800 |
|
WOMAC-S |
4.5 (5.00) |
4.0 (2.00) |
0.365 |
|
WOMAC-F |
38.8 (14.72) |
35.6 (13.33) |
0.416 |
|
WOMAC-T |
54.6 (21.01) |
51.2 (17.11) |
0.518 |
|
Visit 2 |
|||
|
VAS |
5.0 (4.85) |
2.5 (4.60) |
0.097 |
|
WOMAC-P |
8.8 (5.30) |
6.6 (4.53) |
0.119 |
|
WOMAC-S |
4.0 (4.00) |
2.0 (3.00) |
0.028* |
|
WOMAC-F |
32.0 (16.39) |
21.3 (13.99) |
0.015* |
|
WOMAC-T |
44.6 (23.31) |
30.3 (19.40) |
0.022* |
|
Visit 3 |
|||
|
VAS |
2.9 (3.90) |
0.0 (0.95) |
0.003* |
|
WOMAC-P |
5.5 (5.50) |
1.0 (4.75) |
0.005* |
|
WOMAC-S |
2.5 (2.75) |
1.0 (2.00) |
0.157 |
|
WOMAC-F |
21.5 (15.25) |
3.5 (13.00) |
< 0.001* |
|
WOMAC-T |
27.0 (24.00) |
6.5 (21.75) |
0.003* |
|
*p < 0.05. VAS: visual analogue scale; WOMAC: Western Ontario and McMaster Universities Osteoarthritis Index; P: pain; S: stiffness; F: function; T: total. |
|||
Although initial RLC scores were similar between groups, group II had significantly lower RLC values at visits 2 and 3 (Table V). Paracetamol use was similar between groups (p > 0.05).
|
Table V. Rauschning-Lindgren Classification (RLC) scores of the subjects |
|||
|
|
Group I n (%) |
Group II n (%) |
p-value |
|
RLC-1 |
|
|
0.673 |
|
Grade 1 |
4 (15.4) |
2 (7.7) |
|
|
Grade 2 |
5 (19.2) |
5 (19.2) |
|
|
Grade 3 |
17 (65.4) |
19 (73.1) |
|
|
RLC-2 |
|
|
0.029* |
|
Grade 0 |
4 (16.0) |
10 (38.5) |
|
|
Grade 1 |
4 (16.0) |
9 (34.6) |
|
|
Grade 2 |
11 (44.0) |
5 (19.2) |
|
|
Grade 3 |
6 (24.0) |
2 (7.7) |
|
|
RLC-3 |
|
|
<0.001* |
|
Grade 0 |
1 (5.0) |
15 (57.7) |
|
|
Grade 1 |
12 (60.0) |
6 (23.1) |
|
|
Grade 2 |
6 (30.0) |
1 (3.8) |
|
|
Grade 3 |
1 (5.0) |
2 (7.7) |
|
|
*p < 0.05. RLC: Rauschning-Lindgren Classification. |
|||
DISCUSSION
Although the utility of (visual, acoustic, vibrotactile/haptic) biofeedback is relatively well established in the field of rehabilitation, similar use of US is not commonplace (10). To the best of our knowledge, the use of real-time US imaging for providing feedback to patients during interventions has not been reported in the literature. The results of the current preliminary study show that treatment outcome (pain and disability) may be favourably affected when patients are given visual “feedback” via US images/videos.
The exact mechanism of action of biofeedback is unclear; however, it is generally assumed that certain inputs are processed in the central nervous system (CNS) and result in relevant outputs (10). It is proposed that visual and auditory inputs may help new paths to develop in the CNS or new circuits to be produced in the already existing paths, thus triggering neural plasticity through sensory stimuli (10). In our model, the input can be considered as visual (self US images/videos) and the output as decreased pain. In fact, chronic pain is one of the conditions for which the effect of biofeedback has been accepted by the Association of Applied Psychophysiology and Biofeedback (11). It has been reported that visualization of body regions decreases pain intensity (12). Similarly, in the current study group II had lower VAS, WOMAC and RLC scores than group I.
Other possible mechanisms, e.g. decreased anxiety, conditioning and the placebo effect, should also be considered. Although we did not assess the anxiety of the subjects before and after the visual feedback/intervention, it has been reported previously that the use of written and visual materials increases the efficacy of verbal information (through decreasing anxiety) as regards particular surgical procedures (13). Concerning classical conditioning; supporting the somatic/therapeutic intervention by visual feedback could have activated the relevant cognitive processes and enhanced “mind-body” learnt immunological and endocrinological healing (14). Finally, the placebo effect may also have played role. However, informing the subject causes the CNS to focus on a particular somatic region, thus increasing/changing expectancy in treatment outcome.
Providing empirical evidence in favour of the common advice not to look at the needle during an injection, Höfle et al. (15) have shown that situational expectations about forthcoming pain modulate the patient’s perceived intensity of stimuli towards that direction. They suggest that previously learned associations between visual and painful stimuli significantly modulated the affective-motivational pain component. On the other hand, in contrast to the widely accepted idea of “don’t look and it won’t hurt”; our results, in a way, support the idea of “look (let me show you) it will hurt less and you will feel better”. Overall, this may be due to the subject’s reoriented attention (being distracted from the needle, but focused on the US screen) and increased awareness concerning a pathology/procedure about which the patient is otherwise unfamiliar.
The main reasons we chose to use the model of Baker’s cyst aspiration were: first, that it is a common condition in daily clinical practice; and, secondly, that subjects can easily understand the US images or videos, i.e. a single/simple anechoic structure, the needle being inserted inside, and the disappearance of the cyst. Although discussion about the therapeutic success of US-guided Baker’s cyst aspiration is beyond the scope of this study, it is noteworthy that our results were in agreement with the literature in terms of pain relief, functional improvement and reduction in cyst volume (16).
There are 2 main limitations in our study; first, the sample size was small; therefore larger studies with longer follow-up are necessary. Secondly, it may not be fully appropriate to extrapolate our results, pertaining to the Baker’s cyst model, to other musculoskeletal conditions.
In conclusion, this preliminary study shows that US imaging can be used as a simple means of visual biofeedback, which may have a favourable effect on treatment outcome (pain and disability). Considering the “philosophy” of US use by clinicians (it has been referred as their “sixth finger”, “stethoscope” or “extended hand”) (17–19), these findings provide support for the use of US by physiatrists in daily practice.
The authors declare no conflicts of interest.
REFERENCES

