Jan D. Reinhardt, PhD1,2,3, Carolina Ballert, PhD1,2, Martin W. G. Brinkhof, PhD1,2 and Marcel W. M. Post, PhD1,4,5
From the 1Swiss Paraplegic Research (SPF), Nottwil, 2Department of Health Sciences and Health Policy, University of Lucerne, Lucerne, Switzerland, 3Institute for Disaster Management and Reconstruction, Sichuan University, Chengdu, and Hong Kong Polytechnic University, Chengdu, China, 4Brain Center Rudolf Magnus and Center of Excellence for Rehabilitation Medicine, University Medical Center Utrecht and De Hoogstraat Rehabilitation, Utrecht and 5University of Groningen, University Medical Center Groningen, Center for Rehabilitation, Groningen, The Netherlands
OBJECTIVE: To describe the impact of environmental barriers perceived by people living with spinal cord injury in the Swiss community and to compare this across subpopulations.
DESIGN: Cross-sectional study.
SUBJECTS: A total of 1,549 participants in the community survey of the Swiss spinal cord injury Cohort study.
METHODS: The perceived impact of environmental barriers on participation was measured with the Nottwil Environmental Factors Inventory Short Form (NEFI-SF). Physical independence was measured with the Spinal Cord Independence Measure Self Report (SCIM-SR). Perceived barriers were compared across people with different demographic and lesion characteristics. Multivariable regression modelling applying fractional polynomials was used to evaluate the overall perceived impact of barriers in relation to demographics, spinal cord injury characteristics, and physical independence.
RESULTS: Most perceived barriers were climatic conditions and inaccessibility of public and private infrastructure. Older participants, those with longer time since injury and participants with complete lesions indicated more problems with access. Females reported more attitudinal barriers. Approximately one-third of participants with complete tetraplegia reported obstacles related to assistance with personal care. A higher level of physical independence was associated with fewer perceived barriers.
CONCLUSION: Despite living in a rich country with a well-developed social security system, many people with spinal cord injury in Switzerland experience participation restrictions due to environmental barriers; in particular women, people with non-traumatic spinal cord injury and limited physical independence.
Key words: spinal cord injury; environmental barriers; environmental factors; physical independence.
J Rehabil Med 2016; 48: 210–218
Correspondence address: Jan D. Reinhardt, Swiss Paraplegic Research, CH-6207 Nottwil, Switzerland. E-mail: jan.reinhardt@paraplegie.ch
Accepted Nov 18, 2015; Epub ahead of print Feb 1, 2016
INTRODUCTION
Academic and legal perspectives on functioning and disability have, in the last 15 years, increasingly emphasized the critical role of environmental factors (1–5). The United Nations Convention on the Rights of Persons with Disabilities characterizes disability as resulting “from the interaction between persons with impairments and attitudinal and environmental barriers that hinders their full and effective participation in society on an equal basis with others” (4, preamble, e). Disability research focusing on environmental factors is of particular importance for rehabilitation, in addition to social policies, since many environmental barriers are man-made (e.g. poorly accessible buildings), or represent natural obstacles that can be moderated or removed by targeted intervention, such as snow clearing by dedicated winter services (6). Environmental factors can thus be modified in favour of people with disabilities (2, 3, 7). Research on environmental barriers can broadly be divided into research focusing on perceived barriers (e.g. research using questionnaires) and research applying “objective” methods for determining the presence of barriers in the environment of people with disabilities (e.g. examining the presence of ramps or accessible toilets in public buildings). While the subjectivity of research examining the perception of environmental barriers has been criticized in the past (7, 8), it is important to note that the perception of barriers can have profound consequences on the lives of persons with disabilities, such as avoiding participation (7).
In spinal cord injury (SCI) research, environmental factors have been shown to be associated with overall social participation (9–11), physical activity (12), life satisfaction (10), quality of life (13), subjective health (14) and mortality (15). Environmental barriers have been found to be reported more often by people with complete lesions (16) and those with decreased physical independence (10). In spite of the apparent contribution of environmental factors to disablement, a limited number of studies have focused on environmental barriers perceived by persons with SCI living in the community (17). Moreover, most research has been carried out in the North American context and with people with traumatic SCI. Representative samples of community dwelling persons with SCI are largely lacking (11, 18). More information on the impact of environmental barriers perceived by persons with SCI, featuring comparisons across sub-groups by demographics and injury characteristics, is of major importance to identify intervention targets and vulnerable groups and thus “provide a nuanced picture across a range of policy fields”(19, p. 1068). The objective of this paper is to characterize the impact of environmental barriers perceived by people living with SCI in Switzerland. The specific aims are: (i) to describe the frequency of perceiving environmental barriers; (ii) to compare perceived environmental barriers across relevant sub-populations; and thereby (iii) to identify particularly disadvantaged groups.
METHODS
Design
The community survey of the Swiss Spinal Cord Injury Cohort Study (SwiSCI) conducted between late 2011 and early 2013 collected comprehensive information on health, functioning and living conditions of persons with SCI residing in Switzerland (20, 21). Data were collected by written or online questionnaires and, in special cases, telephone interviews. The SwiSCI study protocol was formally approved by the local Research Ethics Committee of the Canton of Lucerne, the location of the Swiss Paraplegic Research (ethics registration number 11042). The ethics committees of the Cantons of Basel-Stadt and Valais, which are responsible for the other participating rehabilitation centres at Rehabilitation Basel (REHAB) in Basel and Clinique Romande de Réadaptation (CRR) in Sion, subsequently ratified the study protocol. Written informed consent was obtained from all participants.
Participants
The survey included Swiss residents with a traumatic or non-traumatic SCI aged over 16 years recruited through the national association for persons with SCI (Swiss Paraplegic Association), 3 specialized SCI-rehabilitation centres, and an SCI-specific home care agency. Persons with congenital conditions leading to SCI, SCI in the context of palliative care, neurodegenerative disorders, and Guillain-Barré syndrome were excluded from the study. Based on the databases of the aforementioned institutions a research database was created. People were initially contacted by post and asked to provide their informed consent and, if provided, to answer an initial short questionnaire (starter module), either online or in paper/pencil form. Prepaid return envelopes were provided. Subsequently, a longer questionnaire (basic module) was posted to those who had completed the starter module. A total of 1,549 individuals with SCI participated in the basic survey module containing the Nottwil Environmental Factors Inventory Short Form (NEFI-SF) (return rate 49.3%). Members of the Swiss Paraplegic Association were more likely to participate than non-members, while persons of the oldest age group (aged 76 years or older) as well as those with intermediate time since injury (i.e. between 6 and 25 years) were less likely to participate than those of younger age or shorter or longer time since injury, respectively. However, it is important to note that the resulting response bias with respect to available demographic and SCI characteristics was limited, showing minor impact on a variety of survey results (22). More details on the survey design and implementation are provided in an accompanying paper (22). Survey, demographic and SCI characteristics of the study sample are provided in Table I.
|
Table I. Demographic and spinal cord injury (SCI) characteristics of survey participants |
|||
|
Participant characteristics |
Missing, n (%) |
n (%) |
|
|
SwiSCI |
|
1,549 |
|
|
Gender, male |
|
1,107 (71.5) |
|
|
SCI type, paraplegia |
12 (0.8) |
1,063 (69.2) |
|
|
SCI degree, complete |
9 (0.6) |
646 (41.9) |
|
|
SCI cause, traumatic |
15 (1) |
1,202 (78.4) |
|
|
Mobility device |
63 (4.1) |
|
|
|
Wheelchair |
|
1,011 (68.0) |
|
|
Assistive device/support |
|
239 (16.1) |
|
|
Walk without aids |
|
236 (15.9) |
|
|
Questionnaire type |
|
|
|
|
Online |
|
649 (41.9) |
|
|
Paper-pencil |
|
884 (57.1) |
|
|
Telephone |
|
16 (1.0) |
|
|
Language |
|
|
|
|
German |
|
1,088 (70.2) |
|
|
French |
|
391 (25.2) |
|
|
Italian |
|
70 (4.5) |
|
|
Marital status |
12 (0.8) |
|
|
|
Single |
|
450 (29.3) |
|
|
Married/registered relationship |
|
815 (53.0) |
|
|
Divorced/widowed |
|
272 (17.7) |
|
|
Current occupational situationa |
12 (0.8) |
|
|
|
Work |
|
683 (44.4) |
|
|
Education |
|
63 (4.1) |
|
|
Unpaid work |
|
30 (2) |
|
|
Unemployed |
|
41 (2.7) |
|
|
Homemaker |
|
191 (12.4) |
|
|
Disability pension |
|
752 (48.5) |
|
|
Retired |
|
380 (24.7) |
|
|
Other occupational situation |
|
68 (4.4) |
|
|
Income sources* |
25 (1.6) |
|
|
|
Employment |
|
672 (44.1) |
|
|
Invalidity pension |
|
1,132 (74.3) |
|
|
Accident insurance |
|
666 (43.7) |
|
|
Other |
|
1,022 (67.1) |
|
|
|
|
Mean (SD) |
Median (IQR) |
|
Age, years |
|
56.1 (14.8) |
56.0 (21.1) |
|
Time since injury, years |
131 (8.5) |
17.2 (12.6) |
13.5 (18.9) |
|
Educational level, years |
32 (2.1) |
13.6 (3.3) |
13.0 (3.0) |
|
aPercentage corresponds to the proportion of available information in the Swiss Spinal Cord Injury Cohort Study (SwiSCI) sample, multiple answers were possible. IQR: interquartile range; SD: standard deviation. |
|||
Instruments
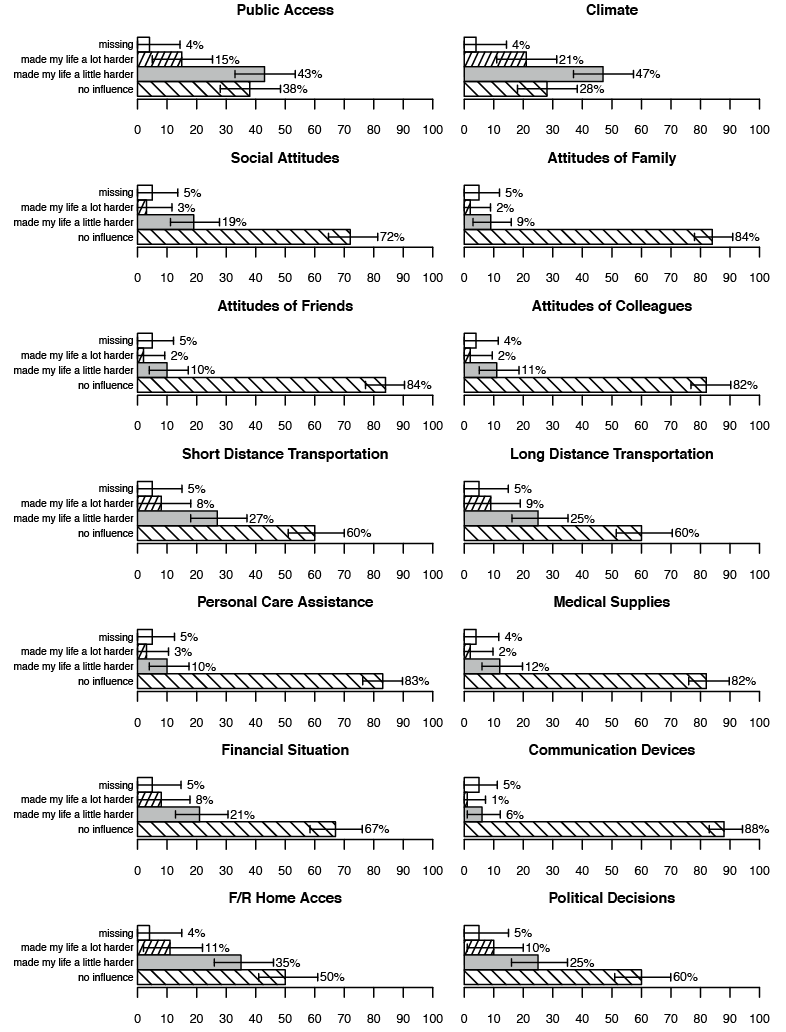
NEFI-SF. Development of the Nottwil Environmental Factors Inventory (NEFI) was based on the ICF Core Sets for SCI (23). A short form (NEFI-SF) was developed for application in community surveys (24). NEFI-SF comprises 14 items on perceived environmental barriers. Perceived accessibility was evaluated by asking about inaccessible or insufficiently accessible places; impediments related to technology, transportation, and services by asking about deficient or inadequate provisioning; and hindrances related to attitudes by inquiring about negative attitudes, with examples such as prejudice, lack of support, or overprotective behaviours. All items could be rated as: “not applicable”; “no influence”; “made my life a little harder”; or “made my life a lot harder”. For a comprehensive list of all items see Appendix I.
The construct validity of the NEFI-SF was established with Rasch analysis (24). After collapsing response options for 1 item with disordered thresholds and creating a testlet for 3 items on attitudes that showed local dependence, a metric total score of the NEFI-SF ranging from 0 (no impact of barriers) to 100 (largest possible impact of barriers) was derived. NEFI-SF was found to be a unidimensional measure, implying that the perceived impact of environmental barriers on participation can be captured by a single common latent trait (24).
Spinal Cord Independence Measure-Self Report. A self-report version of the Spinal Cord Independence Measure (SCIM III) (25), the SCIM-Self-Report (SCIM-SR) was used to measure levels of functioning in self-care, respiration, sphincter and mobility (26). The SCIM-SR total scores showed high agreement with the scores obtained from SCIM III (intraclass correlation coefficient (ICC) = 0.90; 95% confidence interval (95% CI) 0.85–0.93) (26). Rasch analysis of the SCIM-SR, presented in a separate paper (27), accommodated multidimensionality of items by creating testlets for each of the subscales. Due to the large amount of differential item functioning (DIF) for SCI level and/or completeness of injury the Rasch analyses were performed separately for participants with complete paraplegia, incomplete paraplegia and tetraplegia. Testlets were adjusted for DIF for time since injury, age, and gender. The Rasch models were anchored to allow comparability of the ability estimates. The metric ability scores of the SCIM-SR were used in the present analysis, with higher scores indicating greater physical independence.
Statistical analysis
Relative frequencies were analysed across NEFI-SF items. Endorsement of items as barriers were further compared (“made my life a little harder” or “made my life a lot harder”) across age groups (18–< 30, 30–< 45, 45–< 60, ≥ 60 years), gender, and educational levels (< 12 and ≥ 12 years), level and degree of SCI (motor incomplete paraplegia and motor complete paraplegia vs motor incomplete tetraplegia and motor complete tetraplegia), aetiology (traumatic and non-traumatic), and time since SCI (< 5 years, 5–< 15 years, 15–< 25 years, ≥ 25 years) with Wald tests. Binomial confidence intervals were also calculated. To analyse determinants of the overall perception of barriers, the Rasch-transformed total NEFI-SF score was regressed on gender, education, age, time since SCI, SCIM ability scores, SCI aetiology, and type of SCI (incomplete paraplegia, complete paraplegia, incomplete tetraplegia and complete tetraplegia). A global F-test was used to evaluate the utility of the multinomial variable type of SCI in the model; if significant, post-hoc Wald tests were performed for pairwise comparisons; p-values were Bonferroni-corrected. Fractional polynomials (28) were used for determining potential non-linear relations between all continuous predictors and the outcome. Fractional polynomials regression compares all possible functions using a predefined set of powers (−2, −1, −0.5, 0, 0.5, 1, 2, 3; with 0 representing the logarithmic transformation) regarding their fit in predicting the outcome. Repeated powers are possible. Simple models are preferred. More complicated functions are accepted only if they fit a lot better.
For bi- and multi-variable analysis, missing values (item non-response) were imputed with a recursive partitioning approach, as implemented in the R-package MissForest (29). Subsequently, inverse probability weights derived from propensity scores (30) were applied in the analyses to account for unit-non response, i.e. selective non-participation of persons with certain demographic or lesion characteristics who were initially contacted for participation in the survey. Details about this approach are provided in an accompanying paper (22). Analyses were performed with R– 3.1.0 and Stata 13.1.
RESULTS
The relative frequencies of responses to NEFI-SF individual items are shown in Fig. 1. More than half of the participants perceived that climatic conditions and insufficient accessibility of public infrastructure had a negative impact on their participation. Just under half of participants perceived that their life was made at least a little harder due to difficulties in accessing the homes of friends or relatives. Transportation, as well as policies and services, were perceived as having a negative impact by approximately one-third of the sample. More than one-quarter of the study participants indicated a negative impact of their financial situation and more than one-fifth reported problems because of social attitudes. Negative attitudes of family members, friends and colleagues, lack of medical supplies and problems with communication devices were perceived by a relatively small proportion of the total sample.
Tables II and III show the comparison of perceived barriers counting both the “a little” and “a lot” answers across sub-populations. Statistically significant differences were as follows. The oldest participants more frequently perceived barriers of short-distance transportation and communication devices, but less frequently of policies and services than younger participants. Females perceived a greater negative impact of climate, social attitudes, attitudes of family, attitudes of friends and colleagues, and accessibility of friends’ and family members’ homes. As a result, females had significantly higher NEFI-SF total scores. Persons with higher education more frequently indicated problems with public accessibility, while those with lower education more often reported barriers in personal care assistance and communication devices. Persons with longer time since injury showed the highest frequency of reporting barriers with respect to accessibility, short-distance transportation, and personal assistance, but the lowest occurrence of barriers resulting from negative attitudes of friends. Respondents with complete lesions more often indicated a negative impact of inaccessible public or private buildings, short-distance transportation, and political decisions, and had significantly higher NEFI-SF total scores. Persons with tetraplegia more frequently reported problems with or lack of communication devices. Persons with incomplete tetraplegia most often reported a negative impact of family attitudes. Almost one-third of those with complete tetraplegia perceived unavailability of, or insufficient, personal assistance. A negative impact of insufficient financial resources was most frequently reported by subjects with non-traumatic aetiologies.
|
Table II. Survey adjusted proportions with 95% confidence intervals (CI) of endorsement of barriers for Nottwil Environmental Factors Inventory Short Form (NEFI-SF) items by socio-demographic characteristics of the Swiss Spinal Cord Injury Cohort Study (SWISCI) sample |
|||||||||||||
|
NEFI-SF Items |
Total |
Age |
|
Gender |
|
Education |
|||||||
|
< 30 years |
30–< 45 years |
45–< 60 years |
≥ 60 years |
p-value |
|
Male |
Female |
p-value |
|
< 12 years |
p-value |
||
|
Public access |
|
|
|
|
|
|
|
|
|
|
|
|
|
|
Proportion |
59.9 |
53.7 |
60.4 |
51.5 |
60.6 |
0.013 |
|
55.8 |
60.4 |
0.112 |
|
49.0 |
0.002 |
|
CI |
(54.8–59.9) |
(41.9–65.5) |
(54.8–66) |
(47.2–55.8) |
(56.5–64.6) |
|
|
(52.7–58.8) |
(55.6–65.1) |
|
|
(43.2–54.9) |
|
|
Climate |
|
|
|
|
|
|
|
|
|
|
|
|
|
|
Proportion |
71.3 |
56.8 |
70.2 |
69.8 |
67.0 |
0.142 |
|
66.3 |
72.8 |
0.018 |
|
66.6 |
0.531 |
|
CI |
(66.5–71.3) |
(45–68.6) |
(64.9–75.4) |
(65.8–73.8) |
(63.1–70.9) |
|
|
(63.4–69.2) |
(68.4–77.1) |
|
|
(61–72.3) |
|
|
Social attitudes |
|
|
|
|
|
|
|
|
|
|
|
|
|
|
Proportion |
25.7 |
21.7 |
28.0 |
23.0 |
20.2 |
0.079 |
|
21.9 |
25.1 |
0.185 |
|
22.4 |
0.849 |
|
CI |
(21.4–25.7) |
(11.6–31.9) |
(22.9–33) |
(19.5–26.6) |
(17–23.5) |
|
|
(19.4–24.4) |
(21–29.2) |
|
|
(17.6–27.3) |
|
|
Attitudes of family |
|
|
|
|
|
|
|
|
|
|
|
|
|
|
Proportion |
12.7 |
12.9 |
13.4 |
11.1 |
9.1 |
0.239 |
|
9.3 |
14.4 |
0.005 |
|
11.9 |
0.518 |
|
CI |
(9.5–12.7) |
(4.9–21) |
(9.5–17.3) |
(8.4–13.8) |
(6.8–11.4) |
|
|
(7.6–11.1) |
(11–17.7) |
|
|
(8.1–15.6) |
|
|
Attitudes of friends |
|
|
|
|
|
|
|
|
|
|
|
|
|
|
Proportion |
13.8 |
11.6 |
14.2 |
10.8 |
12.1 |
0.576 |
|
10.8 |
15.2 |
0.019 |
|
11.9 |
0.923 |
|
CI |
(10.4–13.8) |
(4–19.2) |
(10.2–18.1) |
(8.1–13.5) |
(9.5–14.7) |
|
|
(8.9–12.6) |
(11.7–18.7) |
|
|
(8.1–15.7) |
|
|
Attitudes of colleagues |
|
|
|
|
|
|
|
|
|
|
|
|
|
|
Proportion |
15.6 |
11.8 |
16.6 |
11.4 |
13.3 |
0.197 |
|
11.9 |
16.5 |
0.016 |
|
14.3 |
0.570 |
|
CI |
(12–15.6) |
(4.1–19.5) |
(12.4–20.8) |
(8.7–14.1) |
(10.6–16) |
|
|
(9.9–13.8) |
(13–20) |
|
|
(10.2–18.3) |
|
|
Short distance transportation |
|||||||||||||
|
Proportion |
36.9 |
29.5 |
32.5 |
33.7 |
38.0 |
0.217 |
|
34.4 |
36.4 |
0.476 |
|
37.1 |
0.413 |
|
CI |
(32.1–36.9) |
(18.9–40.1) |
(27.3–37.7) |
(29.7–37.7) |
(34–41.9) |
|
|
(31.6–37.3) |
(31.8–40.9) |
|
|
(31.5–42.7) |
|
|
Long distance transportation |
|||||||||||||
|
Proportion |
37.7 |
25.4 |
36.1 |
33.5 |
36.9 |
0.224 |
|
34.9 |
35.7 |
0.770 |
|
38.2 |
0.223 |
|
CI |
(32.8–37.7) |
(15.1–35.8) |
(30.7–41.5) |
(29.5–37.4) |
(33–40.8) |
|
|
(32–37.7) |
(31.1–40.2) |
|
|
(32.5–43.8) |
|
|
Personal care assistance |
|||||||||||||
|
Proportion |
14.0 |
5.4 |
14.5 |
11.2 |
12.8 |
0.163 |
|
11.4 |
14.3 |
0.123 |
|
16.5 |
0.016 |
|
CI |
(10.7–14) |
(0.2–10.6) |
(10.5–18.5) |
(8.5–13.8) |
(10.1–15.5) |
|
|
(9.5–13.4) |
(11–17.6) |
|
|
(12.1–20.9) |
|
|
Medical supplies |
|
|
|
|
|
|
|
|
|
|
|
|
|
|
Proportion |
15.7 |
8.0 |
17.8 |
11.2 |
15.2 |
0.020 |
|
14.8 |
12.2 |
0.188 |
|
13.8 |
0.924 |
|
CI |
(12.2–15.7) |
(1.7–14.2) |
(13.5–22) |
(8.5–13.8) |
(12.3–18.1) |
|
|
(12.7–16.9) |
(9–15.3) |
|
|
(9.8–17.9) |
|
|
Financial situation |
|
|
|
|
|
|
|
|
|
|
|
|
|
|
Proportion |
32.1 |
23.8 |
33.0 |
29.4 |
27.4 |
0.267 |
|
28.6 |
30.2 |
0.541 |
|
33.2 |
0.087 |
|
CI |
(27.4–32.1) |
(13.8–33.8) |
(27.7–38.3) |
(25.5–33.2) |
(23.8–31) |
|
|
(25.9–31.4) |
(25.9–34.6) |
|
|
(27.7–38.7) |
|
|
Communication devices |
|||||||||||||
|
Proportion |
9.2 |
2.8 |
6.8 |
5.1 |
10.9 |
0.009 |
|
8.0 |
7.1 |
0.563 |
|
14.4 |
< 0.001 |
|
CI |
(6.4–9.2) |
(–1–6.6) |
(3.9–9.7) |
(3.2–7) |
(8.3–13.4) |
|
|
(6.3–9.6) |
(4.5–9.6) |
|
|
(10.1–18.7) |
|
|
Home access |
|
|
|
|
|
|
|
|
|
|
|
|
|
|
Proportion |
47.6 |
47.8 |
49.6 |
43.2 |
44.8 |
0.338 |
|
43.3 |
50.2 |
0.018 |
|
46.6 |
0.632 |
|
CI |
(42.5–47.6) |
(36–59.6) |
(44–55.3) |
(39–47.4) |
(40.7–48.8) |
|
|
(40.4–46.3) |
(45.4–55) |
|
|
(40.8–52.5) |
|
|
Political decisions |
|
|
|
|
|
|
|
|
|
|
|
|
|
|
Proportion |
37.5 |
38.1 |
39.5 |
35.6 |
32.8 |
0.234 |
|
34.5 |
37.2 |
0.319 |
|
35.0 |
0.893 |
|
CI |
(32.7–37.5) |
(26.6–49.6) |
(34–45) |
(31.5–39.6) |
(29–36.5) |
|
|
(31.7–37.4) |
(32.7–41.8) |
|
|
(29.4–40.5) |
|
|
0–100 Adjusted NEFI-Score |
|||||||||||||
|
Mean |
33.8 |
29.6 |
34.2 |
31.7 |
33.5 |
0.146 |
|
31.9 |
35.1 |
0.006 |
|
33.8 |
0.414 |
|
CI |
(31.8–33.8) |
(24.8–34.3) |
(31.9–36.5) |
(30–33.4) |
(31.8–35.1) |
|
|
(30.7–33.2) |
(33.2–37) |
|
|
(31.3–36.2) |
|
|
Proportions are adjusted for unit-non response based on inverse probability weights. Significant values are shown in bold. |
|||||||||||||
|
Table III. Survey adjusted proportions with 95% confidence intervals (CI) of endorsement of barriers for Nottwil Environmental Factors Inventory Short Form (NEFI-SF) items by injury characteristics of the Swiss Spinal Cord Injury Cohort Study (SWISCI) sample |
||||||||||||||||
|
NEFI-SF Items |
Time since injury |
|
SCI characteristics |
|
SCI cause |
|||||||||||
|
< 5 years |
5–< 15 years |
15–< 25 years |
≥ 25 years |
p-value |
|
Incomplete |
|
Complete |
p-value |
|
Non-traumatic |
Traumatic |
p-value |
|||
|
Tetraplegia |
Paraplegia |
|
Tetraplegia |
Paraplegia |
||||||||||||
|
Public access |
|
|
|
|
|
|
|
|
|
|
|
|
|
|
|
|
|
Proportion |
54.4 |
54.2 |
56.1 |
65.5 |
0.005 |
|
47.1 |
46.6 |
|
68.6 |
75.1 |
< 0.001 |
|
57.1 |
57.1 |
0.991 |
|
CI |
(48.4–60.4) |
(49.8–58.7) |
(51–61.3) |
(60.6–70.3) |
|
|
(41.5–52.8) |
(42.5–50.7) |
|
(61.1–76.1) |
(71.1–79) |
|
|
(51.6–62.6) |
(54.3–60) |
|
|
Climate |
|
|
|
|
|
|
|
|
|
|
|
|
|
|
|
|
|
Proportion |
68.0 |
66.6 |
68.8 |
70.3 |
0.705 |
|
65.1 |
61.3 |
|
78.0 |
76.7 |
< 0.001 |
|
68.2 |
68.2 |
0.995 |
|
CI |
(62.2–73.7) |
(62.4–70.8) |
(64–73.7) |
(65.6–75) |
|
|
(59.6–70.6) |
(57.2–65.3) |
|
(71.2–84.7) |
(72.8–80.5) |
|
|
(63–73.4) |
(65.5–70.9) |
|
|
Social attitudes |
|
|
|
|
|
|
|
|
|
|
|
|
|
|
|
|
|
Proportion |
19.3 |
24.9 |
22.5 |
22.5 |
0.369 |
|
25.4 |
22.5 |
|
20.3 |
22.4 |
0.607 |
|
23.8 |
22.6 |
0.649 |
|
CI |
(14.7–24) |
(21.1–28.7) |
(18.2–26.8) |
(18.3–26.6) |
|
|
(20.6–30.3) |
(19–25.9) |
|
(14.1–26.6) |
(18.6–26.2) |
|
|
(19.2–28.4) |
(20.2–25) |
|
|
Attitudes of family |
|
|
|
|
|
|
|
|
|
|
|
|
|
|
|
|
|
Proportion |
10.7 |
12.8 |
10.5 |
8.0 |
0.139 |
|
13.5 |
10.8 |
|
11.0 |
8.7 |
0.223 |
|
11.0 |
10.8 |
0.903 |
|
CI |
(7–14.4) |
(9.9–15.8) |
(7.3–13.6) |
(5.3–10.6) |
|
|
(9.6–17.4) |
(8.2–13.4) |
|
(6.3–15.8) |
(6.2–11.3) |
|
|
(7.5–14.5) |
(9–12.5) |
|
|
Attitudes of friends |
|
|
|
|
|
|
|
|
|
|
|
|
|
|
|
|
|
Proportion |
13.9 |
14.7 |
10.6 |
8.1 |
0.014 |
|
13.2 |
12.6 |
|
12.2 |
10.4 |
0.642 |
|
14.5 |
11.3 |
0.121 |
|
CI |
(9.8–18) |
(11.6–17.9) |
(7.4–13.8) |
(5.4–10.8) |
|
|
(9.4–16.9) |
(9.8–15.4) |
|
(7.1–17.4) |
(7.7–13.2) |
|
|
(10.7–18.3) |
(9.5–13.2) |
|
|
Attitudes of colleagues |
|
|
|
|
|
|
|
|
|
|
|
|
|
|
|
|
|
Proportion |
13.1 |
15.8 |
11.0 |
11.9 |
0.164 |
|
14.4 |
13.2 |
|
11.6 |
13.1 |
0.858 |
|
14.3 |
12.9 |
0.532 |
|
CI |
(9.1–17.2) |
(12.6–19.1) |
(7.8–14.1) |
(8.8–15.1) |
|
|
(10.5–18.3) |
(10.4–15.9) |
|
(6.7–16.5) |
(10–16.2) |
|
|
(10.5–18) |
(11–14.9) |
|
|
Short distance transportation |
|
|
|
|
|
|
|
|
|
|
|
|
|
|
|
|
|
Proportion |
36.4 |
31.4 |
34.0 |
41.5 |
0.018 |
|
31.7 |
29.4 |
|
41.6 |
42.9 |
< 0.001 |
|
35.9 |
34.8 |
0.702 |
|
CI |
(30.6–42.1) |
(27.4–35.4) |
(29.1–38.9) |
(36.5–46.4) |
|
|
(26.5–36.9) |
(25.7–33.1) |
|
(33.8–49.4) |
(38.5–47.4) |
|
|
(30.7–41.1) |
(32–37.5) |
|
|
Long distance transportation |
|
|
|
|
|
|
|
|
|
|
|
|
|
|
|
|
|
Proportion |
37.4 |
33.4 |
31.5 |
40.9 |
0.033 |
|
35.9 |
31.1 |
|
42.0 |
37.7 |
0.034 |
|
37.5 |
34.4 |
0.301 |
|
CI |
(31.6–43.3) |
(29.2–37.5) |
(26.8–36.3) |
(36–45.8) |
|
|
(30.5–41.3) |
(27.2–34.9) |
|
(34.2–49.8) |
(33.3–42) |
|
|
(32.2–42.8) |
(31.7–37.1) |
|
|
Personal care assistance |
|
|
|
|
|
|
|
|
|
|
|
|
|
|
|
|
|
Proportion |
12.1 |
10.0 |
11.9 |
16.9 |
0.025 |
|
16.2 |
7.9 |
|
28.3 |
9.9 |
< 0.001 |
|
10.6 |
12.8 |
0.274 |
|
CI |
(8.2–16) |
(7.4–12.7) |
(8.5–15.2) |
(13.1–20.6) |
|
|
(12.1–20.3) |
(5.7–10.2) |
|
(21.2–35.5) |
(7.2–12.6) |
|
|
(7.3–13.9) |
(10.9–14.7) |
|
|
Medical supplies |
|
|
|
|
|
|
|
|
|
|
|
|
|
|
|
|
|
Proportion |
12.4 |
13.1 |
14.2 |
16.6 |
0.391 |
|
14.7 |
12.3 |
|
12.0 |
16.6 |
0.209 |
|
12.9 |
14.4 |
0.505 |
|
CI |
(8.5–16.3) |
(10.1–16.1) |
(10.6–17.8) |
(12.9–20.3) |
|
|
(10.7–18.7) |
(9.6–15) |
|
(7–17) |
(13.2–19.9) |
|
|
(9.3–16.5) |
(12.3–16.4) |
|
|
Financial situation |
|
|
|
|
|
|
|
|
|
|
|
|
|
|
|
|
|
Proportion |
31.2 |
29.8 |
28.2 |
27.4 |
0.724 |
|
27.0 |
31.2 |
|
21.5 |
30.3 |
0.088 |
|
37.8 |
26.5 |
< 0.001 |
|
CI |
(25.7–36.7) |
(25.8–33.8) |
(23.6–32.9) |
(23–31.9) |
|
|
(21.9–32) |
(27.4–35.1) |
|
(15.1–28) |
(26.2–34.5) |
|
|
(32.5–43.1) |
(24–29) |
|
|
Communication devices |
|
|
|
|
|
|
|
|
|
|
|
|
|
|
|
|
|
Proportion |
9.6 |
7.2 |
7.0 |
7.9 |
0.648 |
|
13.6 |
4.8 |
|
12.0 |
5.8 |
< 0.001 |
|
9.2 |
7.3 |
0.257 |
|
CI |
(6–13.2) |
(4.9–9.6) |
(4.3–9.8) |
(5.1–10.7) |
|
|
(9.8–17.5) |
(3–6.7) |
|
(6.8–17.1) |
(3.6–8.1) |
|
|
(6–12.3) |
(5.7–8.8) |
|
|
Home access |
|
|
|
|
|
|
|
|
|
|
|
|
|
|
|
|
|
Proportion |
41.0 |
43.7 |
45.3 |
51.5 |
0.040 |
|
40.3 |
33.8 |
|
60.9 |
59.7 |
< 0.001 |
|
44.8 |
45.5 |
0.804 |
|
CI |
(35.1–46.8) |
(39.4–48.1) |
(40.2–50.5) |
(46.5–56.5) |
|
|
(34.8–45.8) |
(29.9–37.7) |
|
(53.1–68.6) |
(55.2–64.1) |
|
|
(39.3–50.2) |
(42.7–48.4) |
|
|
Political decisions |
|
|
|
|
|
|
|
|
|
|
|
|
|
|
|
|
|
Proportion |
33.9 |
35.7 |
32.1 |
39.9 |
0.155 |
|
32.4 |
31.9 |
|
38.3 |
41.2 |
0.009 |
|
37.7 |
34.6 |
0.299 |
|
CI |
(28.3–39.6) |
(31.5–39.9) |
(27.3–36.9) |
(35–44.8) |
|
|
(27.1–37.6) |
(28.1–35.7) |
|
(30.7–46) |
(36.7–45.6) |
|
|
(32.5–43) |
(31.9–37.3) |
|
|
0–100 Adjusted NEFI-Score |
|
|
|
|
|
|
|
|
|
|
|
|
|
|
|
|
|
Mean |
32.6 |
32.6 |
31.5 |
35.2 |
0.060 |
|
31.9 |
29.1 |
|
38.1 |
37.0 |
< 0.001 |
|
33.9 |
32.5 |
0.285 |
|
CI |
(30.1–35.1) |
(30.9–34.4) |
(29.4–33.7) |
(33.4–37.1) |
|
|
(29.5–34.4) |
(27.4–30.7) |
|
(35.2–41) |
(35.4–38.7) |
|
|
(31.7–36.2) |
(31.4–33.7) |
|
|
Proportions are adjusted for unit-non response based on inverse probability weights. Significant values are shown in bold. |
||||||||||||||||
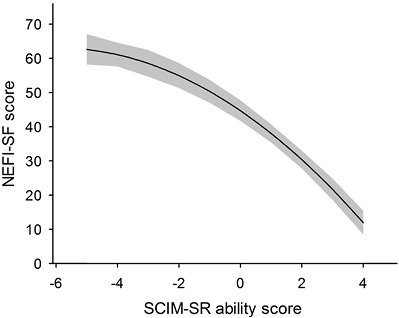
Table IV presents the results of the fractional polynomial regression analysis. The selected predictors explained approximately 22% of the variance in the overall perception of environmental barriers (F (9, 1539) = 48.83, p < 0.001). Males, older participants, those with longer time since SCI and higher SCIM ability scores perceived fewer barriers. NEFI-SF total scores and SCIM ability scores showed a non-linear quadratic relationship (see Fig. 2). All other continuous predictors were found to be linearly related to NEFI-SF. In this adjusted model people with complete paraplegia perceived significantly more barriers than persons with incomplete paraplegia as well as those with complete tetraplegia (Bonferroni adjusted post-hoc Wald test).
|
Table IV. Results of the fractional polynomial regression of Nottwil Environmental Factors Inventory Short Form (NEFI-SF) score on socio-demographic variables. injury characteristics and functional independence scores |
|||
|
NEFI-SF score (0–100) |
Coefficient |
95% confidence interval |
p-value |
|
Gender (referent: female) |
–3.04 |
–5.16; –0.92 |
0.005 |
|
Age, years |
–0.07 |
–0.14; –0.01 |
0.034 |
|
Education, years |
0.20 |
–0.09; 0.50 |
0.173 |
|
Time since SCI, years |
–0.10 |
–0.18; –0.01 |
0.026 |
|
SCIM-SRb |
–0.51 |
–0.57; –0.46 |
< 0.001 |
|
Type of SCI (referent: incomplete paraplegia) |
|
|
< 0.001a |
|
Complete paraplegia |
2.86 |
0.49; 5.23 |
0.018 |
|
Incomplete tetraplegia |
0.16 |
–2.57; 2.89 |
0.907 |
|
Complete tetraplegia |
–2.07 |
–5.53; 1.38 |
0.240 |
|
Aetiology (referent: non-traumatic) |
–0.36 |
–2.87; 2.15 |
0.779 |
|
Intercept |
63.13 |
56.47; 69.80 |
< 0.001 |
|
aGlobal F-test if coefficients differ from each other as well as referent. b(SCIM-SR Rasch ability scores + 6)2. Significant values are shown in bold. |
|||
DISCUSSION
This is the first study of environmental barriers perceived by persons with SCI residing in the Swiss community and the first to use a measure of environmental factors based on the ICF Core Sets for SCI. A significant proportion of participants perceived at least some impact of environmental barriers on their daily life. Most problematic were climatic conditions and the accessibility of public spaces and private buildings, followed by transportation, policies and services, and finances. Personal care assistance, in particular, was an issue for participants with complete tetraplegia. Overall, more than one-fifth of participants reported that social attitudes made their lives at least a little harder. Negative attitudes of families, friends and colleagues were infrequently perceived, but appeared to play a stronger role for women. Women also showed higher NEFI-SF total scores. Notably, participants with non-traumatic injuries perceived substantially more financial barriers than those with traumatic injuries, possibly reflecting a lack of payment by an accident insurance in the case of non-traumatic injury. The overall perception of barriers was particularly associated with self-reported physical independence. The perception of environmental barriers showed a monotonous, but accelerating, decline with increasing physical independence, indicating decreasing amounts of perceived barriers between adjacent levels of SCIM-SR abilities with greater independence. In contrast to the results of univariable analysis indicating a greater perceived impact of barriers for individuals with complete paraplegia or tetraplegia, solely complete paraplegia was associated with a greater perceived impact of barriers when the relationship was controlled for physical independence in multi-variable analysis. While this result may suggest a stronger mediation of the effect of complete lesions through increased physical dependence of people with tetraplegia than those with paraplegia (moderated mediation), it may also point to mechanisms and influencing factors that were not accounted for in the present analysis, e.g. individuals with paraplegia may have higher participation goals. Formal mediation analysis is needed to clarify this issue.
There is limited evidence regarding the impact of environmental barriers on daily living of people with SCI, and meaningful comparison of the existing evidence is challenged by the use of fundamentally different measurement instruments across studies.
In our study the main barriers were climatic conditions, inaccessibility of public buildings and friends and relatives’ homes, transportation, and governmental policies and services. Most studies that provided similar data used the Craig Hospital Environmental Factors Inventory Short Form (CHIEF-SF) and featured US samples of people with traumatic SCI (9, 10, 14) with the exception of 1 study that also examined a Turkish sample (31). In accordance with our findings, the main barriers in those studies included natural environmental conditions (including climate), transportation, and governmental policies and services. The CHIEF-SF, however, does not include items on the accessibility of public and private structures complicating the comparison of overall perception of barriers with our study. Another study (16) examined perceived environmental barriers and facilitators in a sample of 449 Canadian individuals with traumatic SCI, applying the Measure of the Quality of the Environment (MQE). The main perceived obstacles were time to execute a task, climatic conditions, physical accessibility of friends’ residences, and unevenness and nature of terrain. While the NEFI-SF does not collect information on time to execute a task, the other results from Canada confirm our findings regarding the importance of barriers imposed by climatic conditions and lack of accessibility.
Regarding variation in environmental barriers across demographic and injury characteristics, we found a smaller number of perceived barriers in males compared with females, in older people, those with longer time since injury, and in people with greater physical independence. Our results regarding specific barriers in particular indicate that women more frequently perceive attitudinal barriers and people with complete lesions more often reported problems because of issues with accessibility. Similar to our results, Whiteneck et al. (10) found a decreasing perception of barriers with time since injury and physical independence, as measured with the Functional Independence Measure (FIM). Moreover, reports of physical and structural barriers were more pronounced in people with more severe injuries and women perceived more attitudinal barriers. Noreau et al. (16) also found that accessibility is particularly an issue for persons with complete lesions. However, they did not find a consistent relationship with age and time since injury. Silver et al. (32) found that most persons discharged to the community most frequently perceived barriers resulting from lack of equipment and assistance as well as issues with health insurance; problems that may be reduced with increasing time since injury, while other barriers may become more apparent.
Based on our findings, the main aims of Swiss policy makers should be to improve the accessibility of public infrastructure and improve service provision, including personal care assistance for people with tetraplegia. Policies to support persons with non-traumatic aetiologies of SCI should be considered. The particular problems women with SCI face may also deserve more attention.
The current study has several potential limitations. Like the CHIEF or MQE, the NEFI-SF is a measure of the perceived impact of environmental barriers on people’s lives. It relies on self-report rather than on objective measurement of environmental features, such as the height of curbs or the width of doors. Similar critiques related to the subjectivity of measures may thus apply (8). It is, for instance, unclear whether our finding that particular subgroups of people with SCI report more barriers than others is due to actual barriers or differential reporting. However, a survey necessarily relies on self-report and people’s perception is likely to influence their behaviours, e.g. avoiding situations if barriers are anticipated, as well as their quality of life. It should also be emphasized that the NEFI asks about barriers affecting “participation in society”, which presumably omits domestic functioning and general activities of daily living.
Although we adjusted for unit-non response for those in our registry who did not answer the survey, we cannot exclude that non-response was related to the perception of environmental barriers, such as communication devices. We may thus have underestimated the number of barriers perceived by the overall Swiss population with SCI. Given that we attempted to correct for non-response, inference can furthermore only be made for the sampling population, i.e. those people in our registry and not for all people with SCI in Switzerland. Moreover, the present analysis did not include a separate measure of participation. Future studies are anticipated to comprehensively study the relationship of impairment, perceived environmental barriers, and restrictions in participation, considering the possibility of mediation and moderation of the relation between impairment and participation restriction by the environment.
This study has several strengths. It is the first research to comprehensively describe environmental barriers in a Western European sample of persons with SCI living in the community. The study features a large community sample that includes persons with traumatic as well as non-traumatic SCI. In addition, we took care to adjust our analysis for unit and item non-response.
In conclusion, despite living in a rich country with a well-developed social safety net, a significant number of Swiss community dwelling individuals with SCI perceive a negative impact of environmental barriers on their social participation. Most frequently mentioned were climatic conditions, accessibility of infrastructure, and government policies and services. Women, persons with non-traumatic aetiology, and those with limited physical independence seem particularly vulnerable to environmental barriers.
|
Appendix I. Nottwil Environmental Factors Inventory Short Form (NEFI-SF) |
|
||
|
|
|
NEFI-SF |
|
|
Introduction |
|
In daily life one is exposed to diverse external influences (so-called environmental factors) that can make everyday easier or more difficult. |
|
|
|
Which factors made your participation in society a little, or considerably more, difficult in the last four weeks? Please consider how you would like your participation to be. |
||
|
Question Number |
Label |
Question |
Response options |
|
1 |
Public access |
Inaccessible or inadequately accessible public places (e.g. public buildings or parks) |
0 = “no influence“ 1 = “made my life a little harder“ 2 = “made my life a lot harder“ |
|
2 |
Climate |
Unfavourable climatic conditions (e.g. weather, season, temperature, humidity) |
0 = “no influence“ 1 = “made my life a little harder“ 2 = “made my life a lot harder“ |
|
3 |
Social attitudes |
Negative societal attitudes toward persons with disability (e.g. prejudice, ignorance) |
0 = “no influence“ 1 = “made my life a little harder“ 2 = “made my life a lot harder“ |
|
4 |
Attitudes of family |
Negative attitudes of your family and relatives with regards to your disability (e.g. prejudice, lack of support or overprotective behaviour) |
0 = “no influence“ 1 = “made my life a little harder“ 2 = “made my life a lot harder“ |
|
5 |
Attitudes of friends |
Negative attitudes of your friends with regards to your disability (e.g. prejudice, lack of support or overprotective behaviour) |
0 = “no influence“ 1 = “made my life a little harder“ 2 = “made my life a lot harder“ |
|
6 |
Attitudes of colleagues |
Negative attitudes of neighbours, acquaintances and work colleagues with regards to your disability (e.g. prejudice, lack of support or overprotective behaviours) |
0 = “no influence“ 1 = “made my life a little harder“ 2 = “made my life a lot harder“ |
|
7 |
Short-distance transportation |
Lack of, or inadequate, adapted assistive technology for moving around over short distances (e.g. stair lift, walking aids) |
0 = “no influence“ 1 = “made my life a little harder“ 2 = “made my life a lot harder“ |
|
8 |
Long-distance transportation |
Lack of, or inadequate, adapted means of transportation for long distances (e.g. no adapted car or hard to use public transport) |
0 = “no influence“ 1 = “made my life a little harder“ 2 = “made my life a lot harder“ |
|
9 |
Personal care assistance |
Lack of, or inadequate, nursing care and support services (e.g. home health care or personal assistance) |
0 = “no influence“ 1 = “made my life a little harder“ 2 = “made my life a lot harder“ |
|
10 |
Medical supplies |
Lack of, or insufficient, medication and medical aids and supplies (e.g. catheters, disinfectants, splints, pillows) |
0 = “no influence“ 1 = “made my life a little harder“ 2 = “made my life a lot harder“ |
|
11 |
Financial situation |
Problematic financial situation (e.g. shortage of money, lack of governmental support) |
0 = “no influence“ 1 = “made my life a little harder“ 2 = “made my life a lot harder“ |
|
12 |
Communication devices |
Lack of, or inadequate, communication devices (e.g. writing devices, computer, telephone, mouse) |
0 = “no influence“ 1 = “made my life a little harder“ 2 = “made my life a lot harder“ |
|
13 |
F/R home access |
Inaccessibility or inadequate accessibility to the homes of friends and relatives |
0 = “no influence“ 1 = “made my life a little harder“ 2 = “made my life a lot harder“ |
|
14 |
Political decisions |
Inadequate national and cantonal political decisions and governmental services (e.g. problems with disability insurance, lack of equality promotion) |
0 = “no influence“ 1 = “made my life a little harder“ 2 = “made my life a lot harder“ |
REFERENCES

