Jan W. van der Scheer, PhD1, Sonja de Groot, PhD1,2, Marga Tepper, MD3, Willemijn Faber, MD4, ALLRISC*, DirkJan (HEJ) Veeger, PhD5,6 and Lucas H. V. van der Woude, PhD1,3
From the 1University of Groningen, University Medical Center Groningen, Center for Human Movement Sciences,
2Amsterdam Rehabilitation Research Center | Reade, Amsterdam, 3University of Groningen, University Medical Center Groningen, Center for Rehabilitation, Department of Rehabilitation Medicine, 4Heliomare, Rehabilitation Center,
Wijk aan Zee, 5Research Institute MOVE, Faculty of Human Movement Sciences, VU University Amsterdam and
6Department of Mechanical, Maritime and Materials Engineering, Delft University of Technology, Delft, The Netherlands. *ALLRISC group name is provided at the end of the article.
OBJECTIVE: To investigate the effects of low-intensity wheelchair training on wheelchair-specific fitness, wheelchair skill performance and physical activity levels in inactive people with long-term spinal cord injury.
DESIGN: Randomized controlled trial.
PARTICIPANTS: Inactive manual wheelchair users with spinal cord injury for at least 10 years (n = 29), allocated to exercise (n = 14) or no exercise.
METHODS: The 16-week training consisted of wheelchair treadmill-propulsion at 30–40% heart rate reserve or equivalent in terms of rate of perceived exertion, twice a week, for 30 min per session. Wheelchair-specific fitness was determined as the highest 5-s power output over 15-m overground wheelchair sprinting (P5–15m), isometric push-force, submaximal fitness and peak aerobic work capacity. Skill was determined as performance time, ability and strain scores over a wheelchair circuit. Activity was determined using a questionnaire and an odometer.
RESULTS: Significant training effects appeared only in P5–15m (exercise vs control: mean +2.0 W vs –0.7 W, p = 0.017, ru=0.65).
CONCLUSION: The low-intensity wheelchair training appeared insufficient for substantial effects in the sample of inactive people with long-term spinal cord injury, presumably in part owing to a too-low exercise frequency. Effective yet feasible and sustainable training, as well as other physical activity programmes remain to be developed for inactive people with long-term spinal cord injury.
Key words: activities of daily living; paraplegia; physical activity; physical fitness; spinal cord injuries; tetraplegia; rehabilitation; wheelchairs.
J Rehabil Med 2016; 00: 00–00
Correspondence address: Sonja de Groot, Reade Locatie Overtoom, DNO, PO Box 58271, NL-1040 HG Amsterdam, The Netherlands. E-mail: s.d.groot@reade.nl
Accepted Sep 10, 2015; Epub ahead of print Nov 26, 2015
INTRODUCTION
Many people with long-term spinal cord injury (SCI) are physically inactive and deconditioned (1–3). This can be the result of muscle paralysis, impairments in the autonomic nervous system and wheelchair dependence (4). Deconditioning can be reflected in lower physical fitness measured during manual wheelchair propulsion tests, defined as wheelchair-specific fitness (3). Lower wheelchair-specific fitness in people with SCI has been associated not only with reduced cardiovascular health (5), wheelchair skill performance (6) and physical activity levels (7), but also with impaired participation and quality of life (8, 9). Another cause of lower wheelchair-specific fitness could be reduced physical activity levels owing to secondary health complications, such as pressure ulcers and joint pain (10). Increased risk of such complications has been associated with a longer time since injury (11, 12). Low wheelchair-specific fitness can therefore be expected in inactive people with long-term SCI (3, 13).
Wheelchair-specific fitness of people with SCI can improve through wheelchair ergometer or treadmill training performed more than twice a week at a moderate to vigorous intensity (14). Such an exercise intensity and frequency, however, may lead to low adherence, dropout and increased risk of musculoskeletal injury in community-dwelling people with long-term SCI who are inactive or deconditioned (15–18). Better feasibility and adherence, as well as less risk of injury, can be expected in low-intensity wheelchair exercise performed twice a week for 30 min (15–20).
It has been suggested that inactive or deconditioned people may benefit from exercise at a low intensity, frequency and duration (15). Evidence is, for example, found in low-intensity lower-body training in inactive groups with relatively low fitness levels: improved fitness was found after exercise at only 25–40% heart rate reserve (HRR), 3–5 times per week for 14–45 min per session (21–24). Promising effects are also indicated by the large fitness improvements in able-bodied novices performing low-intensity wheelchair training (20, 25, 26). For example, 7 weeks of low-intensity wheelchair exercise performed 3 times per week for 30 min was found to improve wheelchair-specific peak aerobic work capacity by 34%, submaximal fitness by 17% and anaerobic work capacity by 31% (20). These fitness improvements could, at least in part, be the result of adaptations in aerobic and anaerobic energy systems (19). It remains to be investigated whether fitness improvements occur in inactive people with long-term SCI performing 16 weeks of low-intensity wheelchair exercise at a feasible twice-weekly frequency and 30-min sessions.
In inactive people with long-term SCI, moderate associations were found among test outcomes reflecting aerobic, lactic and alactic energy systems (r = 0.50–0.79) (3). This could imply that low-intensity wheelchair training, if effective, might lead to improvements in various wheelchair-specific fitness components.
The aim of this randomized controlled trial (RCT) was to investigate the effects of low-intensity wheelchair training on wheelchair-specific fitness (peak aerobic work capacity, submaximal fitness, anaerobic work capacity and isometric strength), wheelchair skill performance and physical activity levels in inactive people with long-term spinal cord injury. An exercise group followed a 16-week training consisting of wheelchair treadmill-propulsion at 30–40% HRR or its equivalent in rate of perceived exertion (RPE), twice a week, for 30 min per session, while a control group was not offered any intervention. Improvements were expected in the exercise group, in contrast to the control group, based on the positive findings in other populations performing training at a low intensity, frequency and duration (20–26).
METHODS
Ethical approval and trial registration
Ethical approval was obtained from committees of the VU University Medical Center (Amsterdam, the Netherlands) and rehabilitation centres (Heliomare, Wijk aan Zee, the Netherlands; University Medical Center Groningen, Groningen, the Netherlands) (19). The study was registered in the Dutch Trial Register (www.trialregister.nl, NTR3037).
Design
In this RCT, an exercise group was compared with a control group that was not offered any intervention (19). Measurements were performed in both groups at baseline (T1), 8 weeks after baseline (T2) and 16 weeks after baseline (T3). Exercise and measurements took place in 2 SCI-specialized rehabilitation centres in the Netherlands. The investigators randomly allocated participants to 1 of the 2 groups, using sealed envelopes. The size of the randomization blocks varied: blocks of 5 or 10 in 1 centre, and 3 or 6 in the other centre (19). The set-up did not allow blinding of the investigators conducting measurements, as they were also needed to monitor whether training was administered according to protocol.
Participants
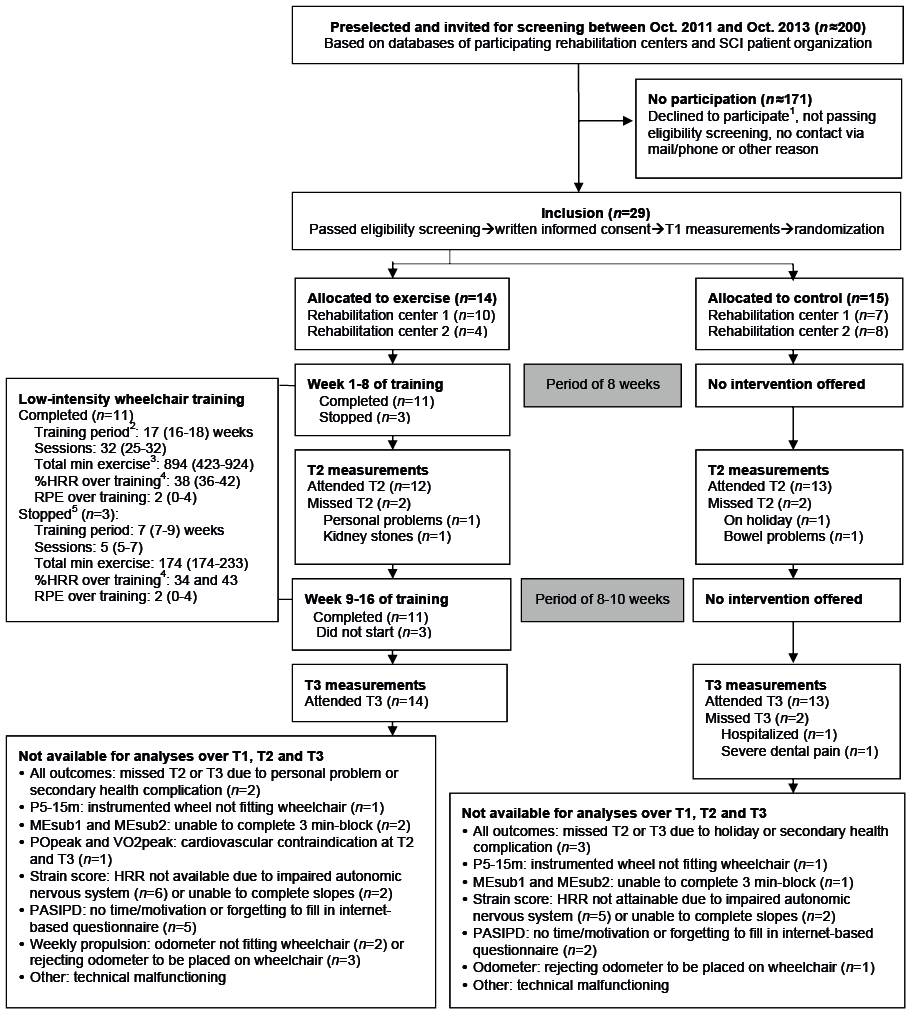
Participants were inactive, community-dwelling manual wheelchair users with long-term SCI (Table I). Paramedical research assistants used patient databases to preselect potentially eligible people (Fig. 1). Included were those eligible and agreeing to participate based on written informed consent (19).
|
Table I. Participant characteristics at baseline |
||||
|
Total n |
Exercise n |
Control n |
Exercise vs Control pa |
|
|
Group size |
29 |
14 |
15 |
|
|
Men/women |
22/7 |
12/2 |
10/5 |
0.39 |
|
Paraplegia/tetraplegiab |
20/9 |
9/5 |
11/4 |
0.70 |
|
Complete/incompleteb |
20/9 |
10/4 |
10/5 |
1.00 |
|
AIS A/B/C/Db |
17/3/7/2 |
9/1/4/0 |
8/2/3/2 |
NA |
|
C4–6/C7–8/Th1–9/Th10–L5 |
5/4/13/7 |
3/2/5/4 |
2/2/8/3 |
NA |
|
Median (IQR) |
Median (IQR) |
Median (IQR) |
||
|
Age, years |
57 (45–63) |
55 (42–64) |
57 (46–62) |
0.72 |
|
Height, m |
1.80 (1.69–1.86) |
1.80 (1.71–1.87) |
1.78 (1.68–1.86) |
0.53 |
|
Body mass, kg |
88 (78–100) |
88 (81–99) |
88 (73–100) |
0.62 |
|
BMI, kg/m2 |
28 (25–32) |
28 (25–30) |
27 (23–33) |
0.59 |
|
Time since injury, years |
17 (14–29) |
16 (13–29) |
20 (14–31) |
0.35 |
|
Age at onset SCI (years) |
30 (23–44) |
30 (25–49) |
31 (20–44) |
0.59 |
|
aStatistical comparison based on Fisher’s tests and Mann-Whitney U tests. bParaplegia: lesion < Th1; motor complete/incomplete lesion (40). AIS: ASIA impairment scale; IQR: interquartile range; BMI: body mass index; SCI: spinal cord injury; MET: metabolic equivalent; NA: not applicable. |
||||
Inclusion criteria were: time since injury > 10 years, and inactivity as defined by a reference score of < 30 metabolic equivalent (MET) h/week on the Dutch Physical Activity Scale for Individuals with Physical Disabilities (PASIPD) (27). The original inclusion criteria (19) for age and age at onset SCI were changed to increase the sample size (age ≤ 65 to ≤ 67 years; age at onset ≥ 18 to ≥ 12 years). This was performed 1 year after inclusion started; databases were searched again with the changed criteria.
Exclusion criteria were: cardiovascular contraindications for exercise, progressive disease, psychiatric problems, insufficient mastery of Dutch language and plans to change lifestyle (19). Furthermore, people were excluded if they reported severe musculoskeletal complaints that might worsen due to the training, as assessed by the paramedic research assistant.
Training
The exercise group followed a 16-week low-intensity wheelchair training, consisting of supervised wheelchair propulsion on a treadmill in a rehabilitation centre, twice a week, 30 min per session. Relative exercise intensity was 30–40% HRR or an equivalent in RPE (1–3 on a 10-point scale), the latter used in participants with an impaired autonomic nervous system (18, 28). A trained paramedical research assistant continuously monitored relative intensity, which was maintained during exercise by changing treadmill velocity or weight in a pulley system. The assistant also monitored musculoskeletal complaints during and after exercise using a local perceived discomfort (LPD) scale (19). Training would be stopped if such complaints or other adverse events appeared.
Protocols consisted of 924 min of total exercise: 18 or 24 min of exercise in the first 4 sessions and 30 min of exercise in the subsequent 28 sessions. Exercise was continuous in participants with the highest baseline fitness levels, while those with lower levels followed protocols with intermittent exercise (4 × 7.5 or 10× 3 min with 1–2 min rest intervals) (19). Exercise and rest intervals were further individualized in participants with the lowest fitness levels. If participants missed a session, it could be made up using an extra session in 1 of the following weeks or by extending the training period up to 18 weeks.
Measurement procedures and outcomes
Standardized measurement procedures (19) consisted of exercise and wheelchair skill tests in participants’ own wheelchairs, in addition to determining physical activity levels over the week after the exercise tests.
Wheelchair-specific fitness. Wheelchair-specific fitness was assessed based on peak aerobic work capacity, submaximal fitness, anaerobic work capacity and isometric strength. Exercise tests were conducted in participants’ own wheelchairs using a standardized procedure (19).
Peak aerobic work capacity was determined using a peak incremental treadmill test, similar to a protocol previously used in SCI cohort studies (29). The inclination angle of the treadmill increased every minute by approximately 0.3 degrees until the participant could no longer maintain treadmill velocity. Treadmill velocity was identical to that in the submaximal blocks. A respiratory exchange ratio >1.00 was used as the criterion for peak performance (29). Peak aerobic work capacity was determined as the highest power output maintained for at least 30 s (POpeak) and the highest 30-s mean oxygen uptake (VO2peak).
Submaximal fitness was determined as mean mechanical efficiency (%) over the last 30 s of 2 × 3-min submaximal exercise blocks (29). The protocol was similar to that in previous SCI cohort studies (29). The 2 blocks were performed on a treadmill at different inclination angles (0% or 0.5–0.6%). Predetermined treadmill velocity was < 0.56, 0.56, 0.83 or 1.11 m/s. A respiratory exchange ratio ≤ 1.00 was used as the criterion for submaximal propulsion (29).
Anaerobic work capacity was determined as the highest mean unilateral power output over successive 5-s intervals in a 15-m overground wheelchair sprint test (P5–15m [W]). P5-15m was validated in a preliminary study in able-bodied people (30). The test was conducted with the rear wheels of the participant’s wheelchair replaced with instrumented wheels used to determine power output (OptiPush, MAX Mobility, Antioch, CA, USA).
Isometric strength was determined as the highest mean consecutive 3-s force interval over 3 successful trials of an isometric-push test (Fiso [N]) (3). A participant’s wheelchair was attached to the wall via a rope and force transducer, after which the participant performed a maximal isometric-wheelchair push for 5 s with the hands on top of the handrims of the wheelchair.
Wheelchair skill performance. Wheelchair skill performance was determined as performance time, ability score and strain score over the wheelchair circuit, a validated test battery used in previous SCI cohort studies (6, 9). Participants used their own wheelchair to perform 8 items: figure-of-eight circuit, 15-m sprint, crossing a doorstep, mounting a platform, transfer, 10-s propulsion on 2 slopes (3% and 6%) and 3 min of consecutive treadmill propulsion. Performance time was time over the 15-m sprint and figure-of-eight circuit (s). Ability score was the number of completed items (range 0–8). Strain score was mean % HRR over the 2 slopes. The strain score was determined only in participants without an impaired autonomic nervous system able to perform both slopes.
Physical activity levels. Physical activity levels were determined as metabolic equivalent [MET] using the PASIPD (h/week on a 0–180 scale) (27) and propelled distance in a week in the community (km), assessed using an odometer placed on a participant’s daily wheelchair (19).
Training. Mean % HRR and RPE were determined over the last continuous exercise bout of each session. The mean over these values represented relative intensity over the training period. Upper-body LPD in a session was reflected by the summed scores of all upper-body regions, rated on a 0–10 scale (19), assessed immediately after the last exercise bout. Session RPE on a 0–10 scale was assessed 7 min after the last exercise bout (19, 28). Power output and velocity in a session were reflected by mean power output and treadmill velocity over the last exercise bout. Participants rated perceived effects of the total training on fitness, wheelchair skill performance and physical activity levels using 5-point scales (1 = worsened a lot; 2 = somewhat worsened; 3 = not changed; 4 = somewhat improved; and 5 = improved a lot).
Sample size
Previous training studies in able-bodied people and people with tetraplegia (18, 20) were used to estimate required sample size, based on the primary outcome POpeak. With a 2-tailed α of 0.05 and power (1-β) of 0.80, group sizes were estimated at n = 18 to detect a difference of 8.8 W between groups over follow-up measurements.
Statistics
Two-tailed tests with a significance level of 0.05 were used in all analyses. A non-parametric model was used given the skewed data distributions of many group differences. The sample size did not allow adjustment for covariates. Fisher’s and Mann-Whitney U tests were used to gain some insight into chance imbalances between the groups at baseline that could influence training effects.
Training effects were evaluated by comparing the exercise and control group in differences over time in the primary outcome (POpeak) and the other secondary outcomes: difference scores were calculated for each participant over 8 and 16 weeks (ΔT2–T1 and ΔT3–T1), which were compared between groups using Mann-Whitney U tests. Bonferroni corrections were applied based on the number of Mann-Whitney U tests used to evaluate outcomes within peak aerobic work capacity (p-value/4), submaximal fitness (p-value/4), anaerobic work capacity (p-value /2), isometric strength (p-value /2), wheelchair skill (p-value /6) and activity levels (p-value/4). Effect sizes were based on non-parametric rank order correlations (rU=1 – [2U – nexercise * ncontrol]) (31). When rU = 0, an equal number of participants in both groups improved relative to each other. When rU < 0, more participants in the control group had a larger improvement than those in the exercise group. Effect sizes indicating large training effects were considered as rU= 0.80–1.00, moderate as rU= 0.50–0.80, and small as rU= 0.20–0.50.
Excluded from analyses of training effects were participants with missing data at T2 and/or T3. To evaluate potential bias on analyses, baseline outcomes of excluded participants were compared with those of included participants, using Mann-Whitney U tests. Participants who stopped training, but still performed measurements were included in analyses, in accordance with the intention-to-treat principle. Outcomes of these participants were excluded in exploratory analyses identical to those described above.
Friedman’s analysis of variance (ANOVA) and Wilcoxon signed-rank tests were used to analyse the exercise group’s changes in upper-body LPD, session RPE, power output and velocity over the training’s fifth, 16th and last session (Bonferroni corrected: p-value/3).
RESULTS
Participants
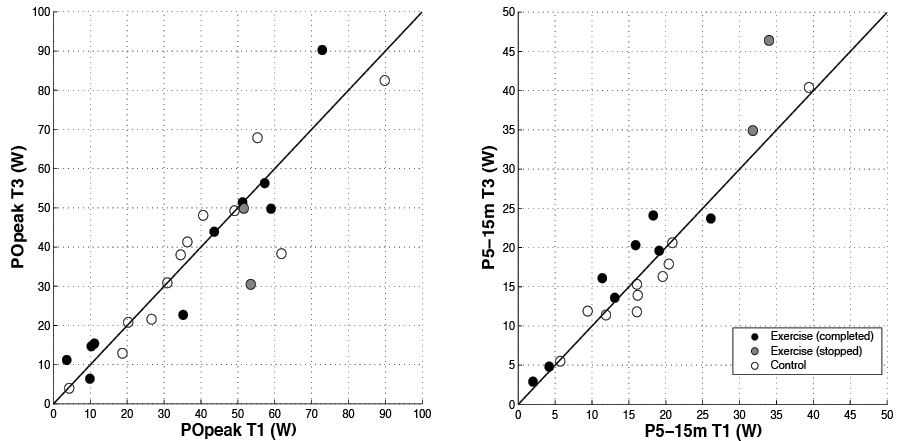
Approximately 170 of the 200 potentially eligible subjects declined to participate or did not meet criteria (Fig. 1), so the intended group sizes of 18 participants could not be fulfilled. The included group of 29 participants comprised approximately one-quarter women, approximately one-third of the group had a tetraplegia, while the majority was middle-aged and active for less than 10 MET h/week (Table I). Randomization resulted in an exercise group of n = 14 and a control group of n = 15. The groups did not differ significantly in characteristics and outcomes at baseline (Tables I and II). Large within-group variance was found in all characteristics and outcomes (Tables I–IV and Fig. 2).
|
Table II. Descriptives and analyses of training effects in the primary outcome (POpeak) and the secondary outcomes of wheelchair-specific fitness, wheelchair skill performance and physical activity levels |
|||||||||||||
|
Exercise |
Control |
Δ Exercise |
Δ Control |
Exercise vs Control |
|||||||||
|
Median (IQR) |
n |
Median (IQR) |
n |
Median (IQR) |
Median (IQR) |
p |
|
rU |
|||||
|
Peak aerobic work capacity |
|||||||||||||
|
POpeak |
T1b |
47.5 (10.2, 54.5) |
14 |
38.4 (25.0, 57.0) |
14 |
0.87 |
|||||||
|
(W) |
T1 |
43.6 (10.3, 57.3) |
11 |
35.4 (25.0, 56.9) |
10 |
0.92 |
|||||||
|
T2 |
37.7 (14.5, 54.1) |
11 |
43.9 (26.2, 50.3) |
10 |
0.3 (–4.8, 4.1) |
0.4 (–2.2, 2.8) |
0.65 |
–0.12 |
|||||
|
T3 |
43.9 (14.7, 51.4) |
11 |
38.1 (21.4, 53.9) |
10 |
–0.4 (–6.4, 4.4) |
0.1 (–5.4, 4.3) |
0.92 |
0.04 |
|||||
|
VO2peak |
T1b |
1.51 (0.59, 1.77) |
13 |
1.14 (0.89, 1.61) |
15 |
0.75 |
|||||||
|
(l/min) |
T1 |
1.02 (0.57, 1.66) |
10 |
1.09 (0.86, 1.34) |
10 |
0.91 |
|||||||
|
T2 |
1.02 (0.70, 1.62) |
10 |
1.09 (0.85, 1.31) |
10 |
0.01 (–0.06, 0.15) |
0.00 (–0.14, 0.06) |
0.84 |
0.07 |
|||||
|
T3 |
1.01 (0.59, 1.49) |
10 |
1.07 (0.88, 1.30) |
10 |
0.05 (–0.21, 0.07) |
–0.07 (–0.19, 0.04) |
0.99 |
0.01 |
|||||
|
Submaximal fitness |
|||||||||||||
|
MEsub1 |
T1b |
4.9 (3.5, 6.1) |
11 |
4.1 (3.4, 5.4) |
14 |
0.50 |
|||||||
|
(%) |
T1 |
5.0 (3.5, 6.9) |
9 |
4.0 (2.8, 5.8) |
8 |
0.44 |
|||||||
|
T2 |
5.3 (3.6, 6.3) |
9 |
3.6 (2.6, 5.9) |
8 |
0.5 (–0.5, 1.2) |
–0.2 (–0.7, –0.1) |
0.20 |
0.39 |
|||||
|
T3 |
5.1 (3.6, 6.7) |
9 |
3.9 (2.5, 6.1) |
8 |
0.0 (–0.8, 0.5) |
0.2 (–0.8, 0.8) |
0.69 |
0.11 |
|||||
|
MEsub2 |
T1b |
5.2 (3.4, 6.4) |
11 |
4.6 (3.3, 6.3) |
14 |
0.57 |
|||||||
|
(%) |
T1 |
5.2 (3.5, 7.6) |
9 |
4.6 (2.8, 6.3) |
8 |
0.67 |
|||||||
|
T2 |
5.4 (4.2, 7.4) |
9 |
3.3 (2.7, 6.6) |
8 |
0.5 (–0.2, 1.8) |
–0.5 (–1.4, 0.0) |
0.08 |
0.51 |
|||||
|
T3 |
5.4 (3.7, 7.6) |
9 |
4.5 (2.7, 6.4) |
8 |
0.0 (–0.4, 0.4) |
0.0 (–0.8, 0.8) |
0.98 |
0.01 |
|||||
|
Anaerobic work capacity |
|||||||||||||
|
P5–15m |
T1b |
14.5 (7.9, 24.3) |
12 |
16.2 (11.9, 20.9) |
11 |
0.32 |
|||||||
|
(W) |
T1 |
15.9 (7.8, 22.6) |
9 |
16.1 (10.7, 20.0) |
9 |
0.71 |
|||||||
|
T2 |
17.7 (10.1, 23.9) |
9 |
15.8 (11.6, 18.9) |
9 |
1.5 (–0.3, 2.5) |
–0.1 (–1.0, 0.9) |
0.26 |
0.33 |
|||||
|
T3 |
19.6 (9.2, 23.9) |
9 |
13.9 (11.6, 17.1) |
9 |
2.0 (0.5, 4.7) |
–0.7 (–2.5, –0.2) |
0.02* |
0.65 |
|||||
|
Isometric strength |
|||||||||||||
|
Fiso |
T1b |
516 (179, 659) |
14 |
335 (284, 539) |
14 |
0.54 |
|||||||
|
(N) |
T1 |
532 (215, 670) |
12 |
334 (284, 538) |
10 |
0.41 |
|||||||
|
T2 |
392 (212, 524) |
12 |
372 (205, 493) |
10 |
–57 (–87, 3) |
–36 (–65, –10) |
0.38 |
–0.23 |
|||||
|
T3 |
392 (200, 585) |
12 |
335 (237, 441) |
10 |
–27 (93, 4) |
–51 (–89, 15) |
0.67 |
0.12 |
|||||
|
Wheelchair skill performance |
|||||||||||||
|
Performance time (s) |
T1b |
20.5 (14.5, 28.3) |
14 |
17.6 (16.3, 20.9) |
15 |
0.56 |
|||||||
|
T1 |
20.5 (15.3, 27.1) |
12 |
17.2 (16.4, 21.2) |
12 |
0.62 |
||||||||
|
T2 |
20.1 (14.6, 26.1) |
12 |
17.1 (16.3, 21.9) |
12 |
–0.9 (–1.6, –0.3) |
–0.1 (–1.4, 0.5) |
0.12 |
0.38 |
|||||
|
T3 |
18.2 (14.3, 24.7) |
12 |
17.2 (16.6, 21.2) |
12 |
–1.4 (3.8, –0.5) |
0.0 (–1.2, 0.8) |
0.04 |
0.50 |
|||||
|
Ability score (0–8) |
T1b |
6.8 (3.9, 8.0) |
14 |
7.5 (6.5, 8.0) |
15 |
0.29 |
|||||||
|
T1 |
6.8 (4.3, 8.0) |
12 |
7.8 (6.5, 8.0) |
12 |
0.27 |
||||||||
|
T2 |
7.3 (5.0, 8.0) |
12 |
7.0 (6.5, 8.0) |
12 |
0.0 (0.0, 0.5) |
0.0 (–0.5, 0.0) |
0.07 |
0.42 |
|||||
|
T3 |
7.3 (5.0, 8.0) |
12 |
7.3 (6.5, 8.0) |
12 |
0.0 (0.0, 1.0) |
0.0 (0.0, 0.0) |
0.10 |
0.36 |
|||||
|
Strain score (% HRR) |
T1b |
33 (25, 42) |
8 |
26 (–2, –40) |
8 |
0.65 |
|||||||
|
T1 |
33 (4, 44) |
3 |
16 (–14, –56) |
5 |
0.79 |
||||||||
|
T2 |
31 (25, 54) |
3 |
21 (18, 51) |
5 |
–10 (–14, 22) |
3 (–19, 39) |
1.00 |
–0.07 |
|||||
|
T3 |
50 (28, 61) |
3 |
17 (12, 56) |
5 |
1 (4, 16.4) |
1 (–21, 37) |
0.79 |
–0.20 |
|||||
|
Physical activity levels |
|||||||||||||
|
PASIPD (MET h/week) |
T1b |
6.4 (1.7, 9.0) |
12 |
10.6 (6.9, 17.4) |
15 |
0.07 |
|||||||
|
T1 |
5.3 (1.9, 8.5) |
7 |
9.3 (4.1, 14.7) |
10 |
0.16 |
||||||||
|
T2 |
8.6 (2.2, 20.6) |
7 |
6.1 (2.1, 12.1) |
10 |
0.6 (–3.1, 11.4) |
–1.4 (–6.1, 5.1) |
0.19 |
0.40 |
|||||
|
T3 |
6.6 (2.3, 10.4) |
7 |
6.4 (2.4, 20.3) |
10 |
1.2 (–5.3, 2.7) |
0.6 (–4.5, 6.5) |
0.74 |
0.11 |
|||||
|
Distance (km/week) |
T1b |
9.0 (2.7, 16.3) |
10 |
15.9 (5.2, 37.0) |
13 |
0.28 |
|||||||
|
T1 |
7.4 (0.0, 13.2) |
7 |
5.9 (4.3, 54.8) |
9 |
0.97 |
||||||||
|
T2 |
6.7 (4.0, 10.0) |
7 |
11.8 (4.1, 29.2) |
9 |
1.8 (0.3, 2.6) |
0.5 (–3.2, 5.7) |
1.00 |
–0.02 |
|||||
|
T3 |
4.9 (0.0, 7.6) |
7 |
15.0 (4.7, 27.5) |
9 |
–1.6 (–5.4, –0.3) |
1.6 (–1.3, 8.0) |
0.29 |
–0.33 |
|||||
|
*Significant difference between the exercise and control group in Mann-Whitney U test after Bonferroni correction. T1b represents outcomes of all participants with baseline data. T1, T2 and T3 represent outcomes of participants included in analyses (no missing data at T1, T2 or T3). Baseline outcomes did not differ significantly between participants included vs excluded in analyses (see p at T1b), nor did they between the included exercising and control participants (see p at T1) as based on Mann-Whitney U tests (p < 0.05). Mann-Whitney U tests with Bonferroni corrections for the number of comparisons within a fitness component were used to compare difference scores ΔT2–T1 and ΔT3–T1 between the groups (see p at T2 and T3), while effect sizes rU were based on non-parametric rank order correlations (31). rU: effect size (31); IQR: interquartile range; POpeak: peak power output; VO2peak: peak oxygen uptake; MEsub1 and MEsub2: mechanical efficiency; P5–15m: 5-s peak power output over a 15-m overground sprint. Fiso: 3-s peak force over a 5-s isometric push. Perf. Time: performance time; HRR: heart rate reserve; PASIPD: Physical Activity Scale for Individuals with Physical Disabilities (27); MET: metabolic equivalent. |
|||||||||||||
|
Table III. Wheelchair-specific fitness of individual participants. Blank space indicates missing data (see Fig. 1). Data sorted in ascending order of POpeak at T1 |
|||||||||||||||||||||||
|
POpeak (W) |
VO2peak (L/min) |
MEsub1 (%) |
MEsub2 (%) |
P5–15m (W) |
Fiso (N) |
||||||||||||||||||
|
T1 |
T2 |
T3 |
T1 |
T2 |
T3 |
T1 |
T2 |
T3 |
T1 |
T2 |
T3 |
T1 |
T2 |
T3 |
T1 |
T2 |
T3 |
||||||
|
Exercise |
|||||||||||||||||||||||
|
1 |
3.6 |
5.7 |
11.2 |
0.39 |
0.61 |
0.66 |
1.7 |
190 |
209 |
256 |
|||||||||||||
|
2a |
6.6 |
7.8 |
131 |
92 |
|||||||||||||||||||
|
3 |
9.9 |
5.2 |
6.4 |
0.53 |
0.36 |
0.27 |
4.6 |
2.0 |
2.1 |
2.9 |
93 |
109 |
86 |
||||||||||
|
4 |
10.3 |
14.5 |
14.7 |
0.58 |
0.73 |
0.6 |
3.1 |
3.6 |
5.1 |
3.6 |
4.1 |
5.8 |
8.1 |
141 |
168 |
145 |
|||||||
|
5 |
11.1 |
14.9 |
15.4 |
0.78 |
0.72 |
0.72 |
3.8 |
3.6 |
4.1 |
4.1 |
4.3 |
4.0 |
4.2 |
6.5 |
4.8 |
289 |
220 |
255 |
|||||
|
6 |
35.2 |
33.6 |
22.7 |
0.60 |
0.79 |
0.57 |
8.3 |
6.0 |
6.7 |
11.4 |
6.2 |
8.7 |
10.7 |
466 |
421 |
181 |
|||||||
|
7 |
43.6 |
37.7 |
43.9 |
1.27 |
1.25 |
1.32 |
6.1 |
6.6 |
6.7 |
6.5 |
7.6 |
7.0 |
13.1 |
13.8 |
13.6 |
653 |
218 |
303 |
|||||
|
8 |
51.3 |
44.7 |
51.4 |
1.96 |
2.09 |
4.9 |
3.2 |
5.6 |
3.2 |
26.1 |
24.5 |
23.7 |
598 |
517 |
560 |
||||||||
|
9a |
51.6 |
51.9 |
49.9 |
1.62 |
1.49 |
1.30 |
5.1 |
6.1 |
5.1 |
5.2 |
7.2 |
5.4 |
31.8 |
27.4 |
34.9 |
704 |
694 |
683 |
|||||
|
10a |
53.5 |
30.5 |
1.78 |
1.25 |
3.5 |
6.1 |
3.2 |
6.6 |
34.0 |
46.4 |
567 |
552 |
|||||||||||
|
11 |
53.6 |
1.67 |
4.0 |
2.6 |
3.1 |
3.3 |
3.1 |
3.4 |
19.1 |
20.6 |
19.6 |
614 |
527 |
521 |
|||||||||
|
12 |
57.3 |
61.6 |
56.3 |
1.51 |
1.57 |
1.44 |
5.0 |
5.2 |
5.1 |
5.6 |
5.3 |
5.4 |
18.3 |
23.4 |
24.1 |
936 |
465 |
594 |
|||||
|
13 |
59.0 |
54.2 |
49.8 |
1.77 |
1.78 |
1.62 |
3.3 |
5.3 |
2.8 |
3.4 |
5.4 |
3.4 |
11.4 |
14.4 |
16.1 |
677 |
642 |
732 |
|||||
|
14 |
72.9 |
78.2 |
90.3 |
2.03 |
1.97 |
2.12 |
7.7 |
9.4 |
7.3 |
8.8 |
10.6 |
8.3 |
15.9 |
17.7 |
20.3 |
451 |
364 |
480 |
|||||
|
Control |
|||||||||||||||||||||||
|
1 |
4.3 |
4.7 |
4.0 |
0.48 |
0.51 |
0.41 |
1.4 |
1.2 |
1.7 |
1.4 |
1.3 |
2.4 |
125 |
122 |
110 |
||||||||
|
2 |
18.7 |
12.9 |
0.86 |
0.58 |
3.8 |
2.9 |
3.8 |
3.2 |
5.0 |
211 |
196 |
||||||||||||
|
3 |
20.3 |
20.6 |
20.8 |
1.14 |
0.89 |
0.86 |
4.2 |
4.0 |
3.5 |
4.8 |
3.3 |
4.0 |
5.7 |
6.2 |
5.5 |
284 |
178 |
221 |
|||||
|
4 |
26.6 |
28 |
21.6 |
1.04 |
1.3 |
1.01 |
3.5 |
3.1 |
4.3 |
4.3 |
3.3 |
5.0 |
9.4 |
9.6 |
11.9 |
413 |
382 |
352 |
|||||
|
5 |
28.5 |
29.6 |
1.04 |
0.88 |
0.97 |
5.1 |
3.8 |
4.9 |
4.2 |
16.2 |
15.8 |
13.9 |
419 |
401 |
|||||||||
|
6 |
30.9 |
33.4 |
30.9 |
0.76 |
0.76 |
0.89 |
2.6 |
2.7 |
2.7 |
2.4 |
2.8 |
3.0 |
11.9 |
14 |
11.4 |
284 |
215 |
243 |
|||||
|
7 |
34.5 |
47.7 |
38.0 |
1.52 |
1.26 |
4.5 |
4.5 |
5.4 |
4.6 |
16.1 |
18.8 |
11.8 |
332 |
363 |
247 |
||||||||
|
8 |
36.3 |
46.0 |
41.3 |
0.89 |
1.10 |
1.19 |
7.3 |
6.1 |
6.2 |
8.2 |
6.8 |
7.1 |
20.9 |
20.6 |
1,113 |
1,077 |
464 |
||||||
|
9 |
40.6 |
48.1 |
1.13 |
1.07 |
1.14 |
3.9 |
7.0 |
3.3 |
5.8 |
19.6 |
19.1 |
16.3 |
384 |
280 |
|||||||||
|
10 |
41.2 |
40.2 |
1.32 |
1.24 |
4.9 |
4.4 |
5.6 |
5.1 |
20.3 |
334 |
146 |
||||||||||||
|
11 |
49.1 |
46.5 |
49.3 |
1.24 |
1.25 |
1.22 |
5.2 |
5.1 |
6.0 |
6.3 |
6.0 |
6.5 |
16.1 |
13.7 |
15.3 |
336 |
285 |
317 |
|||||
|
12 |
55.3 |
58.2 |
67.9 |
1.84 |
2.05 |
3 |
3.8 |
3.3 |
4.1 |
20.4 |
16.6 |
17.9 |
303 |
428 |
371 |
||||||||
|
13 |
61.8 |
41.7 |
38.3 |
1.63 |
1.35 |
1.53 |
3.8 |
2.5 |
2.4 |
4.2 |
2.6 |
2.6 |
22.5 |
7.5 |
525 |
476 |
433 |
||||||
|
14 |
70.6 |
1.61 |
7.1 |
6.3 |
34.1 |
687 |
|||||||||||||||||
|
15 |
89.8 |
86.6 |
82.5 |
1.94 |
2.01 |
1.78 |
6 |
6.5 |
6.7 |
6.3 |
6.9 |
6 |
39.4 |
39.3 |
40.4 |
576 |
542 |
568 |
|||||
|
aStopped training after 7–9 sessions (see Fig. 1). See Table II for abbreviations. |
|||||||||||||||||||||||
|
Table IV. Outcomes representing wheelchair skill performance and physical activity levels. |
|||||||||||||||||||
|
Performance time (s) |
Ability score (0–8) |
Strain score (% HRR) |
Distance (km/week) |
PASIPD (MET h/week) |
|||||||||||||||
|
T1 |
T2 |
T3 |
T1 |
T2 |
T3 |
T1 |
T2 |
T3 |
T1 |
T2 |
T3 |
T1 |
T2 |
T3 |
|||||
|
Exercise |
|||||||||||||||||||
|
1 |
39.4 |
27.7 |
25.7 |
2.0 |
3.0 |
4.0 |
3.6 |
5.4 |
2.8 |
1.9 |
31.7 |
16.6 |
|||||||
|
2a |
28.3 |
26.8 |
3.5 |
2.0 |
0.9 |
||||||||||||||
|
3 |
68.9 |
43.5 |
43.3 |
2.0 |
2.0 |
3.0 |
0.0 |
1.0 |
0.0 |
0.3 |
1.4 |
3.4 |
|||||||
|
4 |
20.2 |
21.5 |
21.0 |
4.0 |
5.0 |
5.0 |
62 |
48 |
7.4 |
10 |
4.9 |
5.3 |
2.2 |
0.8 |
|||||
|
5 |
28.6 |
27.9 |
26.3 |
5.0 |
5.0 |
5.0 |
8.0 |
7.7 |
7.6 |
8.5 |
8.6 |
2.3 |
|||||||
|
6 |
22.5 |
20.9 |
19.8 |
6.5 |
6.5 |
8.0 |
44 |
31 |
61 |
10.1 |
4.2 |
2.7 |
6.6 |
||||||
|
7 |
21.6 |
21.2 |
21.5 |
6.5 |
7.5 |
6.0 |
4 |
54 |
50 |
7.5 |
4.4 |
||||||||
|
8 |
20.8 |
19.2 |
16.6 |
7.0 |
7.0 |
7.0 |
31 |
36 |
3.4 |
4.1 |
|||||||||
|
9a |
15.1 |
14.2 |
14.2 |
8.0 |
8.0 |
8.0 |
33 |
18 |
13.2 |
6.7 |
7.0 |
1.6 |
13.0 |
||||||
|
10a |
11.3 |
11.8 |
8.0 |
7.0 |
46 |
44 |
73.7 |
42.5 |
12.5 |
||||||||||
|
11 |
12.7 |
14.0 |
12.2 |
8.0 |
8.0 |
8.0 |
24 |
19.3 |
13.8 |
9.2 |
20.6 |
10.4 |
|||||||
|
12 |
15.9 |
15.7 |
14.6 |
8.0 |
8.0 |
8.0 |
33 |
25 |
28 |
15.3 |
17.6 |
17.1 |
8.0 |
15.5 |
9.0 |
||||
|
13 |
18.3 |
17.5 |
14.5 |
7.5 |
7.5 |
7.5 |
27 |
29 |
0.0 |
4.0 |
0.0 |
20.0 |
19.0 |
||||||
|
14 |
12.5 |
11.0 |
11.6 |
8.0 |
8.0 |
8.0 |
34 |
7 |
57.1 |
12 |
8.9 |
||||||||
|
Control |
|||||||||||||||||||
|
1 |
72.1 |
69.0 |
53.3 |
3.0 |
4.0 |
3.0 |
5.5 |
8 |
5.5 |
4.4 |
|||||||||
|
2 |
22.3 |
25.1 |
5.5 |
5.5 |
3.6 |
2.2 |
1.4 |
||||||||||||
|
3 |
25.7 |
27.1 |
26.9 |
6.5 |
6.5 |
6.5 |
3.4 |
3.2 |
5.4 |
14.6 |
7.2 |
19.6 |
|||||||
|
4 |
22.1 |
22.8 |
22.1 |
6.5 |
6.5 |
6.5 |
3.2 |
3.6 |
3.5 |
10.6 |
1.8 |
1.4 |
|||||||
|
5 |
16.6 |
16.2 |
18.6 |
6.5 |
6.0 |
6.5 |
22.2 |
26.2 |
23.9 |
9.5 |
12.4 |
||||||||
|
6 |
15.6 |
15.6 |
15.2 |
8.0 |
8.0 |
8.0 |
13.0 |
25.8 |
7.5 |
||||||||||
|
7 |
18.0 |
16.5 |
16.9 |
8.0 |
7.5 |
7.5 |
41 |
19 |
17 |
5.2 |
10.0 |
13.1 |
3.8 |
1.2 |
2.8 |
||||
|
8 |
18.5 |
17.1 |
16.9 |
8.0 |
8.0 |
8.0 |
–18 |
21 |
8 |
5.2 |
4.6 |
4.1 |
15.2 |
19.3 |
8.0 |
||||
|
9 |
16.8 |
17.1 |
17.3 |
7.5 |
7.0 |
7.0 |
–9 |
51 |
62 |
5.9 |
14.2 |
15 |
7.4 |
6.6 |
9.5 |
||||
|
10 |
19.7 |
17.9 |
7.5 |
7.5 |
35 |
41 |
43.1 |
29.7 |
64.5 |
||||||||||
|
11 |
16.3 |
16.7 |
17.0 |
8.0 |
8.0 |
8.0 |
24 |
20 |
23.0 |
11.8 |
31.1 |
4.2 |
9.7 |
4.9 |
|||||
|
12 |
17.6 |
17.5 |
17.9 |
8.0 |
6.5 |
8.0 |
34 |
105.6 |
122.9 |
56.1 |
17.4 |
52.1 |
35.8 |
||||||
|
13 |
16.8 |
19.0 |
16.5 |
7.0 |
7.0 |
7.0 |
70 |
51 |
51 |
31.0 |
29.9 |
61.3 |
|||||||
|
14 |
11.2 |
8.0 |
19 |
15.9 |
6.9 |
||||||||||||||
|
15 |
13.0 |
11.9 |
11.6 |
8.0 |
8.0 |
8.0 |
16 |
16 |
17 |
86.6 |
32.3 |
23.1 |
11.4 |
4.2 |
22.2 |
||||
|
aStopped training after 7–9 sessions (see Fig. 1). See Table II for abbreviations. |
|||||||||||||||||||
Training
Eleven of the 14 exercising participants adhered to the prescribed training protocol: a median of 894 min of exercise was completed over 32 sessions in 17 weeks while, on average, maintaining the prescribed intensity (Fig. 1). The other exercising participants stopped training after 7–9 sessions due to kidney stones, lack of motivation or lack of time (Fig. 1). No adverse events due to the training were reported. No significant increases appeared in upper-body LPD and session RPE over the training period (Table V).
|
Table V. Training parameters in participants completing the 16-week exercise protocol (n=11) |
||||||||||
|
Fifth session1 |
16th session |
Last session |
Friedman’s ANOVA |
|||||||
|
Median (range) |
n |
Median (range) |
n |
Median (range) |
n |
|
p |
|||
|
Upper-body LPD |
11 (0–54) |
11 |
9 (0–44) |
11 |
8 (0–44) |
11 |
0.102 |
|||
|
Session RPE |
2 (0–4) |
9 |
2 (0–4) |
9 |
2 (0–3) |
9 |
0.135 |
|||
|
Power output (W) |
11.1 (1.8–16.4)* |
11 |
12.0 (4.3–18.9)* |
11 |
14.0 (2.9–21.4)* |
11 |
0.005* |
|||
|
Velocity (m/s) |
0.7 (0.1–1.1) |
11 |
0.7 (0.3–1.1) |
11 |
0.9 (0.2–1.1) |
11 |
0.012** |
|||
|
*Significant overall effect (p < 0.05). Wilcoxon signed-rank tests showed a significant increase from fifth to 16th and last session (p-value/3). **Significant overall effect, but no significance differences between sessions based on Wilcoxon signed-rank tests (p-value/3). 1First session consisting of 30 min of exercise. ANOVA: analysis of variance; Mdn: median; LPD: local perceived discomfort summed for all upper-body regions (19); RPE: rate of perceived exertion assessed 7 min after the session on a 0–10 scale (19, 28). |
||||||||||
Participants were, on average, able to increase power output and velocity over the training period (Table V). The majority of participants felt that the training improved their fitness, as reported by 10 participants completing the training (a lot: n = 2; somewhat: n = 6; no change: n = 2). Most participants reported that wheelchair skill performance and physical activity levels had not changed (median ratings of 3).
Analyses of training effects
Not all outcomes could be collected in all participants, for example due to technical issues and incidence of secondary health complications (Fig. 2). These participants were excluded from analyses on the representative outcome (Table II). The baseline outcomes of the excluded participants were not significantly different from those included in the analyses (see T1b in Table II).
Wheelchair-specific fitness. No significant training effects were found in the primary outcome POpeak (Table II). Effect sizes were very small or negative, indicating that the control group improved more (Table II). Similar results were also found in the secondary outcomes of wheelchair-specific fitness, except in P5–15m (Table II). The exercise group’s improvement in ΔT3–T1 was significantly larger compared with the decline in the control group (mean P5–15m: 2.0 vs –0.7 W, p=0.017, ru=0.65). Similar results were found in exploratory analyses in which outcomes for the 3 participants who stopped training were excluded. Training effects were absent or less than 10% in the majority of exercising participants, except in P5–15m (Table IV and Fig. 2).
Wheelchair skill performance. No significant training effects appeared in the secondary outcomes representing wheelchair skill performance, while effect sizes were small or negative (Table II). Results were similar in exploratory analyses excluding outcomes of the participants who stopped training.
Physical activity levels. No significant training effects and small or negative effect sizes were found in physical activity levels (Table II). Results were similar in the exploratory analyses excluding participants who stopped training.
DISCUSSION
This RCT indicates that low-intensity wheelchair exercise for 16 weeks, twice a week, for 30 min per session does not lead to substantial training effects on wheelchair-specific fitness, wheelchair skill performance and physical activity levels in inactive manual wheelchair users with long-term SCI. No significant differences appeared between the exercise and control groups, while effect sizes were small or even negative in all outcomes except in the sprint power outcome P5–15m. P5–15m showed a significant training effect and a moderate effect size, in part due to some decline in the control group (exercise vs control: mean 2.0 vs –0.7 W).
The group had relatively low fitness and activity levels compared with findings in previous studies on people with SCI (3, 32). Low fitness in the present study is exemplified by POpeak in the subgroup with paraplegia, which would be ranked as “poor” based on a study on norm values of fitness in people with SCI (32). Mean activity scores were approximately half of what has been found in a cohort study on PASIPD in people with SCI 1 year after discharge from inpatient rehabilitation (27). Wheelchair skill performance was similar to findings in a cohort study on people with SCI 5 years after discharge from inpatient rehabilitation (9).
The estimated sample size of 18 per group was not achieved, due to issues that limited enrollment (Fig. 1). This reduced statistical power to detect differences. Power was also lower due to missing outcomes in some participants. A type II error can therefore not be excluded. We speculate that a larger sample would be unlikely to change the absence of significant training effects: effect sizes and individual improvements were small or indicated that the control group improved more than the exercise group.
It seems that this intensity, frequency and/or duration of wheelchair exercise is insufficient for substantial fitness improvements in inactive people with long-term SCI. Higher-intensity wheelchair exercise can be more effective (14), but may lead to low adherence, dropout or injury (15–18). Substantial fitness improvements have been found in inactive or deconditioned groups performing 9 weeks of low-intensity training, 3–5 times per week for only 14 min per session (21, 23). This suggests that the potential cause of the limited training effects in this study was a too low exercise frequency, while duration might have been sufficient. Exercising at least 3 times per week allows between-session intervals of no more than 72 h, which is thought to be a prerequisite for acute fitness adaptations to develop into more lasting adaptations (33). Research in the general population also indicates that increased exercise frequency is needed when exercising at a lower intensity (15). However, a previous study showed that community-dwelling people with tetraplegia had difficulty adhering to exercise performed more than twice a week in a rehabilitation centre, mainly due to problems with transportation or health (18). These problems also caused a dropout rate of 48% in a study on people with SCI performing a 9-month training consisting of centre-based twice-weekly exercise (17). Those findings suggest that even adherence to twice-weekly exercise at a rehabilitation centre is challenging for community-dwelling people with SCI.
Our results contrast the large fitness improvements found in studies on low-intensity wheelchair exercise in able-bodied people (21–24). This contrast may be explained by differences in initial experience in wheelchair propulsion. Novices in wheelchair propulsion seem to be able to improve fitness due to motor learning, resulting in a more efficient propulsion technique (34). Little or no change in propulsion technique seems to occur in wheelchair users with long-term SCI performing low-intensity wheelchair training (35).
The lack of substantial fitness effects might explain the limited or absent effects in wheelchair skill performance and physical activity. Prospective cohort studies on people with SCI indicate that wheelchair-specific fitness is positively associated with wheelchair skill performance and physical activity levels (6, 7).
It can be debated whether the significant effect in P5–15m was due to a training effect or to the average decline in the control group. Still, the individual outcomes suggest that the majority of subjects might experience a small training effect in P5–15m. If so, it could be that this wheelchair sprint outcome is more responsive to change in this population due its basis on an overground test, which better resembles daily life propulsion than tests such as those on the treadmill. Assuming the training effect did not occur by chance, the improvement in P5–15m might be clinically relevant, as it has been associated with reduced strain in daily activities (36). Whether this outweighs the burden and costs of the training should be decided on an individual level by participants and clinicians.
Study limitations
The relatively small sample size and missing data limited the statistical power of this study. A type II error cannot be excluded, but seems unlikely given the small or even negative effect sizes and the absence of individual improvements. Systematic bias due to missing data is not suggested given the non-significant results in baseline comparisons between the excluded and the included groups in the analyses of training effects. Three participants did not complete the training, but were included in analyses based on the intention-to-treat principle. Even when excluding these participants using exploratory analyses, results were similar to those shown in Table II.
Blinding of investigators conducting measurements was not possible. An influence on results cannot be ruled out, but seems improbable, as measurement protocols were strictly followed.
Selection bias might have had an unknown influence on generalization of our findings to the inactive population with long-term SCI. For example, perhaps people with relatively high fitness and activity levels did not participate due to work or social obligations (9), while relatively deconditioned or inactive people might have experienced too many other barriers to participate in the centre-based training (37).
Clinical implications and future research
The exercise prescription in this study seems insufficient for inactive or deconditioned people with long-term SCI to reach substantial training effects in fitness and daily activities. It remains to be established what is minimally needed for substantial effects, which could help inactive or deconditioned populations to reduce risk of injury as well as improve feasibility and adherence (15).
More effective low-intensity wheelchair training might require exercising more than twice a week. If so, it should first be established how this becomes feasible for community-dwelling, inactive people with SCI. Centre-based exercise can be relatively burdensome due to time and effort for travelling (17, 18, 37). Feasibility might be better in supervised exercise at home or at a local fitness centre compared with exercise in a rehabilitation centre (38). This might best be investigated in studies using quantitative and qualitative measurements.
Other training approaches may be to gradually build up wheelchair exercise intensity over a longer period so that more effective intensities can be sustained. Building up wheelchair exercise intensity might also be supported by combining it with higher-intensity handcycling exercise, allowing customization to higher-intensity exercise without risking upper-body overuse (16, 18).
Higher exercise intensities might be within the reach of people with long-term SCI when severe inactivity and deconditioning have been prevented. This requires regular check-ups of health, activity and fitness that occur not only during, but also after inpatient rehabilitation (13). If needed, the check-ups could result in counselling on physical activity and exercise (39), so that each person can find what best fits their possibilities when aiming to reap the benefits of improved physical fitness and activity (5–9).
In conclusion, low-intensity wheelchair exercise for 16 weeks, twice a week, for 30 min per session seems to be insufficient for substantial training effects in inactive manual wheelchair users with long-term SCI. A limitation of this conclusion is that it cannot be excluded that the non-significant findings were caused by a lack of statistical power. Effective yet feasible and sustainable training, as well as other physical activity programmes aimed at preventing physical inactivity and deconditioning in people with long-term SCI, remain to be developed.
ACKNOWLEDGEMENTS
The authors would like thank, Anita Fijen and Joke Sprik of rehabilitation centres “Heliomare” and “UMCG Beatrixoord”, as well as a large group of (under)graduate students, for their assistance in measurements. For technical assistance, the authors thank the technical personnel of the Center of Human Movement Sciences (University of Groningen, University Medical Center Groningen).
*ALLRISC group name. Hans Bussmann (PhD), Department of Rehabilitation Medicine and Physical Therapy, Erasmus MC University Medical Centre, Rotterdam, the Netherlands. David Gobets (MD), Heliomare, Rehabilitation Center, Wijk aan Zee, the Netherlands, Thomas Janssen, (PhD), MOVE Research Institute Amsterdam, Faculty of Human Movement Sciences, VU University Amsterdam, the Netherlands; Amsterdam Rehabilitation Research Centre Reade, Amsterdam, the Netherlands, Marcel Post, (PhD), Rehabilitation Center De Hoogstraat, Utrecht, Netherlands, Hans Slootman (MD), Heliomare, Rehabilitation Center, Wijk aan Zee, the Netherlands, Linda Valent (PhD, PT), Heliomare, Rehabilitation Center, Wijk aan Zee, the Netherlands, Ferry Woldring (PT), University Medical Center Groningen, Center for Rehabilitation, Department of Rehabilitation Medicine, the Netherlands.
This study was part of research programme “ALLRISC” (13), supported financially by “Fonds NutsOHRA” under the responsibility of the “ZonMw” (project number 89000006). The authors certify that they have no affiliations with or involvement in any organization or entity with any interest in the subject matter or materials discussed in this article.
REFERENCES

