Timo Hinrichs, MD1,2, Birgit Prodinger, PhD1,3, Martin W. G. Brinkhof, PhD1,3 and Armin Gemperli, PhD1,3, for the SwiSCI study group
From the 1Swiss Paraplegic Research (SPF), Nottwil, 2Division of Sports and Exercise Medicine, Department of Sport, Exercise and Health, University of Basel, Basel and 3Department of Health Sciences and Health Policy, University of Lucerne, Lucerne, Switzerland
OBJECTIVE: To test subgroups of a community-based sample of individuals with spinal cord injury, categorized by the application of current recommendations by the International Spinal Cord Society.
DESIGN: Community survey.
PARTICIPANTS: Individuals with traumatic and non-traumatic spinal cord injury residing in Switzerland.
METHODS: Recommended subgroups of age, gender, years since injury, severity of injury and aetiology were tested against the following criteria: (i) distribution of participants across categories; (ii) within- and between-group variability with regard to selected outcomes of functioning and quality of life.
RESULTS: Data-sets for 1,549 participants (28.5% women; mean age 52 ± 15 years) were available for analyses. There was a number of participants in every subgroup, yet numbers were relatively small in the group with the shortest time since injury (< 1 year; n = 23) and in the oldest age group (≥ 76; n = 94). A high variability in some outcomes was detected between categories. All variables were predictive for most of the endpoints investigated.
CONCLUSION: Recommended categorization could well fit the present sample. A minor concern was the low numbers of participants in some subgroups.
Key words: spinal cord injury; health survey; classification; statistical distributions; methodology; reporting; International Classification of Functioning, Disability and Health.
J Rehabil Med 2016; 48: 141–148
Correspondence address: Timo Hinrichs, Swiss Paraplegic Research, Guido A. Zäch Str. 4, CH-6207 Nottwil, Switzerland. E-mail: timo.hinrichs@paraplegie.ch
Accepted Sep 21, 2015; Epub ahead of print Feb 1, 2016
INTRODUCTION
Epidemiological analysis is concerned with describing and comparing the occurrence and patterns of health events between populations as well as across critical subgroups within populations (1). Analytical steps may include descriptive or inferential analyses, and both methods frequently use categorical variables to depict variation or derive conclusions (2). The decision to categorize variables and the choice of categories necessitates some consideration and decision-making. Disadvantages of categorization may include information loss (especially in inferential analysis), while benefits include comparability across studies, which is also relevant with regard to future systematic reviews and meta-analyses. For nominal-scale variables, where a categorization is already given, researchers have to decide if certain categories should be collapsed; for continuous variables the number of categories and the category boundaries have to be determined (1). Categorization should result in a specified number of participants in every group and, ideally, an equal distribution between categories. With respect to the outcome under study, homogeneity within groups and heterogeneity between groups are desirable (1). Reducing or collapsing categories may increase the clarity of presentation and may also simplify subsequent statistical analyses; however, the resulting loss of detail may cover up important information or trends, and the reconstruction of detail by future researchers is impossible.
To facilitate comparability between epidemiological studies conducted in individuals with spinal cord injury (SCI), recommendations on how to categorize and report basic study sample characteristics were developed under the auspices of the International Spinal Cord Society (ISCoS) (ISCoS recommendations; (3, 4)). Such standards ease comparability of information across SCI studies and thus are of great relevance for epidemiological purposes. At the same time, the authors of the ISCoS recommendations acknowledged that further research may indicate where to improve the groupings in order to produce high homogeneity within groups and discrimination of outcomes between groups.
The aim of the present study was to test subgroups, resulting from the application of the ISCoS recommendations, among participants of the Community Survey performed by Swiss Spinal Cord Injury (SwiSCI). The resulting subgroups were tested for the following attributes: (i) distribution of participants across categories; (ii) variability, including: (a) homogeneity within groups and (b) heterogeneity between groups with regard to selected outcomes of domains of functioning and quality of life as cases in point.
METHODS
Study design
SwiSCI is an ongoing observational cohort study that includes individuals, aged 16 years or older, who reside in Switzerland and have been diagnosed with traumatic or non-traumatic SCI. Exclusion criteria include congenital conditions leading to SCI, new SCI in the context of palliative care, and neurodegenerative disorders. Study design and recruitment procedures have been reported in detail elsewhere (5). SwiSCI was formally approved by the responsible regional research ethics committees. Written informed consent for use of questionnaire data was signed by all participants.
The present study refers to cross-sectional data collected between September 2011 and March 2013 in a community survey (5), using a mixed-mode design that included a combination of paper-based and web-based questionnaires, and telephone interviews as assessment methods. Potential participants were identified through cooperation with the national association for persons with SCI (Swiss Paraplegics Association), the SCI-specific home care organization ParaHelp, and 3 specialized SCI-rehabilitation centres. The part of the questionnaire that provided information for the present study was returned by 1,549 out of 3,144 individuals, a response rate of 49% (for details see (6)).
Measures
Basic study sample characteristics. The SwiSCI Community Survey included the following variables of the International Spinal Cord Injury Core Data Set (4): gender, date of birth, date of injury, aetiology of injury, and severity of injury. Years since injury and current age (at the time of the survey) were calculated. Aetiology of injury was classified as traumatic or non-traumatic. Severity of injury was assessed by questions on the level (tetraplegia, paraplegia) and the completeness (complete, incomplete) of the lesion. To approximate the American Spinal Injury Association Impairment Scale (AIS) these were combined to: complete tetraplegia (equivalent to C1–C8, AIS A), incomplete tetraplegia (C1–C8, AIS B, C or D), complete paraplegia (T1–S5, AIS A) and incomplete paraplegia (T1–S5 AIS B, C, or D) (4).
Selected outcomes of domains of functioning and quality of life. A number of different outcomes, covering domains of functioning according to the International Classification of Functioning, Disability and Health (ICF) and quality of life, were chosen as cases in point to evaluate variability between subgroups.
Five domains of functioning relevant for people with SCI were included in this study. For each of these domains a scale was developed that aggregates the available information for the relevant ICF categories in a metrically sound way, while keeping the conceptual components distinct (7). Items from the following existing instruments were integrated in the scales: the Spinal Cord Injury Secondary Conditions Scale (SCI-SCS) (8), Spinal Cord Independence Measure Self Report (SCIM-SR) (9) and the restriction scale of the Utrecht Scale for Evaluation of Rehabilitation-Participation (USER-P) (10). The Rasch measurement model was applied, which estimates the parameters of a person’s ability and an item’s difficulty along the same logit scale, giving rise to equal interval units of measurement (11). Assumptions of unidimensionality, local independence of items, and group invariance across relevant groups were also tested. Five unidimensional outcomes (at chapter level or across chapters) were derived from survey questions, covering both the ICF component of “Body functions” and the ICF component of “Activities and Participation”. The “Mental functions” (ICF chapter b1) scale consists of 7 items (range –4 to 5 logits), the “Functions of body systems” (ICF chapters b2–b8) scale integrates 13 items (range –4 to 5 logits), the “Mobility” (ICF chapter d4) scale constitutes of 8 items (range –4 to 4 logits), the “Self care” (ICF chapter d5) scale encompasses 6 items (–4 to 9 logits) and the “Involvement in life situations” (ICF chapters d6-d9) scale consists of 8 items (range –3 to 6 logits). Higher scores represent lower levels of functioning. Each scale has shown to be invariant across age, gender, and SCI aetiology and provides interval-scaled data for further epidemiological analyses (7).
Quality of life was assessed by 4 selected items of the WHO-QOL BREF questionnaire (12). The WHO-QOL BREF uses a 5-point Likert scale to rate quality of life (ranging from “very poor” to “very good”), satisfaction with personal health, with the ability to perform daily living activities, and with personal relationships (ranging from “very dissatisfied” to “very satisfied”).
Statistical analyses
Continuous variables were categorized according to ISCoS recommendations (3). Age (at time of survey) was split into 15-year intervals. Time since injury was split into an interval of less than 1 year, an interval of 1–5 years, and 5-year intervals thereafter. The highest age or time since injury interval with an acceptable number of cases was found to be older than 75 years and more than 40 years since injury, respectively. The distribution of study participant characteristics across categories was evaluated for continuous variables using summary statistics, including number of non-missing values, frequencies, mean and standard deviation (SD), median, as well as minimum and maximum per category.
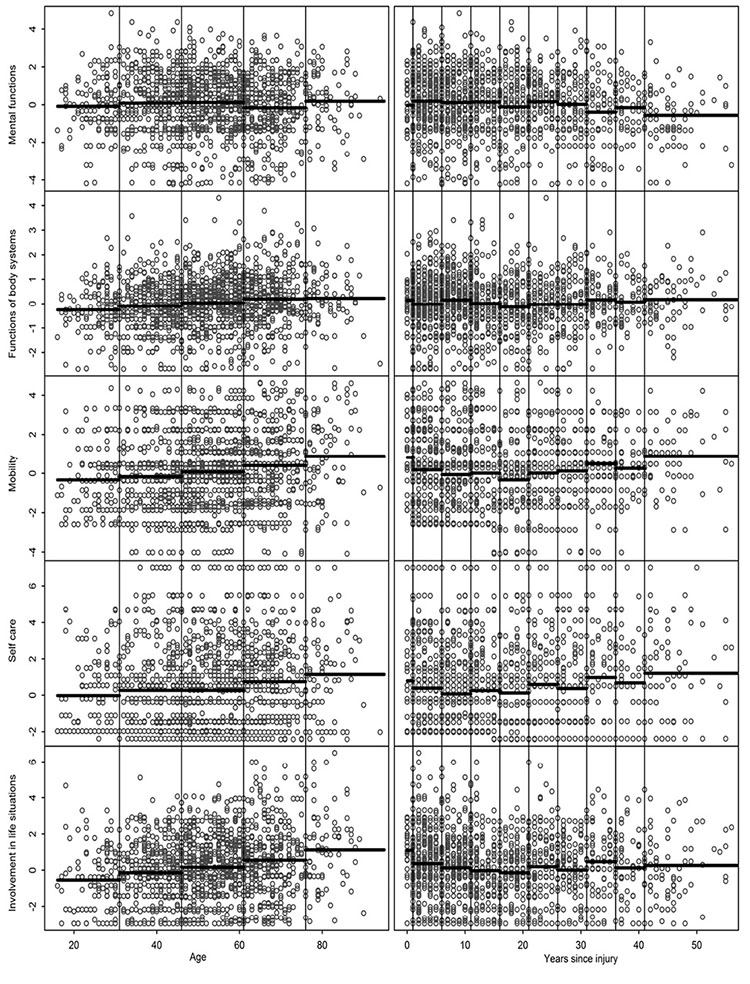
As a measure of data clustering, the variability of continuous outcomes across categories of predictor variables was assessed by comparing the SD in outcomes between strata. Minimum, maximum and standard deviation of the stratum specific variability were computed, along with p-values from Levene’s test for the equality of variances between categories. Heterogeneity between groups was assessed through one-way analysis of variance (ANOVA) for continuous outcomes and via Kendall’s tau for testing the association between ordinal variables. p-values for the ANOVA were derived via simulation of the data given actual group sizes and estimated standard deviations under the null hypothesis using 5,000 replications. This was computed using the simanova package in Stata. The variability of continuous outcomes across categories of predictor variables was further depicted graphically in scatterplots comparing mean per strata with actual measurements.
Rasch scores were derived using the TAM packed version 1.0-3.18-1 in R version 3.1.0. All other statistical analyses and data preparation were performed with Stata version 13.1 (StataCorp LP, College Station, TX, USA).
RESULTS
A total of 1,549 individuals participated in the study, of whom 71.5% were male. The median age was 52 (interquartile range (IQR) 42–63) years. Detailed participant characteristics and their distribution across categories are shown in Table I. Most study participants were in the age category 46–60 years (36.9%), with only a few being 30 years or younger, or older than 75 years (8.3% and 6.1%, respectively). The age distribution was skewed to the left in the youngest, 16–30 years, age group (median age 26 years) and skewed to the right in the oldest, ≥ 76 years, age group (median age 79 years). All other age categories showed a uniform distribution of age within strata. Time since injury was less than 25 years in over 75%, and less than one year in 1.5% of participants. Within each 5-year period the data were uniformly distributed. Seventy-eight percent of participants had a traumatic cause of SCI. The distribution of participants across severity level was between 10.0% (tetraplegia complete) and 37.2% (paraplegia incomplete).
|
Table I. Summary statistics and distribution of study sample according to recommended categories n = 1,549 |
|||
|
Parameter/Category |
n (%)a |
Mean (SD) |
Median (min; max) |
|
Age |
|
|
|
|
Missing |
0 |
– |
– |
|
Non-missing |
1,549 (100.0) |
52.3 (14.8) |
52 (16; 94) |
|
16–30 years |
129 (8.3) |
25.5 (3.7) |
26 (16; 30) |
|
31–45 years |
377 (24.3) |
39.2 (4.0) |
40 (31; 45) |
|
46–60 years |
571 (36.9) |
52.8 (4.4) |
53 (46; 60) |
|
61–75 years |
378 (24.4) |
66.8 (4.0) |
67 (61; 75) |
|
76 or older |
94 (6.1) |
80.6 (4.0) |
79 (76; 94) |
|
Time since injury |
|
|
|
|
Missing |
27 (1.7) |
– |
– |
|
Non-missing |
1,522 (98.3) |
16.8 (12.7) |
13 (0; 75) |
|
< 1 years |
23 (1.5) |
0.0 (0.0) |
0 (0; 0) |
|
1–5 years |
340 (22.3) |
2.9 (1.4) |
3 (1; 5) |
|
6–10 years |
258 (17.0) |
7.9 (1.4) |
8 (6; 10) |
|
11–15 years |
215 (14.1) |
12.6 (1.4) |
12 (11; 15) |
|
16–20 years |
165 (10.8) |
18.1 (1.4) |
18 (16; 20) |
|
21–25 years |
160 (10.5) |
22.8 (1.4) |
23 (21; 25) |
|
26–30 years |
124 (8.1) |
27.9 (1.4) |
28 (26; 30) |
|
31–35 years |
90 (5.9) |
32.8 (1.4) |
32 (31; 35) |
|
36–40 years |
62 (4.1) |
37.7 (1.4) |
37 (36; 40) |
|
≥ 41 years |
85 (5.6) |
45.8 (5.3) |
45 (41; 75) |
|
Gender |
|
|
|
|
Male |
1,107 (71.5) |
|
|
|
Female |
442 (28.5) |
|
|
|
Missing |
0 |
|
|
|
Severity of injury |
|
|
|
|
Tetraplegia complete |
160 (10.3) |
|
|
|
Tetraplegia incomplete |
314 (20.3) |
|
|
|
Paraplegia complete |
486 (31.4) |
|
|
|
Paraplegia incomplete |
577 (37.2) |
|
|
|
Missing |
12 (0.8) |
|
|
|
Aetiology |
|
|
|
|
Traumatic |
1,202 (77.6) |
|
|
|
Non-traumatic |
332 (21.4) |
|
|
|
Missing |
15 (1.0) |
|
|
|
aRelative frequencies for categories of age and years since injury were evaluated for the complete cases. Relative frequencies for all other variables were evaluated for the total study population. SD: standard deviation; Min: minimum; Max: maximum. |
|||
Summary statistics of the functioning outcomes are shown in Table II. There was a significant difference in variability detected across categories of age for the “Involvement in life situations” outcome, across categories of years since injury for the “Mental functions” outcome, and between genders for the “Self care” outcome (Table III). Most outcomes displayed significant differences in variability across categories of severity of injury, except “Mental functions” and “Functions of body systems”. Amongst all other outcomes and categories of predictors the variability was fairly homogenous.
|
Table II. Summary statistics of continuous functioning outcomes |
||||
|
Outcome |
n |
Mean (SD) |
Median (Q1; Q3) |
Min; Max |
|
Mental functions |
1,515 |
0.0 (1.6) |
0.0 (–0.9, 1.2) |
–4.2; 4.8 |
|
Functions of body systems |
1,506 |
0.0 (1.1) |
0.1 (–0.6, 0.7) |
–2.7; 4.3 |
|
Mobility |
1,508 |
0.1 (1.9) |
0.1 (–1.4, 1.3) |
–4.1; 4.6 |
|
Self care |
1,530 |
0.4 (2.3) |
0.3 (–1.5, 1.8) |
–2.4; 7.0 |
|
Involvement in life situations |
1,487 |
0.2 (1.8) |
0.1 (–1.1, 1.3) |
–3.0; 6.5 |
|
SD: standard deviation; Q1, Q3: lower and upper quartile. |
||||
|
Table III. Variability and heterogeneity in outcomes across strata of recommended categories for population parameters |
||||||
|
Parameter [number of categories]a |
Outcome |
Variability |
|
Heterogeneity |
||
|
Min; Max (SD)b |
p-valuec |
|
MS within; betweend |
p-valuee |
||
|
Age [5] |
Mental functions |
1.46; 1.66 (0.08) |
0.310 |
|
2.57; 5.82 |
0.051 |
|
Functions of body systems |
0.99; 1.11 (0.04) |
0.274 |
|
1.09; 7.39 |
< 0.001 |
|
|
Mobility |
1.68; 2.10 (0.14) |
0.090 |
|
3.48; 34.16 |
< 0.001 |
|
|
Self care |
1.90; 2.42 (0.20) |
0.051 |
|
5.33; 33.45 |
< 0.001 |
|
|
Involvement in life situations |
1.65; 2.14 (0.19) |
0.004 |
|
3.25; 56.40 |
< 0.001 |
|
|
Years since injury [10] |
Mental functions |
1.29; 1.81 (0.16) |
0.003 |
|
2.53; 7.36 |
0.003 |
|
Functions of body systems |
0.78; 1.15 (0.11) |
0.279 |
|
1.10; 1.50 |
0.136 |
|
|
Mobility |
1.66; 2.00 (0.12) |
0.232 |
|
3.52; 13.27 |
< 0.001 |
|
|
Self care |
2.15; 2.56 (0.14) |
0.397 |
|
5.34; 15.95 |
0.003 |
|
|
Involvement in life situations |
1.40; 1.91 (0.16) |
0.385 |
|
3.36; 7.28 |
0.013 |
|
|
Gender [2] |
Mental functions |
1.58; 1.61 |
0.806 |
|
2.56; 38.23 |
< 0.001 |
|
Functions of body systems |
1.05; 1.05 |
0.709 |
|
1.11; 8.59 |
0.007 |
|
|
Mobility |
1.86; 1.91 |
0.805 |
|
3.53; 59.12 |
< 0.001 |
|
|
Self care |
2.10; 2.41 |
< 0.001 |
|
5.40; 2.54 |
0.466 |
|
|
Involvement in life situations |
1.69; 1.88 |
0.027 |
|
3.36; 49.04 |
< 0.001 |
|
|
Severity of injury [4] |
Mental functions |
1.50; 1.67 (0.06) |
0.148 |
|
2.57; 8.56 |
0.020 |
|
Functions of body systems |
0.97; 1.10 (0.06) |
0.185 |
|
1.12; 1.16 |
0.384 |
|
|
Mobility |
1.36; 2.12 (0.28) |
< 0.001 |
|
2.89: 343.94 |
< 0.001 |
|
|
Self care |
1.56; 2.69 (0.44) |
< 0.001 |
|
3.89; 763.17 |
< 0.001 |
|
|
Involvement in life situations |
1.58; 1.94 (0.15) |
0.003 |
|
3.05; 170.03 |
< 0.001 |
|
|
Aetiology [2] |
Mental functions |
1.59; 1.68 |
0.070 |
|
2.59; 9.31 |
0.064 |
|
Functions of body systems |
1.04; 1.08 |
0.486 |
|
1.10; 31.11 |
< 0.001 |
|
|
Mobility |
1.88; 1.93 |
0.372 |
|
3.58; 10.22 |
0.093 |
|
|
Self care |
2.13; 2.37 |
0.050 |
|
5.40; 0.02 |
0.950 |
|
|
Involvement in life situations |
1.77; 1.86 |
0.261 |
|
3.38; 30.99 |
< 0.001 |
|
|
aCategories are listed in Table I. bMin, Max (SD): minimum, maximum and standard deviation of standard deviations in outcome across categories (not reported for gender and aetiology, which have only 2 categories). cp-value from Levene’s test statistic for the equality of variances between the categories. dMS within; between: within and between categories mean square. ep-value from simulated (1-way) analysis of variance allowing unequal group variances. |
||||||
Heterogeneity between groups was high between all outcomes and all categorized parameters, except in “Mental functions” vs age or aetiology, “Functions of body systems” vs years since injury or severity of injury, “Self care” vs gender or aetiology, and “Mobility” vs aetiology (Table III). Recommended categories for age and time since injury appropriately reflected the distribution of the data as well as trends in key outcomes (Fig. 1). All parameters were highly predictive of at least 4 of the 5 outcomes and most distinctive of “Mobility” and “Involvement in life situations”. The ratings of quality of life, satisfaction with health and ability to perform daily living activities showed high association with most investigated parameters (Table IV). No association was found between any parameter and satisfaction with personal relationships.
|
Table IV. Association between categorized predictors and quality of life outcomes |
|||||||||||
|
Parameter [number of categories]a |
Quality of life |
|
Satisfaction with health |
|
Satisfaction with ability to perform daily living activities |
|
Satisfaction with personal relationships |
||||
|
tau-bb |
p-value |
|
tau-b |
p-value |
|
tau-b |
p-value |
|
tau-b |
p-value |
|
|
Age [5] |
–0.09 |
< 0.001 |
|
–0.02 |
0.349 |
|
–0.11 |
<0.001 |
|
0.01 |
0.604 |
|
Years since injury [10] |
0.08 |
< 0.001 |
|
0.09 |
< 0.001 |
|
0.09 |
<0.001 |
|
0.04 |
0.074 |
|
Gender [2] |
–0.04 |
0.079 |
|
–0.08 |
< 0.001 |
|
–0.01 |
0.700 |
|
0.24 |
0.314 |
|
Severity of injury [4] |
–0.01 |
0.616 |
|
–0.05 |
0.014 |
|
0.06 |
0.003 |
|
–0.03 |
0.170 |
|
Aetiology [2] |
–0.09 |
< 0.001 |
|
–0.16 |
< 0.001 |
|
–0.12 |
<0.001 |
|
–0.02 |
0.339 |
|
aCategories are listed in Table I. bKendall’s tau-b for association between categorical outcomes. |
|||||||||||
DISCUSSION
The comparability of reported participant characteristics with other studies can help to determine selection bias and to convince the reader that the population included in the study, to the extent possible, is representative of the population intended to study. For the present study, we therefore defined comparability with other studies as top priority for categorization and applied the ISCoS recommendations on standardized reporting to the SwiSCI Community Survey sample. For the comparison with other epidemiological studies conducted in populations with SCI, this seems appropriate, on the condition that the recommendations will be broadly adopted by future studies in this field. Currently, the comparability with past studies remains limited by the inconsistency in reporting, as shown by an overview of randomly chosen past publications (see Table V) and as previously stated by the authors of the International Perspectives on Spinal Cord Injury (IPSCI), a report recently published by WHO and ISCoS (13). The authors of the IPSCI report strongly suggest using the ISCoS recommendations in future studies and the editors of Spinal Cord, the scientific journal of ISCoS, recently made use of the recommendations mandatory for publications in their journal (14). However, in studies where comparisons with the general population or populations with a different index disease are intended, other categorizations might be preferable. Unfortunately there is no consensus on how to categorize data for reporting. To give some examples, a publication of the cohort profile of the Swiss National Cohort reports the following age groups: 0–9, 10–29, 30–64, 65–84, ≥ 85 years (15); the Global Burden of Disease reports the age groups: 0–4, 5–14, 15–59, ≥ 60 years (16); and the World Report on Disability, which is not based on its own data collection, reports 2 different categorizations: 18–49, 50–59, ≥ 60 years, and 0–14, 15–59, ≥ 60 years (17). Choice of categories might also be determined by the subject under study. As an example, studies on labour market participation would usually be limited to individuals of working age (18–64 years) and the use of the age categories recommended by ISCoS would therefore not be very convenient (e.g. 18).
|
Table V. Reporting of basic study sample characteristics in randomly chosen studies conducted in populations with spinal cord injury (sorted by year of publication and alphabetically by first author name) |
|||||||
|
Authors/year |
Feng et al. 2011 (22) |
Krause & Saunders 2012 (23) |
Perrier et al. 2012 (24) |
Sale et al. 2012 (25) |
Model SCI Systems Annual Statistical Report 2013 (26) |
Wang et al. 2013 (27) |
Kivisild et al. 2014 (28) |
|
Population/data source |
Medical records of patients with TSCI admitted to the Tianjin Medical University General Hospital (China) |
Adults with TSCI of at least 1-year duration recruited through a specialty hospital in the Southeast USA |
Ontarians (Canada) with TSCI requiring assistance with mobility outside, recruited from databases of 4 rehabilitation centres and through advertisement |
Follow-up of a sample of first admission TSCI patients discharged between 1997 and 1999 from 24 Italian centres |
Patients receiving care following SCI in a network of regional SCI Model Systems located at major medical centres throughout the USA |
Medical records of all patients with TSCI admitted to hospitals in the Anhui Province (China) between 2007 and 2010 |
Estonian-speaking TSCI patients from the Estonian TSCI database |
|
Age, years |
Age at injury: categories 15–24, 25–34, …, 55–64, ≥ 65 |
Current age: mean, SD; categories 18–34, 35–44,…, 65–74, ≥ 75 |
Current age: mean, SD |
Age at follow-up: mean, SD, median, interquartile range |
Age at injury: mean, SD, range; frequencies for every single year; for cross-tabulation with aetiology groups: categories 0–15, 16–30…61–75, ≥ 76 |
Age at injury: categories 0–15, 16–30, 31–45, 46–60, > 60 |
Age at injury: mean, SD |
|
Time since injury, years |
Not applicable |
Mean, SD |
Mean, SD |
Time since discharge: mean, median, range |
Post-injury year: 1, 5, 10, 15, 20, 25, 30, 35, 40 |
Not applicable |
Mean, SD, range |
|
Length of stay |
Not reported |
Not reported |
Not reported |
Not reported |
Median days hospitalized in the System’s Acute Care Unit and in the System’s Rehab Unit |
Range, median (days) |
Not reported |
|
Year of injury |
1998–2000, 2001–2003, 2004–2006, 2007–2009 |
Not reported |
Not reported |
Not reported |
1973–1979, 1980–1984, …, 2005–2009, 2010–2013 |
Not reported |
Not reported |
|
Gender |
Male, female |
Male, female |
Male, female |
Male, female |
Male, female |
Male, female |
Male, female |
|
Severity of injury
|
Lesion level: every single level from C1-L5; S1-5 as a group; for cross-tabulation with aetiology: cervical, thoracic, lumbar, sacral AIS: A, B, C, D Impairment category: tetraplegia, complete; tetraplegia, incomplete; paraplegia, complete; paraplegia, incomplete |
Lesion level/impairment category: C1-C4, non-ambulatory; C5-C8, non-ambulatory; non-cervical, non-ambulatory; ambulatory |
Lesion level/AIS: C1–C4, AIS A, B or C; C5–C8, AIS A, B or C; T1–S5, AIS A, B or C; AIS D |
Impairment category: paraplegia, tetraplegia AIS: A or B; C, D or E |
Lesion level: every single level (C1–S5) Impairment category: tetraplegia, complete; tetraplegia, incomplete; tetraplegia, minimal deficit; paraplegia, complete; paraplegia, incomplete; paraplegia, minimal deficit; normal, minimal deficit AIS: A, B, C, D, E AIS motor index score total: mean, SD, range |
Lesion level: cervical, thoracic, lumbosacral AIS: A, B, C, D |
AIS: A or B, C or D, sensory symptoms only |
|
Place of residence |
Not applicable |
Super-rural, rural, urban |
Not reported |
Living at home (yes, no) |
Private hospital, nursing home, group living, correctional institution, hotel/motel, homeless, assisted living, other |
Not reported |
Not reported |
|
Associated injuries |
Not reported |
Not reported |
Not reported |
Not reported |
Yes, no |
Head injuries, limb or pelvic fractures, fractures of ribs, others |
Not reported |
|
Table V contd. |
|||||||
|
Authors/year |
Feng et al. 2011 (22) |
Krause & Saunders 2012 (23) |
Perrier et al. 2012 (24) |
Sale et al. 2012 (25) |
Model SCI Systems Annual Statistical Report 2013 (26) |
Wang et al. 2013 (27) |
Kivisild et al. 2014 (28) |
|
Spinal surgery |
Not reported |
Not reported |
Not reported |
Not reported |
Yes, no |
Decompression, decompression + internal fixation, decompression + internal fixation + fusion |
Not reported |
|
Aetiology |
TSCI only: low fall, high fall, motor vehicle collision, falling object, collision of head against object, injury involving machinery, sports, massage |
TSCI only |
TSCI only |
TSCI only |
Vehicular, violence, sports or recreation, falls, other, unknown |
TSCI only: transport, struck by object, fall from height, low fall, others (assault, sport-related injury) |
TSCI only |
|
TSCI: traumatic spinal cord injury; AIS: American Spinal Injury Association impairment scale; SD: standard deviation. |
|||||||
In our sample, recommended cut-offs for creating categories for given parameters were generally supported by the overall value distribution. Only the lower extreme of time since injury (< 1 year) and upper extreme of age (≥ 76 years) contained low numbers of individuals, which may increase the risk of chance findings and erroneous inference regarding outcomes in these groups. Recommended categorizations for time since injury and age were therefore less appropriate for our community survey, because persons still receiving first inpatient rehabilitation (in their first year after SCI) were not invited to participate, and the source population contained only small numbers of people aged ≥ 76 years (6). The merging of these extreme categories to adjacent levels is likely to improve inference and also maintains comparability with results from other studies on the aggregated level.
A successful stratification should lead to fairly homogenous groupings; groups that are very disparate with respect to the outcome under study should not be merged. This study demonstrated well-distributed outcomes across all strata. The exception being the categories of severity of injury, which is grouped based on clinical reasoning and should not be altered. Heterogeneity between groups is not considered necessary for a good categorization, as this depends mainly on the predictive power a measurement has in general. Still, the grouping may enforce or weaken the magnitude in statistical significance of associations. It should be noted that most statistical methods are based on the precondition that categories were chosen independently of the outcome (1), therefore the presented considerations and methods should not be used to manipulate the choice of categories towards a desired direction. Using the ISCoS recommendations could therefore also be considered as a way to avoid any tampering with study results.
To investigate variability we chose outcomes that have previously been considered as relevant in the rehabilitation of individuals with SCI (19–21). However, these outcomes merely serve as cases in point to illustrate our statistical considerations; the choice does not imply a rating of relevance. It should also be noted that our considerations on categorization refer only to the descriptive presentation of basic participant characteristics; for advanced analyses it is usually not recommended to group continuous data, but to use them in their original form (or as, for example, transformations, splines or polynomials). Our choice of variables to describe basic participant characteristics was performed from the perspective of comparability of information within and across SCI populations and therefore based on the International Spinal Cord Injury Core Data Set (4). For future research, it would be worthwhile to examine whether these variables are sufficient and adequate to act as effect modifiers in understanding functioning in SCI.
Limitations of the current study include that the self-report measure of severity of injury was crude and cannot be considered equivalent to direct examination. However, linkage with medical records demonstrated substantial agreement between previously documented and self-reported severity (6). An in-depth analysis of survey non-response was conducted to quantify potential response bias (6). There was no relevant response bias in relation to demographic variables (age, gender) and lesion level. Existing bias, both in relation to participants’ membership of the Swiss Paraplegics Association and in relation to time since injury, had only minor impacts on key outcomes of the survey (for details see (6)).
In conclusion, this study showed that it is feasible to apply ISCoS recommendations to the SwiSCI Community Survey sample. The only issue of concern were categories with a low number of participants (time since injury < 1 year and age ≥ 76 years). The many categories defined for age (15-year intervals) and years since injury (5-year intervals) were found suitable for this large data-set, but may not be similarly appropriate in all cases. In case of specific research questions, e.g. on work participation or when a comparison with specific studies conducted in the general population is intended, it might be preferable to deviate from recommendations and use different, well-targeted and pre-specified age groups.
ACKNOWLEDGEMENTS
This study has been financed in the framework of the Swiss Spinal Cord Injury Cohort Study (SwiSCI, www.swisci.ch), supported by the Swiss Paraplegic Foundation.
The members of the SwiSCI Steering Committee are: Xavier Jordan, Bertrand Léger (Clinique Romande de Réadaptation, Sion); Michael Baumberger, Hans Peter Gmünder (Swiss Paraplegic Center, Nottwil); Armin Curt, Martin Schubert (University Clinic Balgrist, Zürich); Margret Hund-Georgiadis, Kerstin Hug (REHAB Basel, Basel); Hans Georg Koch, (Swiss Paraplegic Association, Nottwil); Hardy Landolt (Representative of persons with SCI, Glarus); Hannjörg Koch (SUVA, Luzern); Mirjam Brach, Gerold Stucki (Swiss Paraplegic Research, Nottwil); Martin Brinkhof, Christine Thyrian (SwiSCI Study Center at Swiss Paraplegic Research, Nottwil).
Authors’ contributions: All authors substantially contributed to conception and design. AG performed the statistical analyses. All authors interpreted the data. TH, AG and BP drafted the manuscript. All authors critically revised the manuscript and gave final approval of the version to be published.
REFERENCES

