Chun-Ming Yang, MD1, Gong-Hong Lin, BS2, Mei-Hsiang Chen, PhD3,4, I-Ping Hsueh, MA2,5 and Ching-Lin Hsieh, PhD2,5
From the 1Department of Neurology, Chi-Mei Medical Center, Tainan, 2School of Occupational Therapy, College of Medicine, National Taiwan University, Taipei, 3School of Occupational Therapy, Chung Shan Medical University,
4Occupational therapy Room, Chung Shan Medical University Hospital, Taichung and 5Department of Physical Medicine and Rehabilitation, National Taiwan University Hospital, Taipei, Taiwan
OBJECTIVES: To develop a computerized Digit Vigilance Test (C-DVT) with lower random measurement error than that of the DVT and to examine the concurrent validity, ecological validity, and test-retest reliability of the C-DVT in patients with stroke.
DESIGN: A cross-sectional study.
Patients: Forty-four patients with stroke.
METHODS: We developed and tested the C-DVT. To examine the psychometric properties, the participants completed both the C-DVT and DVT twice with a 14-day interval.
RESULTS: We developed the C-DVT on the basis of expert input and examinee feedback. C-DVT scores were highly correlated with DVT scores (ρ = 0.75), supporting the concurrent validity. The C-DVT scores were moderately correlated with the scores of the Barthel Index and the Activities of Daily Living Computerized Adaptive Testing system (ρ = –0.60~–0.57), supporting the ecological validity. The test-retest agreement of the C-DVT was excellent (intra-class correlation coefficient = 0.92). The random measurement error of the C-DVT (minimal detectable change percent change (MDC%) = 15.4%) was acceptable and lower than that of the DVT (33.0%). The practice effects of the C-DVT were statistically significant, but the effect size d was small (0.15).
CONCLUSION: A C-DVT with a limited amount of random measurement error was developed. These preliminary findings show that the C-DVT demonstrates satisfactory concurrent validity, ecological validity, and test-retest reliability in patients with stroke.
Key words: stroke; attention; psychometrics.
J Rehabil Med 2015; 47: 00–00
Correspondence address: Mei-Hsiang Chen, School of Occupational Therapy, Chung Shan Medical University, 40201 Taichung, Taiwan. E-mail: cmh@csmu.edu.tw
Accepted Nov 19, 2014; Epub ahead of print Feb 27, 2014
INTRODUCTION
Up to 40% of patients with stroke have deficits in sustained attention (1, 2). Patients with deficits in sustained attention tend to have poor motor and functional recovery (3). In addition, such deficits are commonly associated with poor performance in balance and activities of daily living (2); thus, sustained attention is critical for patients with stroke. To manage issues of sustained attention for patients with stroke, clinicians and researchers first need to assess sustained attention accurately.
The Digit Vigilance Test (DVT) (4), a paper-and-pencil test, has been used widely to assess sustained attention in patients with neurological deficits because of its low literacy requirement and culture-free design (5–7). However, the DVT has substantial random measurement error in patients with stroke (5). The substantial random measurement error of the DVT can make it difficult for users to interpret the results. For example, a DVT score may be under- or overestimated. In addition, when the DVT is used for repeated assessments, it can be difficult for users to determine whether the change score of the DVT is the result of random measurement error or of true change in the patient. Thus, to improve the utility of the test, the random measurement error of the DVT must be reduced.
It has become a trend to develop computerized cognitive tests as substitutes for pencil-and-paper tests (8, 9). Computerized cognitive tests commonly have 2 advantages over pencil-and-paper tests. First, computerized tests tend to have less random measurement error than traditional tests administered by raters (8, 9). The administration and results of traditional tests are often subject to interference from possible inconsistencies in raters. In contrast, computerized tests are administered consistently every time (i.e. the same administrative instructions, administrative procedures, and scoring criteria are used). Secondly, computerized tests can reduce the administrative work and time required of raters (8, 9). Examinees can complete computerized tests individually, needing very little or no assistance from raters, because computers can automatically administer the tests and record the test results. On the basis of the aforementioned advantages in computerized tests, developing a computerized DVT (C-DVT) may reduce the random measurement error of the DVT, increase the administrative efficiency, and improve the utility.
The aims of this study were to develop the C-DVT with less random measurement error than the DVT, and to examine the psychometric properties (including concurrent validity, ecological validity, and test-retest reliability) of the C-DVT in patients with stroke. The results of this study should determine the utility of the C-DVT in both clinical and research settings.
METHODS
The study was divided into 2 parts. In the first part, the C-DVT was developed, and in the second part, the psychometric properties (including concurrent validity, ecological validity, and test-retest reliability) of the C-DVT was examined in patients with stroke. The study protocol was approved by local Institutional Review Boards.
Part 1: Development of the computerized Digit Vigilance Test
Stage 1: Consultation with experts to minimize random measure error and practice effects of the C-DVT. We held 2 meetings with an expert panel, comprising 2 senior clinicians, 2 psychometricians, an expert in attention, and a computer programmer. In the first meeting, the main purpose was to discuss how to minimize random measurement error while retaining the measurement construct of the DVT. In addition, we also determined the interface for administration, stimuli, and administrative rules for the C-DVT. The stimuli and administrative rules of the DVT were used as references for designing the C-DVT. Following the first meeting, we developed the draft version of the C-DVT.
In the second meeting, the expert panel confirmed whether the draft version of the C-DVT was consistent with the design of the test from the first meeting. In addition, the experts discussed and reached a consensus on the feasibility of administration and the administrative instructions of the C-DVT. All 6 of the panel members participated in both meetings. Consensus was achieved when at least 80% of the panel members agreed with the version.
Stage 2: Pilot testing of the C-DVT in college students and patients with stroke. We first tested a group of college students to confirm the clarity of the administrative instructions and the feasibility of administration of the C-DVT. The college students were volunteers. Each student was tested individually in an assessment room by an author (GHL) and provided his/her comments immediately after the testing. Every time we received comments from students, we revised the test accordingly, where necessary. We tried to ensure that the final version of the C-DVT could be completed with no problems, particularly the clarity of the administrative instructions and the feasibility of the test. The testing on students was ended when 2 consecutive students had no comments on the test.
We then tested the C-DVT on a group of patients to confirm the administrative instructions and the feasibility. Patients were included in the study if they met the following 5 criteria: (i) age at least 20 years; (ii) diagnosis of either ischaemic stroke or cerebral haemorrhage; (iii) onset of stroke at least 6 months before the first evaluation; (iv) clinical stability; (v) hemiplegia or hemiparesis involving just 1 side; and (vi) ability to follow 3-step instructions for assessment. The exclusion criteria were as follows: (i) presence of other neurological diseases (e.g. brain tumour, schizophrenia, or dementia) influencing cognitive function; (ii) inability to complete the DVT or the C-DVT due to dysfunction of vision or hearing (e.g. cataract or visual spatial neglect); (iii) inability to complete the DVT or the C-DVT with the sound hand; and (iv) recurrence of stroke during the study period.
Patients were individually tested in an assessment room by an author (GHL) and encouraged to identify any administrative instructions or testing procedures that were difficult to understand. Every time patients provided comments on the test, we revised it where necessary. When 2 consecutive patients had no comments on the test, we ended the testing on patients.
Part 2: Examination of the concurrent validity, ecological validity, and test-retest reliability of the computerized Digit Vigilance Test
Participants. We recruited patients by convenience sampling to examine the psychometric properties. The patients were recruited from 3 rehabilitation units in 2 medical centres and a local community hospital between July 2013 and February 2014. The inclusion and exclusion criteria were exactly the same as those in part 1 of the study.
Procedure. All participants completed both the DVT and C-DVT in 2 sessions with a 2-week interval. The administration order of the 2 measures was randomized for all participants and both sessions. One of 2 raters instructed the participants to perform both tests. The raters also administered both the Barthel Index (BI) and the Activities of Daily Living Computerized Adaptive Testing system (ADL CAT) in the first session. Each rater received 2 h of training on administering the aforementioned measures. Each participant was assessed by the same rater in both sessions.
Measures
Digit Vigilance Test (DVT) (4). The test sheet of the DVT contains 59 rows of 35 digits (i.e. 0–9) in a 12-point (pt) font size presented randomly on 2 A4-size pages. Participants are required to search visually for the digit “6” and cross out all occurrences of the digit from the test sheet as quickly as possible. Total completion time (in s) is recorded separately for the 2 pages of the test sheet. If a participant takes more than 400 s to complete the first page, the second page is not administered. For these participants, the time needed for the first page is doubled for use as the total time of the testing. A shorter time for completing the DVT is interpreted as indicating better sustained attention. It generally takes approximately 10 min to complete the whole test.
Barthel Index (10). The BI is used to assess a patient’s level of independence in daily life. It includes 10 basic ADL tasks, including feeding, transfers, grooming, toileting, bathing, ambulation, stair climbing, dressing, bowel control, and bladder control. These activities are rated on a 2-point (0, 1), 3-point (0, 1, 2) or 4-point (0, 1, 2, 3) ordinal scale. The score range of the BI is from 0 to 20. A score of 0 indicates severe disability, and a score of 20 indicates no disability. The reliability, validity, and responsiveness of the BI in patients with stroke are well supported (11, 12). The score of the BI was used as the criterion for examining the ecological validity of the C-DVT.
Activities of Daily Living Computerized Adaptive Testing system (13). The ADL CAT is used to assess a patient’s level of dependence/disability in daily life. The ADL CAT, which contains an item bank with 11 basic ADL tasks and 23 instrumental ADL tasks, can be administered using a personal computer via the internet. All of the tasks are rated on 4 response categories (“totally dependent,” “partially dependent,” “sometimes independent, but not every time,” and “totally independent, every time”). The ADL CAT presents subsequent (adaptive) items on the basis of the responses (i.e. level of independence) of the patients, in order to achieve rapid assessments. The stopping rule of the ADL CAT is either reliability (estimated by item response theory) > 0.90 or a maximum test length of 7 items (13). The T scores (mean 50, standard deviation (SD) 10) are the main outcome of the ADL CAT. A higher score indicates less dependence/disability in daily life. The reliability, validity, and responsiveness of the ADL CAT in patients with stroke are well supported (14). The score of the ADL CAT was used as the criterion for examining the ecological validity of the C-DVT.
Data analysis
Pearson’s skewness coefficient was used to examine score distributions of the C-DVT, DVT, BI, and ADL CAT. Pearson’s skewness coefficients ranging from –1.0 to 1.0 were considered as normal distribution (15).
The concurrent validity was assessed by examining the correlations between the scores of the C-DVT and those of the DVT. The Spearman’s correlation coefficient (ρ) was adopted to assess the extent of the correlation. ρ ≥ 0.75 indicated high concurrent validity; acceptable: 0.40~0.74 and poor: < 0.40 (16).
The ecological validity was assessed by examining the correlation between the scores of the C-DVT and those of both the BI and the ADL CAT. The Spearman correlation coefficient (ρ) was used to assess the extent of the correlation. ρ > 0.60 indicated high ecological validity; 0.30~0.60, acceptable; and <0.30, poor (16).
The test-retest reliabilities of the C-DVT and DVT were examined in 3 respects: test-retest agreement, random measurement error, and practice effect.
We used the intra-class correlation coefficient (ICC) to examine the test-retest agreement of the scores of the C-DVT and the DVT. The ICC was calculated based on the 2-way random effects (assuming both patient effects and trial effects to be random) of analysis of variance (ICC2,1). ICC values of 0.80–1.00 were considered to demonstrate excellent test-retest agreement; good agreement: 0.60–0.79, moderate agreement: 0.40–0.59, and poor agreement: < 0.40 (17).
We adopted the minimal detectable change (MDC [with 95% confidence level]) to examine the random measurement error of the C-DVT and DVT. The MDC indicates the smallest change that reflects real change, rather than random measurement error, at a 95% confidence level between repeated assessments (18). In other words, the MDC of a test reflects a range of change score (i.e. ± MDC) that may result from random measurement error. Thus, a test with smaller random measurement error will have a smaller MDC value. The MDC, based on the standard error of measurement (SEM), was calculated using the following formulae (18):
MDC = z-score level of confidence × √2 × SEM
SEM = SD all testing scores × √(1–ICC)
In the first formula, we used a z-score of 1.96 for the 95% confidence level in this study. The multiplier √2 indicates the additional uncertainty caused by the inclusion of scores from 2 separate assessments (18).
Furthermore, we calculated the MDC% to estimate the relative amount of random measurement error (19). Because the MDC% is independent of the units of measurement, we can use the index to compare the amounts of random measurement error of different tests. The MDC% was calculated by dividing the MDC by the mean scores of the 2 sessions and then multiplying by 100%. An MDC% below 20% was considered to indicate acceptable random measurement error (19).
The practice effect was assessed by examining the mean difference between 2 testing sessions. Paired t-test and effect size (Cohen’s d) were adopted to examine the statistical significance of the mean difference and the size of the mean difference between test and retest, respectively. The Cohen’s d was the ratio of the mean difference between the 2 testing sessions to the SD of the total scores of both testing sessions. In terms of Cohen’s criteria, d ≤ 0.8 indicates a large practice effect; 0.50~0.79, medium; 0.20~0.49, small; and < 0.20, negligible (20).
RESULTS
Part 1: Development of the C-DVT
Stage 1: Characteristics of the C-DVT. To minimize the random measurement error and practice effect of the C-DVT, the expert panel suggested 3 primary designs. First, to reduce random measurement error, we increased the font size of the stimuli to approximately 36 pt (compared with a font size of 12 pt in the DVT) and presented only a column of 5 digits (0–9) without repeated digits in the middle of the computer monitor (Fig. 1). Therefore, participants could see the stimuli clearly and focus on searching for targets (i.e. the digit “6”) in the columns, without distractions from other stimuli. Secondly, to reduce practice effects, the digits in each column were randomly presented. Thus, it was difficult for participants to memorize the locations of the targets. Thirdly, we added 28 trials in a practice session before the formal testing to reduce a possible practice effect later on. Furthermore, to effectively and efficiently assess sustained attention, the expert panel suggested that 120 trials be conducted in the formal testing session. Because of the design, the number of stimuli in the C-DVT was lower than that in the DVT.
The operational interface of the C-DVT was developed on a personal computer with a 12-inch screen and an external keyboard comprising only 2 buttons (1 button with a circle [“O”] and the other with an X [“X”]) (Fig. 1). The C-DVT program was installed in a personal computer and administered in a web browser (e.g. Internet Explorer or Chrome).
Half of the trials in the practice and formal testing sessions displayed the target “6”, and every 4 trials had 2 trials with the target. In the trials with the target, the target was randomly displayed in the column (Fig. 1).
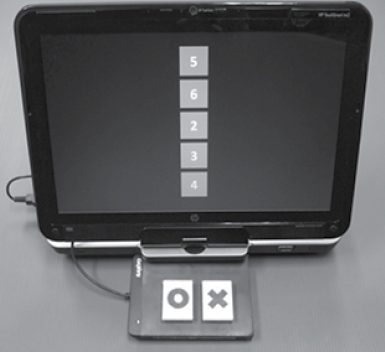
To perform the C-DVT, the participants were asked to press the “O” button on the external keyboard when the digit “6” was displayed on the screen. If the screen showed the other digits, the participants were asked to press the “X” button. The participants were instructed to press the buttons with their unaffected arms. After the participants pressed either of the buttons, the screen would display another column of 5 digits. The C-DVT automatically provided instructions (including oral and written forms), gave a demonstration, and recorded the results of the practice and formal test sessions.
The C-DVT recorded the completion time (in s) as the main indicator for sustained attention, as in the DVT. A shorter total time for completing the C-DVT represents better sustained attention. In addition, the other registrations (i.e. the number of errors, mean of hit-reaction time, and SD of the hit-reaction time) were also recorded. The hit-reaction time, the duration from the digits being displayed on the screen to the participants pressing the buttons, was recorded in each of the 120 trials.
Stage 2: Pilot testing of the C-DVT in college students and in patients with stroke. We first tested 20 college students to confirm the clarity of the administrative instructions and feasibility of the first version of the C-DVT. The college students gave comments on the instructions and presentations of the stimuli (e.g. ambiguous wordings of the instructions, or the colour and size of the stimuli). Revisions were made according to the comments, and the second version of the C-DVT was developed. The last 2 students had no comments on the test. Thus, no further testing was conducted on college students.
In addition, we tested the second version of the C-DVT individually on 5 patients with stroke. The first 3 patients suggested revising some of the administrative instructions. After the revision, the last 2 patients reported that the administrative instructions of the second version of the C-DVT were clear and that the administrative rules were easy to understand. Thus, no further testing was conducted. The final version of the C-DVT was thus completed. The patients required approximately 5 min to complete the whole test.
Part 2: Examination of the psychometric properties of the C-DVT
Sample characteristics. We approached 81 patients during the study period. Thirty-four patients were excluded, 32 for unwillingness to participate and 2 for the inability to perform the DVT due to severe presbyopia. Forty-seven eligible participants initially participated in this study and completed the first assessments. Of these participants, 3 were lost at the second assessments. Finally, 44 participants completed the assessments. All of the participants had stroke for more than 6 months, and the median time since stroke onset was 21.5 months. The numbers of errors in the C-DVT between 2 assessment sessions were not significantly different (Wilcoxon signed-rank test, p = 0.06). However, both the hit-reaction time and the standard deviation of the hit-reaction time had significant differences between 2 assessment sessions (Wilcoxon signed-rank test, p = 0.02 and 0.02, respectively). Further characteristics of the participants are shown in Table I.
|
Table I. Demographic characteristics and stroke-related information of the participants (n = 44) |
|
|
Characteristic |
Value |
|
Gender, n Male Female |
28 16 |
|
Age, years, mean (SD) |
56.9 (12.9) |
|
Education level, n Illiterate Elementary Middle school High school or vocational school University |
2 7 6 13 16 |
|
Stroke type, n Cerebral haemorrhage Cerebral infarction |
18 26 |
|
Side of hemiplegia, n Right Left |
21 23 |
|
Time since stroke onset, month, median (IQR) |
21.5 (12.0~54.3) |
|
Barthel Index |
17.3 (2.9) |
|
C-DVT |
|
|
Number of errors, median (IQR) |
|
|
1st assessment session |
1.0 (0.0~2.0) |
|
2nd assessment session |
1.0 (0.0~2.0) |
|
Hit-reaction time, s, median (IQR) |
|
|
1st assessment session |
2.4 (2.2~2.6) |
|
2nd assessment session |
2.4 (2.2~2.7) |
|
Standard deviation of the hit-reaction time, s, median (IQR) |
|
|
1st assessment session |
0.7 (0.6~0.7) |
|
2nd assessment session |
0.7 (0.6~0.8) |
|
IQR: interquartile range; C-DVT: computerized Digit Vigilance Test; SD: standard deviation. |
|
The Pearson’s skewness coefficients of the C-DVT and the DVT scores at 2 testing sessions were from 1.6 to 2.0, and those of the BI and the ADL CAT scores were –1.2 and –0.4, respectively.
Concurrent validity. The scores of the C-DVT were highly and significantly correlated with those of the DVT (ρ = 0.75, p < 0.001).
Ecological validity. The scores of the C-DVT were moderately and significantly correlated with those of the BI (ρ = –0.60, p < 0.001) (Fig. 2) and the ADL CAT (ρ = –0.57, p < 0.001) (Fig. 3).
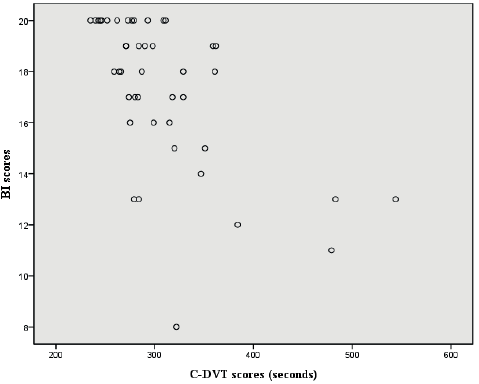
Fig. 2. Plot of computerized Digit Vigilance Test (C-DVT) scores against Barthel Index (BI) scores.
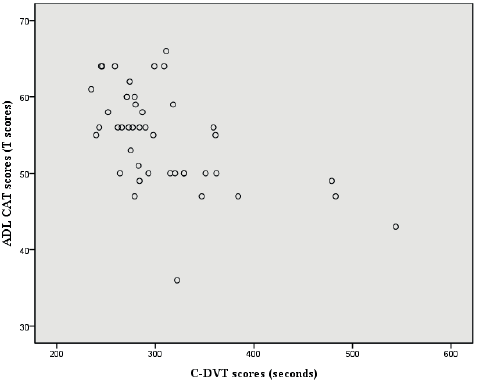
Fig. 3. Plot of computerized Digit Vigilance Test (C-DVT) scores against Activities of Daily Living Computerized Adaptive Testing system (ADL CAT) scores.
Test-retest agreement. Table II shows the mean scores of the 2 sessions and the mean change scores between assessments for the C-DVT and DVT. The ICCs of the C-DVT and DVT were 0.92 (95% CI = 0.85–0.96) and 0.93 (95% CI = 0.84–0.97), respectively.
Random measurement error. Table II shows that the MDC and MDC% of the C-DVT were 46.8 and 15.4%, respectively. The MDC and MDC% of the DVT were 211.2 and 33.0%, respectively.
|
Table II. Effect size d, ICC, MDC and MDC% of the C-DVT and DVT (n = 44) |
||||||||
|
Measure |
1st session Mean (SD) |
2nd session Mean (SD) |
Difference Mean (SD) |
ICC (95% CI) |
SEM (SEM%) |
MDC (MDC%) |
Effect size d |
p-value |
|
C-DVT |
307.6a (64.8) |
298.4a (54.4) |
9.1a (21.9) |
0.92 (0.85~0.96) |
16.9 (5.5) |
46.8 (15.4) |
0.15 |
< 0.001 |
|
(1/C-DVT) × 120 |
0.41b (0.07) |
0.41b (0.06) |
0.01b (0.02) |
0.92 (0.85~0.96) |
0.02 (4.4) |
0.05 (12.2) |
0.15 |
0.01 |
|
DVT |
666.6a (291.9) |
614.8a (285.1) |
51.8a (94.0) |
0.93 (0.84~0.97) |
76.2 (11.4) |
211.2 (33.0) |
0.18 |
< 0.001 |
|
(1/DVT) × 56 |
0.10c (0.04) |
0.11c (0.04) |
0.01c (0.15) |
0.90 (0.78~0.95) |
0.01 (11.7) |
0.03 (32.4) |
0.21 |
< 0.001 |
|
aUnits for the 1st session, 2nd session, and the corresponding difference score were s. bUnits were columns/s. cUnits were rows/s. C-DVT: computerized Digit Vigilance Test; DVT: Digit Vigilance Test; ICC: intra-class correlation coefficient; SEM: standard error of measurement; MDC: minimal detectable change. |
||||||||
Practice effect. The mean scores of the C-DVT and DVT between 2 sessions showed statistically significant improvement (both p < 0.01). The effect size of the practice effect of the C-DVT was 0.15, and that of the DVT, 0.18.
Data transformation. Because the distributions of the scores of the C-DVT and DVT were slightly skewed, we linearly transformed the scores of the C-DVT and DVT and re-examined the practice effect and random measurement error. The transformation involved calculating the reciprocals of scores and timing the number of columns/rows of each test. For example, if a participant’s score on the C-DVT was 300 s, the transformed score would be 0.4 ([1/300]*120 [there are 120 columns of the C-DVT]) columns/s. The Pearson’s skewness coefficients of the transformed scores of the C-DVT and DVT were –0.9~–1.0 and 0.7~–0.1, respectively. The values of the practice effect (e.g. effect size d) and random measurement error (e.g. SEM% and MDC%) in the transformed scores appeared close to those of the original scores. For example, regarding the MDC% of the C-DVT, 12.2% of the transform scores appeared close to 15.4% of the original scores. Table II shows the further values of the transformed scores of both the C-DVT and the DVT.
DISCUSSION
We developed the C-DVT for assessing sustained attention in patients with stroke and conducted a preliminary examination of the concurrent validity, ecological validity, and test-retest reliability of the C-DVT in patients with stroke. The C-DVT has 3 advantages over the DVT. First, the C-DVT can reduce the administrative labour for raters. The C-DVT can be independently completed by a patient because the test can automatically provide instructions, give a demonstration, and record the test results. Secondly, the C-DVT has better efficiency for evaluating sustained attention. The mean time for completing a formal testing session of the C-DVT is much shorter (303.0 s for the C-DVT vs 640.7 s for the DVT) mainly because the number of stimuli in the C-DVT is lower. Thirdly, the feasibility of the C-DVT is better than that of the DVT. Participants can read the stimuli and make responses more easily when performing the C-DVT because of the larger font size of the stimuli (36 pt on the C-DVT vs 12 pt on the DVT) and the easier motor requirement for making responses (pressing the buttons with an unaffected hand in the C-DVT vs crossing out digits with a pen in the DVT). Given the aforementioned advantages, the C-DVT might be a useful and efficient assessment tool for users to assess sustained attention.
Concurrent validity refers to the extent of association between a test (i.e. the C-DVT in this study) to be examined and its original test (i.e. the DVT) (21). The higher the association, the more similar the construct assessed by both measures (21). We found a high correlation between the scores of the C-DVT and those of the DVT. This finding indicates that the testing results of the C-DVT have sufficient concurrent validity. The sufficient concurrent validity indicates that the C-DVT assesses the same construct as the DVT, which is sustained attention. Therefore, the C-DVT might be able to assess sustained attention in patients with stroke.
Ecological validity refers to the extent of association between patients’ performance on a test and patients’ performance in the real world (22). Tests with good ecological validity can help users employ test results to predict functional performance in daily life (22). Moderate correlations were found between the scores of the C-DVT and those of both the BI and the ADL CAT. This finding indicates that the test result of the C-DVT has sufficient ecological validity. The results indicate that the test results of the C-DVT can reveal ADL performance in patients with stroke. Thus, the test results of the C-DVT are useful for clinicians to predict patients’ level of independence in daily life. In addition, the validated ecological validity of the C-DVT supports the clinical utility of the C-DVT.
The ICC values of both the C-DVT and the DVT were excellent. These findings indicate that the test-retest agreements of the C-DVT and DVT were excellent over a 2-week interval. The excellent test-retest agreement indicates that the scores of both tests are consistent between test and retest. Thus, the C-DVT and DVT are suitable for repeated assessments in patients with stroke.
We found that the MDC% (15.4%) of the C-DVT was less than half of that of the DVT (33.0%). These results indicate that the random measurement error of the C-DVT was smaller than that of the DVT and satisfactory for follow-up assessments. In addition, the MDC of the C-DVT shows that if a change score between repeated assessments is greater than 46.8 s, the user can consider that score to indicate true change in sustained attention with a 95% confidence level. These findings indicate that the design of the C-DVT provides substantially lower random measurement error than that of the DVT. The limited amount of random measurement error indicates that the C-DVT can serve as a useful test in both clinical and research settings.
Although the practice effects of the C-DVT and DVT were statistically significant, the amount (effect size) of improvement was small. The improvement was only 3.0% of the score of the second assessment (9.1/298.4) of the C-DVT and 8.4% (51.8/614.8) for the DVT. These results indicate that the practice effect of the C-DVT is smaller than that of the DVT and is negligible. These findings indicate that our design of the C-DVT, compared with the DVT, was effective in reducing the practice effect.
In addition to the total completion time of the C-DVT, the number of errors, mean of hit-reaction time, and SD of the hit-reaction time of the C-DVT were investigated. The number of errors of the participants, which reflects the accuracy of performance, was very low in the 2 assessment sessions. This finding and the observations of a short hit-reaction time and a low SD indicate that the participants could follow the rules of the test to perform the C-DVT. It is noted that traditional paper-and-pencil tests (e.g. the DVT) cannot record the hit-reaction time (e.g. the mean and SD of hit-reaction time) during the testing session. Therefore, these indices could not be compared between the DVT and C-DVT, and the interpretation and application of these indices are thus limited in the present study. Further psychometric examinations of these indices in the C-DVT are needed.
Although the C-DVT has been shown to have satisfactory efficiency and psychometric properties in patients with stroke, patients will be unable to complete the C-DVT if they have any of the following 3 conditions: dysfunction in both hands (i.e. inability to press the button using either hand); severe visual deficits (i.e. inability to read the stimuli presented at a font size of 36 pt on a screen); and severe cognitive impairments (i.e. inability to judge whether the digit “6” is presented on the screen and/or inability to decide which button should be pressed). The above criteria of the C-DVT provide useful information for clinicians and researchers to exclude unsuitable stroke patients from completing the test.
The C-DVT recorded the completion time as the main indicator for sustained attention, but some confounding factors, such as patients’ motor impairments and eye-hand coordination, may influence the completion time of the C-DVT. Such an issue also exists in the DVT score. To reduce the influence of motor impairments on the completion time, the patients with stroke were instructed to perform the C-DVT using their unaffected hands. However, we might not have removed all of the confounding factors from the completion time of the C-DVT. Therefore, the possible confounding factors should be considered when interpreting the completion time of the C-DVT.
This study has 2 limitations. First, the samples were convenience samples. The participants were relatively young with a high education level, and there was a high proportion of hemorrhagic patients. Thus, the representativeness of our sample and generalization of our results might have been limited. Secondly, the other psychometric properties (e.g. responsiveness and minimal important difference) and diagnostic sensitivity of the C-DVT have not been examined, which may limit the utility of the test.
In conclusion, the C-DVT was developed for assessing sustained attention with a limited amount of random measurement error. Our preliminary findings showed that the C-DVT had satisfactory concurrent validity, ecological validity, and test-retest reliability in patients with stroke. However, further psychometric examinations of the C-DVT are needed to establish robust evidence for the C-DVT to be used to assess sustained attention in patients with stroke.
Acknowledgments
This study was supported by a research grant from the Chi Mei Hospital. The grand numbers were CSMU-CMMC-101-06 (CMCSMU10105).
REFERENCES

