Justine M. Naylor, PhD1,2,3, Jack Crosbie, PhD4 and Victoria Ko, PhD2
From the 1Whitlam Orthopaedic Research Centre, Liverpool Hospital, Liverpool, 2South West Sydney Clinical School, University of New South Wales, Sydney, 3Ingham Institute for Applied Medical Research, Liverpool and 4School of Science and Health, University of Western Sydney, Campbelltown, NSW, Australia
OBJECTIVE: To determine whether total knee arthroplasty recipients demonstrating comparatively poor mobility at entry to rehabilitation and who received supervised therapy, had better rehabilitation outcomes than those who received less supervision.
DESIGN: Retrospective analysis of randomized trial data.
Patients: Total knee arthroplasty participants randomized to supervised (n = 159) or home-based therapy (n = 74).
METHODS: Participants were dichotomized based on mean target 6-min walk test (6MWT) pre-therapy (second post-surgical week). Absolute and change in 6MWT and Western Ontario and McMaster Universities Osteoarthritis Index (WOMAC) Pain and Function subscales amongst low performers in the supervised (n = 89) and unsupervised (n = 36) groups were compared, as were high performers in the supervised (n = 70) and unsupervised (n = 38) groups.
RESULTS: Low performers in the unsupervised compared with the supervised group demonstrated significantly poorer 6MWT scores (absolute δ = 8.5%, p = 0.003; change δ = 8.1%, p = 0.007) when therapy ceased (10 weeks post-surgery). No differences in 6MWT were observed between the high performing subgroups or in the recovery of WOMAC subscales between any subgroups.
CONCLUSION: Individuals manifesting comparatively poor mobility at the commencement of physiotherapy may recover their mobility, but not perceived function, more quickly if streamed to supervised therapy.
Key words: arthroplasty; rehabilitation; physical therapy; ambulation.
J Rehabil Med 2015; 47: 00–00
Correspondence address: Justine M. Naylor, Orthopaedic Department, Liverpool Hospital, Locked Bag 7103, Liverpool BC 1871, Sydney, NSW, Australia. E-mail: Justine.Naylor@sswahs.nsw.gov.au
Accepted Sep 15, 2014; Epub ahead of print Dec 1, 2014
Introduction
The provision of physiotherapy-based rehabilitation after total knee arthroplasty (TKA) is seemingly ubiquitous (1–9), yet its role in restoring mobility and function after surgery remains unclear. Optimization of rehabilitation post-TKA is important, given that TKA surgery increases annually and yet the downstream resources available for rehabilitation do not (3, 10, 11). Several systematic reviews of randomized controlled trials (RCT) have concluded that there is insufficient evidence to support any single mode of rehabilitation over any other after TKA (10, 12, 13). Our own recently completed RCT (the largest to date in this area (n = 249)) provides strong evidence that one-to-one outpatient-based physiotherapy does not provide superior patient-reported or objectively measured outcomes compared with group- or home-based programmes (14). Our findings add to the existing evidence indicating that face-to-face supervised programmes provide no additional benefit to patients over home-based and telerehabilitation programmes after TKA (15–20). In essence, these findings collectively suggest that closely supervised physiotherapy is not routinely warranted after surgery for the “typical” TKA patient. What no study has addressed to date, however, is whether patients who present with the greatest impairment at entry into post-surgical rehabilitation actually benefit more from programmes that provide higher level supervision compared with those characterized by low-level supervision. We know that patients are discharged from acute care with differing levels of attainment of functional milestones, measured using markers of knee and functional mobility (21–23); the variation in part explained by variation in pre-operative presentation (21). Whether patients then vary in their response to a post-acute rehabilitation stimulus based on their presentation on entry to their rehabilitation programme is unknown.
In our 3-armed trial comparing 12 sessions of one-to-one physical therapy provided over a 6-week period following TKA with 12 sessions of exercise-based group therapy or with a 6-week monitored home programme (14), we demonstrated that one-to-one therapy did not result in superior patient-reported knee pain and function as measured with the Oxford Knee Score (OKS) (24) (median OKS 32, interquartile range (IQR) 27–38, n = 85) compared with the other less intensive rehabilitation modes (“Group” median 36, IQR 27–40, n = 84; “Monitored Home Programme” median 34, IQR 28–40, n = 80). Furthermore, similar recovery patterns up to one year were observed for all 3 modes for all the secondary outcomes, including the 6-min walk test (6MWT), passive knee flexion and extension range, quadriceps lag, and health-related quality of life. In this same study, our inclusion criteria were deliberately broad, such that most patients, regardless of baseline disability, age, co-morbidity and level of obesity, were eligible to participate in the study. Our decision to employ broad inclusion criteria was motivated by 2 key aspirations: first, that, by incorporating the true spectrum of patients who present for surgery, the “generalizability” of our findings, and hence their widespread translation into clinical practice, would be facilitated; secondly, that the heterogeneity of our cohort would potentially enable subgroup analysis based on entry-level performance. Thus, we sought to explore the construct that poor performers at entry to rehabilitation respond differently to different levels of supervision.
Using the results from the aforementioned RCT, this study tested the hypothesis that different patients respond differently to varying levels of supervised rehabilitation. Specifically, the study aimed to determine whether patients who present with more mobility limitation at the commencement of rehabilitation after TKA, benefit more if they receive closer supervision during their rehabilitation. Ultimately, the findings provide preliminary insights into the value of rehabilitation streaming; that is, that patients with the most limitation are appropriately identified and then offered access to the programmes providing more supervision whilst those with less impairment can be managed with less. There is significant value from both a patient perspective as well as a public health perspective in knowing who benefits most from supervised physiotherapy given the projected increases in the demand for rehabilitation and the limited downstream (post-acute) resources available (3, 10, 11, 25).
MethodS
Cohort ascertainment and retention
Cohort attainment and retention for the original RCT have been described previously in detail (14). The original trial was approved by the South West Sydney Area Health Service Human Research Ethics Committee and publically registered on the Australian New Zealand Clinical Trial Registry (ACTRN12609000476235). In brief, 554 people awaiting TKA at 2 public hospitals were screened for eligibility. Exclusion criteria were: inability to comprehend the study material (available in English, Arabic and Spanish translations); unavailable for follow-up 6 months after commencement of the trial, and; co-morbidity, such as severe cardiac or respiratory disease, that would render the subject unable to participate in an unsupervised exercise programme. Postoperative exclusion criteria included: restricted weight-bearing through the index knee, deep surgical site infection or joint instability. Ultimately, 347 people were deemed eligible and, of these, 283 consented to participate. A total of 249 people were eventually randomized to 1 of the 3 treatment arms, as 34 of the consenting patients had their surgery cancelled or became ineligible post-surgery. Fig. 1 summarizes cohort ascertainment and retention, and the definitive sub-grouping for the secondary analyses.
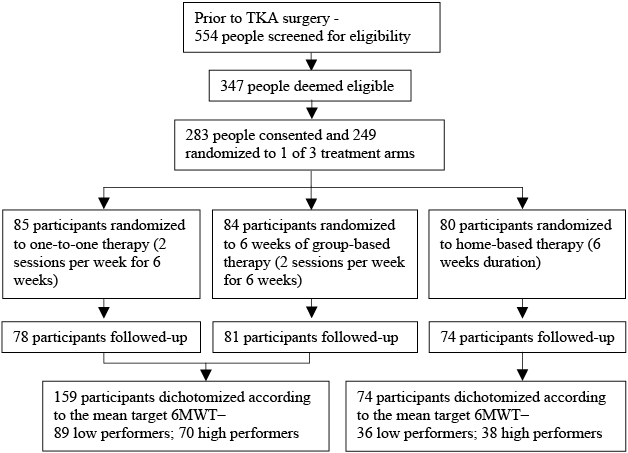
Fig. 1. Cohort ascertainment, recruitment and follow-up. TKA: total knee arthroplasty; 6MWT: 6-min walk test.
Randomization and intervention protocols
At 2 weeks post-surgery, participants were randomized to 1 of 3 treatment arms delivered over a 6-week period: 12 one-to-one sessions; 12 group-based therapy sessions; or a monitored home programme (MHP). The randomization sequence was computer-generated in blocks of 30, stratified by site. Following the 2-week assessment, consecutive patients at each site were given their randomization via a consecutively numbered sealed envelope from an administrative assistant. Participants in the one-to-one or group-based programmes were prescribed an exercise-based home programme in addition to the supervised sessions to be conducted twice per week. Those in the MHP were given the same home programme, to be conducted 4 times per week. Home programme participants were assessed twice by a physical therapist; at the beginning of formalized rehabilitation (2 weeks post-surgery) and at 4 weeks post-surgery. They were subsequently monitored via a telephone assessment at 6-weeks post-surgery. The content of the group-based programme and MHP are described in detail elsewhere (14, 26), but are summarized in Table I, and participants in the one-to-one programme received manual therapy, therapeutic modalities and additional specific exercises as appropriate.
|
Table I. Components of group-based and home exercise programmes |
||
|
Group-based programme circuit class (4 min for each functional exercise station, dose progressed by therapist at each session) |
Home exercise programme and initial dose given to all participants at commencement (dose progression by 6th week in MHP) |
|
|
Warm-up |
Brisk walking, exercise at parallel bars, stretching (5 min) |
Brisk walking (5 min) |
|
Functional exercises |
Sit down and getting up from chair, progressed by increasing repetitions and transfer to semi-squats |
Sit down and getting up from chair, 2 sets of 10 repeats, both hands for support [2 sets of 15 repeats, semi-squat without support, with weighted backpack (up to 5 kg)] |
|
Step-ups using a step, progressed by repetition and step height |
Step-ups using a step or bounded telephone books, 2 sets of 10 repeats, support permitted [2 sets of 15 repeats, with weighted backpack (up to 5kg)] |
|
|
Knee flexion/pedals/ stationary cycling as prescribed by therapist |
Calf raises, 2 sets of 10 repeats, both hands for support [2 sets of 15 repeats, single leg, light support with 1 hand] |
|
|
Arm ergometry/free weights, progressed by increasing resistance |
Arm raises in standing, 2 sets of 15 repeats [2 sets of 20 repeats with free weights] |
|
|
Stairs retraining, progressed by repetition, and withdraw from the use of walking aid or rail |
Standing knee flexion, and single leg standing, 1 set of 10 repeats [1 set of 15 repeats each leg] |
|
|
Balance mat (standing in centre of grid on a foam mat, patient steps onto outer square with one foot in different directions, while keeping other foot in the centre, then return to centre) |
Standing hip extension, and single leg standing, 1 set of 10 repeats [1 set of 15 repeats each leg] |
|
|
Shoulder range of motion in standing, 2 sets of 15 repeats [2 sets of 10 repeats with free weights] |
||
|
General aerobic exercise |
Marching, obstacle walking, upper and lower body movement exercises, under leadership of therapist (10 min) |
Walking ± stationary cycling, 10 min level ground walking ± 10 min cycling with no resistance [20 min walking on hilly terrain ± 15 min of cycling with resistance] |
|
Cool-down |
General stretches including quadriceps, hamstrings and calf stretch (5 min) |
Quadriceps stretch, hamstrings stretch, calf stretch, 3 times 15 s each leg |
|
MHP: monitored home programme. |
||
Baseline assessment and patient outcomes
At the baseline assessment conducted at the pre-operative education session 2–6 weeks prior to surgery, several patient-administered surveys and physical tests were used to assess patient-centric limitations. The complete list of tests conducted are reported elsewhere (14), but relevant to this secondary analysis were the Western Ontario and McMaster Universities Osteoarthritis Index (WOMAC) Visual Analog 3.0 pain and function subscales (27). At 2-weeks post-surgery, the WOMAC scores and the 6MWT (28) (measured by instructing the participant to walk as far as possible along a 25-m internal walkway, with aids if required), were measured. At all subsequent assessments (at 10, 26 and 52 weeks post-surgery) all questionnaires and the 6MWT were repeated. All assessments were performed by the same outcome assessor, who was blind to treatment allocation.
Sample size and analysis
The original RCT was powered to detect a moderate difference in the OKS (a 0.5 standard deviation) between the one-to-one group and either of the other 2 groups if such a difference existed. A minimum sample of 64 in each arm was required. When the RCT concluded, 83 participants were available at the 10-week follow-up in each of the supervised arms and 80 were available in the MHP; 78, 81 and 74 participants from the one-to-one, group and home-based programmes respectively remained available at 1 year. Because no superiority of the one-to-one programme was observed for any of the outcomes measured, we combined the 2 supervised groups (the one-to-one and group-based cohorts) to construct a single larger group. We then made comparisons between the supervised group and the home-based group using data from subjects who were tracked over the entire 1-year period. To perform these comparisons, we dichotomized individuals in each of the 2 groups based on the 6MWT; those performing above the mean and those performing below the mean 2 weeks post-surgery. This manipulation procured a sample of 89 and 70 in the low or high performer sub-groups, respectively, in the supervised arm, and 36 and 38 in low and high performer sub-groups, respectively, in the unsupervised arm. This sample distribution provided 94.6% power at the 0.05 level.
We used the 6MWT to dichotomize the cohort, as opposed to a patient-reported measure, for several reasons. First, restoration of mobility is a well-recognized goal of exercise-based rehabilitation programmes after TKA (1, 5, 9) as it is fundamental to recovery of many functional activities and its measurement can be readily undertaken in the early post-surgical period where rehabilitation streaming would be relevant. In contrast, the OKS refers to a patient’s symptoms over the preceding month (24) and thus cannot be used to distinguish performers in the early post-surgical period when decisions about rehabilitation participation are under consideration. Secondly, mobility can be objectively measured without concern for the literacy level of the patient, which is a consideration for patient-reported survey data. Thirdly, performance in the 6MWT 1-year post-surgery strongly predicts performance in a 30-min walk test following TKA (29); thus, construct validity of the 6MWT as a measure of functional ambulation appears to be excellent. Fourthly, prediction models based on healthy age-matched norms are available for the 6MWT (30); whereas, modelling for the patient-reported outcomes is limited by their ceiling effects in people with little or no arthritic disease. Thus, by using the 6MWT, we were able to objectively categorize patients based on “target” norm-based data.
The target 6MWT distances were determined using the prediction model of Troosters et al. (31), which was derived from a comparable aged population to our subjects, accounts for age, gender and anthropometrics, and was the same model we used to analyse data from a previous RCT comparing land-based with water-based rehabilitation after TKA in which the 6MWT was the primary outcome (32).
In this model:
6MWT target = 218 + 5.14 × height (cm)–5.32 × age (years)–1.8 × body mass (kg) + 51.3 × gender (0 = female; 1 = male).
Thus, for each subject a value was obtained for the target 6MWT distance and actual values obtained were scaled as a percentage of this target value. The mean value of the target 6MWT for the cohort as a whole was used to dichotomize the sample.
Following separation of the treatment groups into upper and lower performance subgroups based on the 6MWT, data for 6MWT and for the WOMAC pain and function scores were compared using repeated measures analysis of variance (RM-ANOVA) with a 4 × 2 × 2 design (time interval × performance level × level of supervision). Tukey’s post-hoc analysis was used to determine between- and within-group differences. Two-way analysis of variance (ANOVA) was used to compare change scores between week 2 and week 10 and between week 10 and week 52 for the 3 outcome variables. In order to determine the number of participants who could be considered “asymptomatic” with respect to either pain or function (according to WOMAC subscales), each person’s scores were compared with the 95th percentile values for their age and gender, as reported by Bellamy et al. (33) on each assessment occasion. The alpha level for all analyses was set at 0.05. We did not adjust (lower) the level of significance for the secondary analyses because the small sample sizes of the MHP subgroups already predisposed us to making a type II error; that is, failing to reject the null hypothesis when it is false.
Results
The mean for the 6MWT at 2 weeks post-surgery was 36.7% (standard deviation; SD 14.2) of the target 6MWT; this value was used to partition subjects into upper and lower performance sub-groups in each of the supervised and MHP treatment groups. No significant differences were found between or within sub-groups for age (F3,230 = 1.574; p = 0.197) or gender mix (χ2 = 0.365; p = 0.947) (Table II), nor for the distribution of participants into upper or lower performers (χ2 = 1.484; p = 0.223). There was a small, statistically significant difference in BMI between the MHP groups and the lower level performers in the supervised exercise groups (p = 0.017), with the MHP groups having slightly lower BMI values. Female subjects were in the majority (139 to 79); mean age 66.5 years (SD 8.9) [female] and 68.5 years (SD 8.0) [male].
|
Table II. Subject characteristics. Sub-classifications based on 6-min walk test (6MWT) score 2 weeks post-surgery |
||||||
|
Total Mean (95% CI) |
MHP |
Supervised exercise |
||||
|
Lower n = 36 Mean (95% CI) |
Upper n = 38 Mean (95% CI) |
Lower n = 89a Mean (95% CI) |
Upper n = 70b Mean (95% CI) |
|||
|
Age, years |
67.1 (66.0, 68.2) |
65.7 (62.6, 68.8) |
67.5 (64.8, 70.2) |
68.5 (66.8, 70.2) |
65.8 (63.6, 68.0) |
|
|
BMI |
32.7 (32.0, 33.4) |
31.1 (29.2, 33.0) |
31.5 (30.1, 32.9) |
33.8 (32.5, 35.1) |
32.9 (31.6, 34.3) |
|
|
Gender mix, F:M |
139:79 |
23:13 |
23:15 |
58:31 |
43:27 |
|
|
a46 group, 43 individuals. b34 group, 36 individuals. MHP: monitored home programme; BMI: body mass index; F: female; M: male; CI: confidence interval. |
||||||
6MWT
Upper and lower subgroups by level of supervision. Performance in the 6MWT (Table III; Fig. 2) produced predictably significant differences between upper and lower groups at 2 weeks (p < 0.001), which persisted until week 26, after which the MHP group was not separated (p = 0.173), although the supervised exercise group persisted in demonstrating a division between upper and lower performers (p = 0.018). The lower performers in MHP, while not different to those in the supervised exercise groups at 2 weeks, were significantly poorer in their performance at 10 weeks (p = 0.003; difference (δ) = 8.5%). By week 26, and again at week 52, the differences between lower performers in MHP and supervised groups was not significant (p = 0.27; p = 0.74). In the upper performers there were no statistically significant, between-group differences at any stage (p > 0.2).
|
Table III. Six-min walk test (6MWT) performance (2 classifications × 2 groups) |
|||||||
|
Treatment group |
6MWT (% target) |
Change in performance (%) |
|||||
|
2 weeks Mean (95% CI) |
10 weeks Mean (95% CI) |
26 weeks Mean (95% CI) |
52 weeks Mean (95% CI) |
2–10 weeks Mean (95% CI) |
10–52 weeks Mean (95% CI) |
||
|
MHP |
|||||||
|
Lower |
25.3 (22.7–28.0)a |
57.0 (52.8–61.1)ab |
65.4 (60.2–70.6)a |
69.9 (64.6–75.3) |
31.4 (26.5–36.3)ab |
13.4 (8.7–18.1)ab |
|
|
Upper |
50.9 (47.8–54.1)a |
71.7 (66.1–77.3)a |
74.9 (70.7–79.0)a |
75.3 (70.5–80.0) |
21.7 (16.9–26.4)a |
3.8 (–0.7–8.3) |
|
|
Supervised (group + individual) |
|||||||
|
Lower |
26.4 (25.0–27.8)a |
65.4 (62.3–68.6)ab |
68.7 (64.9–74.2)a |
68.8 (64.8–72.8)a |
39.5 (36.2–42.8)ab |
3.4 (0.1–6.8)b |
|
|
Upper |
48.7 (46.5–51.0)ab |
75.3 (72.4–78.2)a |
77.0 (74.2–79.9)a |
75.3 (71.5–79.0)a |
26.2 (22.9–29.6)a |
0.3 (–3.1–3.5) |
|
|
aWithin-group difference (p < 0.05). bBetween-group difference (p < 0.05). 95% CI: 95% confidence interval; MHP: monitored home programme. |
|||||||
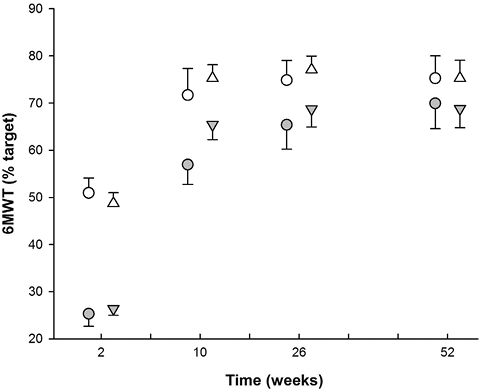
Fig. 2. Simple division based on 6-min walk test (6MWT) at 2 weeks, comparison of home programme with pooled data from “Supervised” treatment groups. Closed circles: lower monitored home programme (MHP); Open circles: upper MHP; Closed triangles: lower supervised; Open triangles: upper supervised.
With respect to the change in performance between week 2 and week 10, the lower sub-group of the MHP subjects were significantly poorer than the lower sub-group of the supervised exercise subjects (p = 0.007; δ = 8.1%). The period between week 10 and week 52, however, was marked by a reversal of this finding, with the lower performers in the MHP group recovering lost ground and demonstrating a significantly greater improvement than was seen in the supervised exercise group (p = 0.001; δ = 10%).
Study groups vs normative data. At 52 weeks, fewer than 14% of all subjects had achieved 90% of their target distance at 1-year post-surgery and a total of only 5 subjects (2.3%) walked to or above their predicted target distance.
WOMAC subscales
Upper and lower subgroups by level of supervision. No significant differences were noted in absolute WOMAC function scores at any time-point, either between or within sub-groups (Tables IV and V). The only significant change score in WOMAC Function was between weeks 10 and 52, where the lower performers in the supervised exercise group perceived statistically greater improvement than the lower performers in the MHP group (p = 0.003; δ = 9.4%). We note the performance criterion (6MWT) indicated the opposite result, with the MHP sub-group improving by 10% more than the supervised group. Regarding WOMAC Pain scores, while levels of pain improved over the course of the study, particularly between weeks 2 and 10, there were no differences (absolute of change scores) between or within groups.
|
Table IV. Western Ontario and McMaster Universities Osteoarthritis Index (WOMAC) Function scores based on 6-min walk test (6MWT) partition |
||||||||
|
Treatment group |
WOMAC Function |
Change in perception (%) |
||||||
|
Pre operative Mean (95% CI) |
2 weeks Mean (95% CI) |
10 weeks Mean (95% CI) |
26 weeks Mean (95% CI) |
52 weeks Mean (95% CI) |
2–10 weeks Mean (95% CI) |
10–52 weeks Mean (95% CI) |
||
|
MHP |
||||||||
|
Lower |
103.4 (90.8–116.0) |
89.5 (79.3–99.8) |
39.9 (28.2–51.7) |
35.6 (25.0–46.1) |
31.7 (20.0–43.5) |
27.7 (21.2–34.2) |
1.8 (–3.4–6.9)a |
|
|
Upper |
100.5 (104.7–118.3) |
76.1 (66.3–85.9) |
30.8 (22.4–39.3) |
28.7 (19.4–38.0) |
23.2 (14.4–32.1) |
25.1 (17.6–32.7) |
4.2 (0.6–7.9) |
|
|
Supervised (group + individual) |
||||||||
|
Lower |
111.5 (104.7–118.3) |
90.0 (84.5–97.3) |
44.9 (38.2–51.6) |
31.9 (25.1–38.6) |
24.9 (18.9–31.0) |
25.4 (21.2–29.6) |
11.2 (7.4–15.0)a |
|
|
Upper |
105.2 (97.3–113.1) |
82.4 (74.6–90.2) |
37.3 (30.4–44.3) |
28.6 (20.9–36.3) |
24.0 (17.4–30.6) |
25.1 (20.4–29.7) |
7.2 (3.8–10.6) |
|
|
aBetween-group difference (p < 0.05). 95% CI: 95% confidence interval; MHP: monitored home programme. |
||||||||
|
Table V. Western Ontario and McMaster Universities Osteoarthritis Index (WOMAC) Pain scores based on 6-min walk test (6MWT) partition |
|||||||||
|
Treatment group |
WOMAC Pain |
Change in perception (%) |
|||||||
|
Pre-operative Mean (95% CI) |
2 weeks Mean (95% CI) |
10 weeks Mean (95% CI) |
26 weeks Mean (95% CI) |
52 weeks Mean (95% CI) |
2–10 weeks Mean (95% CI) |
10–52 weeks Mean (95% CI) |
|||
|
MHP |
|||||||||
|
Lower |
29.4 (25.6–33.2) |
23.1 (19.2–27.1) |
11.4 (7.7–15.1) |
9.9 (6.5–13.3)a |
6.5 (3.7–9.3) |
23.3 (14.4–32.3) |
6.8 (0.8–12.8) |
||
|
Upper |
27.7 (24.6–30.8) |
20.3 (17.5–23.1) |
7.8 (5.5–10.1) |
6.0 (3.7–8.3)a |
4.7 (2.5–6.9) |
25.1 (18.0–32.2) |
6.2 (1.7–10.6) |
||
|
Supervised (group + individual) |
|||||||||
|
Lower |
29.2 (26.9–31.5) |
20.5 (18.6–22.3) |
12.5 (10.4–14.5) |
8.0 (6.2–9.7) |
6.1 (4.5–7.8) |
16.3 (11.7–20.9) |
12.7 (8.4–16.9) |
||
|
Upper |
27.8 (25.2–30.4) |
18.6 (16.1–21.1) |
10.1 (8.1–12.2) |
6.8 (4.7–8.9) |
5.1 (3.5–6.7) |
17.3 (11.9–22.7) |
9.5 (6.2–12.7) |
||
|
aWithin-group difference (p < 0.05). 95% CI: 95% confidence interval; MHP: monitored home programme. |
|||||||||

Study groups vs normative data. Comparing the WOMAC function scores against normative values (35), 30% of all participants reached scores that could be considered asymptomatic for their age and gender. Using similar criteria, 68% of subjects were essentially pain-free at 52 weeks. No differences in incidence were found between MHP and supervised exercise groups.
Discussion
Heterogeneity in clinical presentation of patients with the same underlying condition may mean that individuals respond differently to a given therapeutic stimulus. With respect to rehabilitation programmes, anecdotally at least, physical therapists and patients harbour the view that a “one size fits all” approach after TKA may not be appropriate (5, 34). Determining what rehabilitation approach is the most appropriate, and for whom and at what cost, is an ongoing challenge for clinicians in this area and across many rehabilitation genres (25).
By dichotomizing patients who were randomized to a more highly supervised face-to-face rehabilitation or a less supervised home programme based on entry-level mobility, we have explored the construct that patients who present with poorer mobility at the commencement of rehabilitation may benefit more from the more supervised programmes. We found that those participants whose target 6MWT distance at 2 weeks was less than the mean target value seemed to respond better to a supervised rehabilitation programme than to a less supervised mode of therapy. In contrast, those who were able to perform the 6MWT to a higher level (the higher performers at entry to rehabilitation) did equally well in either treatment arm. Whilst the differences in recovery had disappeared by 26 and 52 weeks, it is possible that early differences are worthwhile if they result in a more rapid return to work, recreational activity, or a lower level of health resource utilization.
Based on the regression equation used to set the target 6MWT distance (32), the watershed value for females in this group was 195 m and, for males, 230 m. This suggests that, in a comparable sample, females who cannot walk 200 m and males who cannot walk 230 m in 6 min might be better undergoing rehabilitation in a supervised environment, while those who can walk further than these distances are likely to do equally well with a less supervised mode of therapy.
To date, there has been no exploration of responsiveness to supervised vs non-supervised rehabilitation after TKA. Our results are preliminary, in that they are analyses based on retrospective subgroups, but they are likely to resonate with clinicians who hold the view that some patients “need” supervised therapy after TKA. We can only speculate about the reasons why poor performers recover their mobility faster, at least in the short term, if they are provided supervised therapy. Given that the poor performers across the supervised and non-supervised groups did not differ in terms of gender and age, and the mean BMI was slightly lower amongst the unsupervised group, the better short-term recovery in the supervised group is not explained by a worse anthropometric profile in the unsupervised group. We also found no differences in the number or nature of comorbidities among the various subgroups (data not shown), nor were high and low performers separated by any discernible physical characteristics. We contend that supervised therapy provides an environment that is intrinsically linked to the presence of a therapist, whether that is the motivation or targeted direction afforded by the face-to-face contact, which people lacking in physical capacity require to achieve better performance. It is possible that supervision ensures exercise progression occurs as expected, whereas progression may be suboptimal when left to the patient alone. We are unable to confirm this hypothesis, as the documentation detailing exercise progression within an individual was often incomplete, especially for the MHP participants (14). Thus, at this point in time, we do not understand all the reasons why some patients present with very poor mobility relative to their age-matched peers within the first weeks after surgery, but whatever it is, it appears, in part, to be modifiable by supervision, whether that be in a group or one-to-one context.
The lack of a similar set of findings to those found in 6MWT with respect to perceived function or pain (WOMAC scores) is interesting. The disconnect between perception and performance in people with osteoarthritis has been noted recently (35). Our finding that, while 68% of subjects perceived themselves to be pain-free and 30% perceived their function to be normal, only 2.3% were able to walk their target distance 12 months after surgery, lends further support to the observation that self-report measures may reflect factors other than performance (35) and clinicians need to be aware of the lack of association between the 2 measures in planning treatment.
Strengths and limitations of the study
The strengths of our analyses lie in the design of the original study. We deliberately recruited a heterogeneous sample to enable future subgroup analyses. Furthermore, treatment allocation was concealed and randomized. Allocation concealment and randomized assignment of the original treatment groups render the risk of treatment selection bias non-existent. The subsequent merging of 2 of the 3 treatment arms, by virtue of the fact they were randomly assigned to start with, means the strengths afforded by randomization are preserved. Thus, response differences between the poor performers in each group can be attributed to the differences in their assigned treatments. Furthermore, the subdivision based on target rather than absolute 6MWT scores means that between-person performance can be appreciated independent of physical characteristics that naturally separate people in the absence of impairment.
These study strengths notwithstanding, our conclusions are limited by the fact that the sample size for the MHP group is smaller than ideal. Just as the primary analysis required 64 in each group in order to detect a moderate difference in the primary outcome, our subgroup analysis also ideally required 64 in each subgroup. By combining the supervised arms, we acquired a sufficiently large supervised treatment group with the requisite number in each dichotomized component, but the number of complete data-sets in the home-based group was smaller than desired (low, n = 36; high, n = 38). Because the trial was not funded by an external source and thus relied on existing rehabilitation and research resources, we were unable to justify continuation of the study beyond the time already taken to obtain the minimum cohort required for the primary analysis. A larger sample, therefore, might have revealed differences in recovery of the patient-reported domains based on entry-level performance in addition to what was observed in the mobility domain.
Furthermore, while it is clear that supervised rehabilitation requires more resources per individual participant, we are unable to draw conclusions about the cost-effectiveness of highly supervised vs less supervised programmes. Therefore, whilst it appears that supervised therapy is better for those with the greatest mobility limitation in the short-term, it is not clear whether the extra resources directed towards this subset are cost-effective. We contend that further exploration of responsiveness to rehabilitation amongst poor performers, including cost-effectiveness analyses and effects on return-to-work times or recreational activities, would be a valid and important initiative. We also recommend that the measurement of 6MWT prior to surgery be undertaken in future studies, as not only will it quantify improvement in this variable from pre- to post-surgery, but it may provide insights about who may perform poorly in measured mobility at entry to subacute rehabilitation programmes. Attention to the way participants of supervised and unsupervised programmes progress their exercise dose may also provide new insights into the benefits of supervised therapy.
Conclusion
Novel exploratory analysis has revealed support for the notion that rehabilitation streaming based on entry-level mobility may be an appropriate strategy for managing the high volume of TKA recipients presenting for rehabilitation. Recipients who present with lower than predicted mobility for their age, gender, weight and height, and who receive a more closely supervised physiotherapy programme, appear to recover their mobility better in the short-term than those who receive less supervision in the form of a monitored home programme.
On the basis of this analysis, which requires corroboration by a larger study with comparable sample sizes across the treatment arms, any patient who, at entry to physiotherapy rehabilitation after TKA, is unable to walk more than 40% of their 6MWT target, may benefit more through enrolment in a supervised exercise programme, while those who manage to achieve this target or better seem to be just as successful with a lower level of supervision. If this finding is supported, the clinician may have a powerful assessment tool to determine whether people might be better served through a high- or low-level of supervised therapy.
References

