Séléna Lauzière, MSc1,2, Carole Miéville, MSc1,2, Martina Betschart, MSc1,2, Cyril Duclos, PhD1,2, Rachid Aissaoui, PhD1,2,3 and Sylvie Nadeau, PhD1,2
From the 1Centre de recherche interdisciplinaire en réadaptation (CRIR), Institut de réadaptation Gingras-Lindsay de Montréal (IRGLM), 2École de réadaptation, Université de Montréal and 3Centre de Recherche du Centre Hospitalier Universitaire de Montréal (CRCHUM), Quebec, Canada
OBJECTIVE: To assess plantarflexion moment and hip joint moment after-effects following walking on a split-belt treadmill in healthy individuals and individuals post-stroke.
DESIGN: Cross-sectional study.
SUBJECTS: Ten healthy individuals (mean age 57.6 years (standard deviation; SD 17.2)) and twenty individuals post-stroke (mean age 49.3 years (SD 13.2)).
METHODS: Participants walked on an instrumented split-belt treadmill under 3 gait periods: i) baseline (tied-belt); ii) adaptation (split-belt); and iii) post-adaptation (tied-belt). Participants post-stroke performed the protocol with the paretic and nonparetic leg on the faster belt when belts were split. Kinematic data were recorded with the Optotrak system and ground reaction forces were collected via the instrumented split-belt treadmill.
RESULTS: In both groups, the fast plantarflexion moment was reduced and the slow plantarflexion moment was increased from mid-stance to toe-off in the post-adaptation period. Significant relationships were found between the plantarflexion moment and contralateral step length.
CONCLUSION: Split-belt treadmills could be useful for restoring step length symmetry in individuals post-stroke who present with a longer paretic step length because the use of this type of intervention increases paretic plantarflexion moments. This intervention might be less recommended for individuals post-stroke with a shorter paretic step length because it reduces the paretic plantarflexion moment.
Key words: stroke; locomotor activity; kinetics.
J Rehabil Med 2014; 46: 00–00
Correspondence address: Sylvie Nadeau, PhD, PT, School of Rehabilitation, Faculty of Medicine, Université de Montréal, P.O. Box 6128, Station Centre-ville, Montreal, QC, Canada H3C 3J7. E-mail: Sylvie.nadeau@umontreal.ca
Accepted Apr 8, 2014; Epub ahead of print Jul 30, 2014

*Preliminary data were presented at the Progress in Motor Control IX congress (Montreal, July 2013, Canada).
INTRODUCTION
Step length asymmetry is common in individuals post-stroke. Studies have reported that 33% to 49% of individuals post-stroke present this problem during gait (1–3). People living with the consequences of stroke are preoccupied by this asymmetry and want to improve the appearance of their gait (4, 5). Evidence suggests that asymmetrical gait might be related to slow gait speed (6) and lead to the overuse of the nonparetic limb. Therefore, rehabilitation experts dedicate a significant portion of their time towards the development of interventions that will help restore a symmetrical gait pattern. Unfortunately, asymmetrical gait has been very resistant to standard interventions. Recently, the use of split-belt treadmill during walking have started to reveal a new avenue for restoring symmetry and showing reorganization of the locomotor pattern when using asymmetrical belt speed (7, 8). When both belts return to the same speed after a period of adaptation with different belt speeds, a longer step length is observed on the side that used a faster belt speed compared to the contralateral leg. This adaptation results in asymmetrical step length in healthy controls and reduced step length asymmetry in individuals post-stroke, with the shorter step being on the fast belt. One study suggested that this protocol could have the potential to reduce step length asymmetry in individuals post-stroke with training and repetition (9).
Recently, a study revealed an important role of plantarflexion and hip flexion moment impulses in explaining step length asymmetry (10). Indeed, in this study, the authors presented an analysis of ankle plantarflexion, hip flexion and knee extension moment impulses among subgroups of participants stratified according to step length asymmetry. All subgroups presented a decrease in the paretic ankle plantarflexion moment impulse at the late single-leg stance and pre-swing phases, regardless of their step length asymmetry pattern. Participants with the shorter nonparetic step length had a greater paretic plantarflexion moment impulse reduction combined with an increase in the nonparetic plantarflexion moment impulse. It seems that reduction of the paretic plantarflexion moment at the late single-leg stance of the gait cycle restricts the forward progression of the trunk while the contralateral leg was in swing, resulting in a shorter nonparetic step. Conversely, the greater nonparetic plantarflexion moment impulse at late single-leg stance increases the paretic step length. The subgroup with symmetrical step length compensated for the reduced paretic plantarflexion moment impulse by increasing the hip flexion moment impulse bilaterally. Others with a shorter paretic step length did not compensate for the reduced paretic plantarflexor moment impulse at pre-swing (10). For this subgroup, it is possible that paretic hip flexors were not able to compensate for the weak push-off (11). Other authors showed that hip extensors were also important in the control of step length in healthy individuals (12–13). Consequently, analyzing joint moments following gait sessions on a split belt-treadmill might help to explain the reduction of step length asymmetry and confirm whether this approach could be used to train paretic lower limb muscles.
Therefore, the aim of the present study was to characterize the after-effects on ankle plantarflexion moments and hip extension and flexion moments following walking on a split-belt treadmill in healthy individuals and individuals post-stroke. A second objective was to examine the relationship between step length and plantarflexion moment after-effects. It was hypothesized that following walking on the split-belt treadmill, after-effects will be present in ankle plantarflexion moment and hip extension and flexion moments bilaterally. We also hypothesized that a strong relationship will be found between changes in ankle plantarflexion moment and changes in step length.
METHODS
Participants
Ten healthy individuals (mean age 57.6 years (standard deviation; SD 17.2)) and 20 individuals post-stroke (mean age 49.3 years (SD 13.2)) participated in this study. The inclusion criteria for healthy individuals were: having no orthopaedic, cardiac or neurological conditions and having no pain that could interfere with gait. The inclusion criteria for individuals post-stroke were: a post-stroke time of more than 6 months, unilateral paresis, capable of walking independently 10 m without technical aids and no severe cognitive or cardiovascular impairments that could affect walking. Participants were excluded if they had other neurological conditions or had suffered more than one stroke. All participants provided written informed consent for their participation and the ethics committee of the Centre de recherche interdisciplinaire en réadaptation du Montréal métropolitain approved the experiment.
Clinical evaluation
Participants answered a general health questionnaire. A clinical examination of sensation in the lower limbs was performed using Calibrated Semmes-Weinstein monofilaments for touch-pressure sensation (14), ‘up or down’ perception of passive segment displacement of the foot and the hallux to assess proprioception and a 128-Hz tuning fork for vibration sensation (15). Balance was evaluated with the Berg Balance Scale (16) and the comfortable and fast over ground walking speeds were assessed with the 10-Meter Walk Test (17). To determine lower limb dominance, participants were asked which foot they would use to kick a ball. All healthy participants presented right side leg dominance. For the participants post-stroke, in addition to these previous assessments, functional mobility was assessed using the Timed Up and Go (TUG) test (18). Motor recovery was evaluated using the Chedoke McMaster Stroke Assessment (19). The Ashworth Scale (20) was used to study spasticity.
Instrumentation and data collection
Kinematic data was assessed with an Optotrak Certus® Motion Capture System (NDI) that recorded (at 30 Hz) the 3D coordinates of 75 infrared markers placed on the head, trunk, pelvis, and upper and lower limbs. To determine the segments and anatomical axes, 40 anatomical landmarks were also manually digitized with a 4-marker probe. Kinetic data were recorded at a 600 Hz frequency with embedded force plates in a Bertec’s Fully Instrumented Treadmill (Bertec Corp. USA). This split-belt treadmill had two independent running belts (each measuring approximately 1.75 m long by 0.5 m wide). Each belt measured independently the 3 force and moment load components (Fx, Fy, Fz and Mx, My, Mz).
Experimental paradigm
After instrumentation, participants were asked to walk on the treadmill to become familiar with the split-belt treadmill. This 10-min familiarization period allowed participants to determine a self-selected treadmill gait speed. To determine the speed, we asked the participant to ‘‘walk at a comfortable pace’’. The speed of the treadmill was incrementally increased by 0.1 m/s or decreased by 0.05 m/s until the participant felt comfortable (21).
Healthy participants walked under various conditions as shown in Fig. 1. The protocol for the present study was similar to those used in previous studies with split-belt treadmill (22) and included 3 walking periods: baseline, adaptation and post-adaptation. During the baseline period, healthy participants walked with the speed of the belts set 30% slower than their comfortable speed for 3 min (tied-belt). This gait speed was chosen to match the comfortable walking speed of the individuals post-stroke (23–24). During the adaptation period the belt under the dominant side (right side) was set at twice the speed of the belt under the nondominant side (left side) for 6 min (split-belt). Lastly, during the post-adaptation period, both belts were set at the baseline speed (tied-belt). Participants post-stroke walked at their comfortable treadmill gait speed during the baseline period. Comfortable speed was chosen because greater after-effects have previously been observed at this speed (22). For the participants post-stroke, the protocol was performed twice to allow both the paretic and nonparetic side to be on the fast belt. In the present study, the nonparetic fast condition corresponded to the protocol with the nonparetic leg on the fast belt during the adaptation period; the paretic fast condition corresponded to the protocol with the paretic leg on the fast belt during the adaptation period. A 3-min wash-out period and a rest period were allowed between conditions. Participants rested until they were no longer fatigued. A harness was used during all gait periods on the treadmill for safety reasons; however, it did not provide any weight support. Two handrails placed at arm height could be used to restore balance when required. During the experiment, participants were asked to look straight ahead and not to touch the handrails unless if they experienced loss of balance.
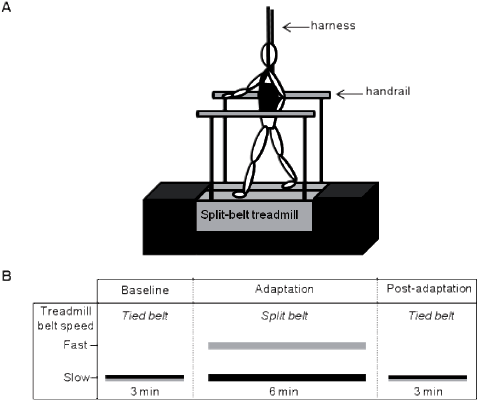
Fig. 1. A. Participants and treadmill set-up. A platform was built around the split-belt treadmill to avoid the apprehensiveness of the participants considering the height of the split-belt treadmill (not illustrated in the figure). B. Experimental paradigm. For healthy participants, the slow belt speed was set 30% slower than the comfortable treadmill walking speed and the fast belt speed (dominant side) was set at twice the speed of the slow belt (adaptation period). For participants post-stroke, slow belt speed corresponded to the comfortable treadmill gait speed and the fast belt speed (adaptation period) was set at twice the speed of the slow belt. Participants post-stroke performed this protocol twice to allow the paretic and nonparetic legs to be on the fast belt.
Data analyses
Kinematic data were filtered with a fourth order Butterworth zero-lag filter with a cut-off frequency of 6 Hz and resampled at 60 Hz. The force data were filtered with a fourth order Butterworth zero-lag filter with a cut-off frequency of 10 Hz and resampled at 60 Hz to match the kinematic data. An inverse dynamic approach was used to estimate the net joint moments. Kinematic and kinetic data were collected for 30 s at each recording period. At baseline, the recording period began at 90 s. Two periods of recording were done during the adaptation period. The early adaptation period began at the beginning of the task (0 s) and the late adaptation period began at 330 s. Gait cycles were determined by using the vertical ground reaction forces. The Teager-Kaiser energy operator method was used to determine gait cycles, which were then normalized to 100% (25).
Step length was defined as the anterior-posterior distance between the trailing heel and the leading heel at the leading heel strike. Right step length corresponded to the step length measured at the right heel strike. Net moments were normalized to body mass and averaged for 5 consecutive gait cycles. Out of these profiles, ankle plantarflexion peak values and hip extension and flexion peak values were identified for statistical analysis. To quantify symmetry, step length and moment ratios were calculated (right/left or nonparetic/paretic for healthy and individuals post-stroke, respectively). A ratio of 1 corresponded to perfect symmetry. For step length and joint moments, percentage change in asymmetry between the baseline period and the post-adaptation period was quantified with the following equation: (post adaptation value – baseline value)/baseline value) × 100.
Statistical analyses
The normal distribution of the variables and equality of variance (step length symmetry ratio, net joint moment peak values, and symmetry ratio for net joint moment peak values) were assessed using the Kolmogorov-Smirnov test and the Levene’s test, respectively. To assess the after-effect following walking on the split-belt treadmill in healthy individuals and individuals post-stroke on the step length and net joint moment symmetry ratios, a repeated measures analysis of variance (ANOVA) was used with a between-subjects factor of group (healthy and participants post-stroke) and a within-subjects (repeated measures) factor of period (baseline and post-adaptation) for the condition with the right foot (healthy participants) or nonparetic foot (participants post-stroke) on the fast belt during the adaptation period. To compare the after-effect obtained after walking on the fast belt with the paretic or nonparetic limb in individuals post-stroke, a two-way repeated measures ANOVA was used, with conditions (nonparetic fast and paretic fast) and periods (baseline and post-adaptation) as repeated factors. When the interaction was significant, paired t-tests were used to assess the differences between gait periods in each group. Pearson correlation coefficients were used to assess the relationship between changes in step length and ankle plantarflexion moments, expressed as a percentage. All statistics were performed using SPSS version 20 software with the level of significance set at 0.05, except for those corrected for the number of comparisons.
RESULTS
Participants’ characteristics
The mean and standard deviation (SD) for age, height and body mass of healthy participants were 57.6 years (SD 17.2), 1.7 m (SD 0.1), and 70.7 kg (SD 14.6), respectively. Healthy individuals scored in the normal range for all sensory assessments (13, 23, 26–28) and all scored 56/56 on the Berg Balance Scale. Their mean comfortable and baseline gait speeds on the treadmill were 1.26 m/s (SD 0.15) and 0.88 m/s (SD 0.1). Table I presents the characteristics of participants post-stroke. The mean age, height and body mass were 49.3 years (SD 13.2), 1.71 m (SD 0.07), and 79.5 kg (SD 15.2). No significant differences were found between groups concerning age, body mass and height (p ≥ 0.16).
|
Table I. Characteristics of participants post-stroke |
|||||||
|
Participant |
Age (years) |
Paretic side |
Treadmill SSGS (m/s) |
Chedoke foot/leg (/7) |
Ashworth Scale Ankle (/4) |
Berg (/56) |
Ankle sensationa |
|
P1 |
69 |
L |
0.4 |
4/3 |
1 |
44 |
5.18 |
|
P2 |
66 |
L |
0.4 |
3/3 |
1 |
52 |
4.31 |
|
P3 |
60 |
R |
0.45 |
1/6 |
1 |
55 |
4.17 |
|
P4 |
54 |
L |
0.53 |
5/6 |
1 |
49 |
4.17 |
|
P5 |
38 |
L |
0.55 |
5/6 |
1 |
56 |
5.18 |
|
P6 |
66 |
L |
0.55 |
5/6 |
0 |
52 |
5.18 |
|
P7 |
50 |
L |
0.55 |
5/6 |
1 |
55 |
4.31 |
|
P8 |
36 |
R |
0.6 |
3/5 |
1 |
55 |
4.17 |
|
P9 |
41 |
L |
0.6 |
3/3 |
0 |
55 |
Anesthesia |
|
P10 |
63 |
L |
0.6 |
4/6 |
1 |
52 |
4.31 |
|
P11 |
39 |
L |
0.6 |
4/5 |
2 |
56 |
4.17 |
|
P12 |
44 |
L |
0.6 |
2/5 |
3 |
56 |
5.18 |
|
P13 |
52 |
R |
0.65 |
5/6 |
1 |
56 |
4.31 |
|
P14 |
65 |
R |
0.65 |
5/6 |
1 |
52 |
4.31 |
|
P15 |
37 |
L |
0.7 |
5/6 |
0 |
56 |
5.18 |
|
P16 |
29 |
R |
0.7 |
7/7 |
0 |
56 |
4.17 |
|
P17 |
46 |
L |
0.8 |
7/7 |
0 |
56 |
4.31 |
|
P18 |
24 |
L |
0.85 |
5/5 |
3 |
56 |
5.18 |
|
P19 |
55 |
R |
0.85 |
4/4 |
0 |
56 |
4.31 |
|
P20 |
53 |
L |
0.9 |
5/3 |
0 |
56 |
4.17 |
|
Mean |
49.3 |
0.63 |
4.3/5.3 |
0.9 |
54 |
||
|
SD |
13.2 |
0.14 |
1.5/1.2 |
0.9 |
3.1 |
||
|
aCutaneous sensation was assessed at the lateral malleolus of the paretic ankle using Semmes-Weinstein monofilaments; ≤ 4.17 = normal, ≥ 4.31 to ≤ 5.18 = hypoesthesia; > 5.18 to ≤ 6.65 = severe deficit; > 6.65 = anesthesia. SSGS: Self-selected gait speed; SD: standard deviation; R: right; L: left. |
|||||||
Step length after-effects
For the comparison between healthy and stroke nonparetic fast conditions, the ANOVA showed a significant interaction between the groups and periods (p < 0.001). For the comparison between the stroke nonparetic fast and the stroke paretic fast conditions, a significant interaction was also revealed between the two factors (periods vs conditions; p < 0.001). Post-hoc testing in each group showed significant differences between the ratio at baseline and at post-adaptation with respect to step length symmetry values, i.e., 1.02 (SD 0.06) and 1.57 (SD 0.26) for healthy individuals (p < 0.001; Fig. 2A); 0.96 (SD 0.14) and 1.18 (SD 0.20) for the stroke nonparetic fast condition (p = 0.003; Fig. 2B), and 1.01 (SD 0.16) and 0.77 (SD 0.17) (p < 0.001) (Fig. 2C) for the stroke paretic fast condition. Also, significant differences were found between early and late adaptation periods in healthy and in stroke nonparetic fast condition (p ≤ 0.001). There was also a trend for significance (p = 0.04) for the stroke paretic fast condition.
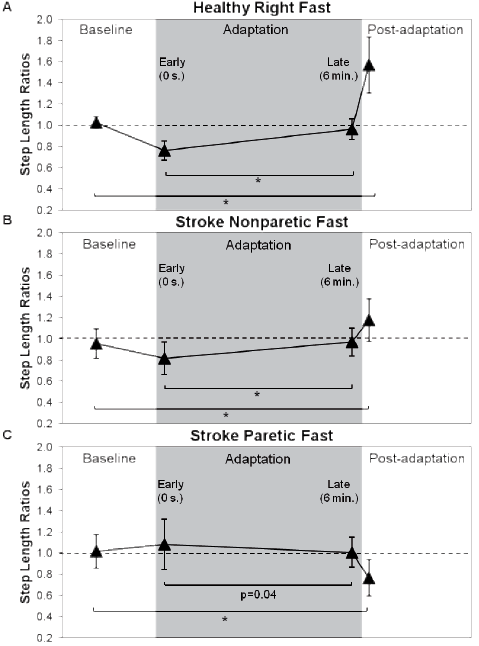
Fig. 2. Step length symmetry for baseline, early adaptation, late adaptation, and post-adaptation periods. Each triangle represents a mean of 5 consecutive strides. Asymmetry was expressed as a ratio of the right (nonparetic) side value divided by left (paretic) side value. The horizontal dotted lines represent perfect symmetry. (A) Step length ratios for healthy individuals. (B) Stroke step length ratios during the nonparetic fast condition and (C) during the paretic fast condition. *Symmetry ratios were significantly different between baseline and post-adaptation periods and between early adaptation and late adaptation; p < 0.013.
Joint net moment after-effects
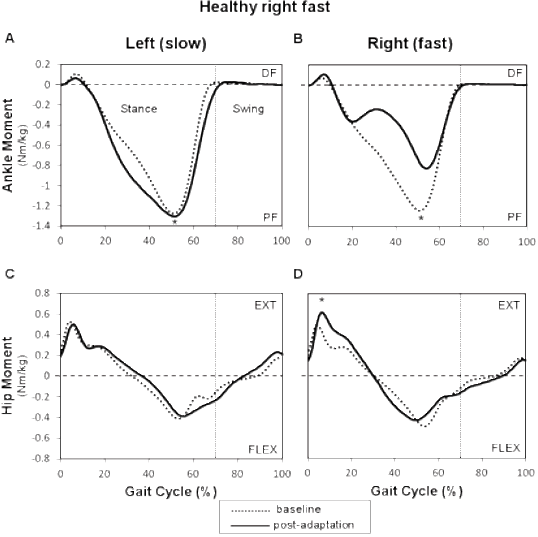
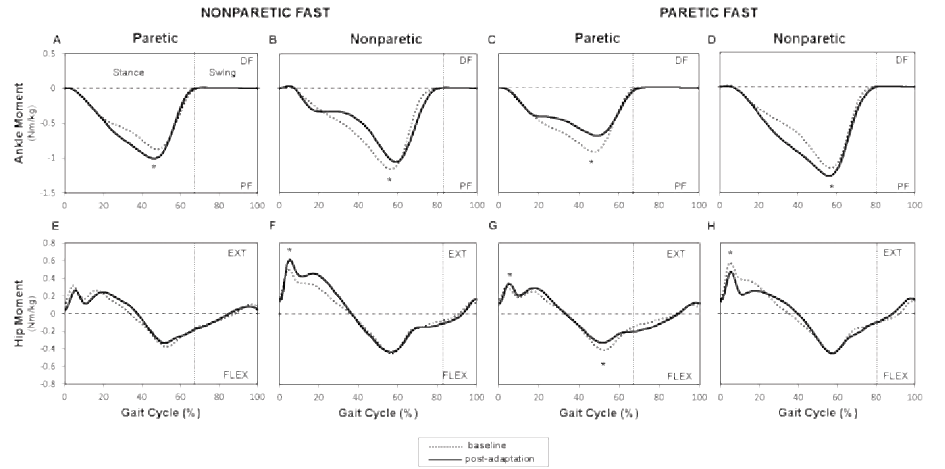
Healthy and individuals post-stroke demonstrated the same behavior for plantarflexion moments for the foot that was on the slow belt during the adaptation period (left or paretic) with a significant effect with respect to periods (p = 0.005). In the post-adaptation period, the mean profile of the slow ankle showed an increased plantarflexion moment from 20 to 55% of the gait cycle with the peak value showing an increase of 4.1% for healthy individuals (Fig. 3A) and an increase of 16.5% for individuals post-stroke compared to baseline (Fig. 4A). For the plantarflexion moment of the foot that was on the fast belt (right or nonparetic), a significant interaction was found between groups and periods. In healthy individuals, the right (fast) mean plantarflexion ankle moment profile decreased by 29.1% compared to baseline from 20 and 60% of the gait cycle (p < 0.001; Fig. 3B). In individuals post-stroke, a reduction of 8.1% was also observed (20 to 60% of the gait cycle) during the post-adaptation period (p = 0.01; Fig. 4B). At the hip, healthy and individuals post-stroke presented the same behavior for bilateral hip extension and hip flexion moments. A significant effect of periods was found for the fast hip extensor (p < 0.001). More precisely, in healthy individuals, an increase was found between 10 and 25% of the gait cycle with peak values being 32.4% higher in the post-adaptation period compared to baseline (Fig. 3D). For individuals post-stroke, the peak nonparetic (fast) hip extension moment increased by 17.1% during the post-adaptation period (Fig. 4F). No significant effects were found for bilateral hip flexion moments and slow hip extension moment.
For the comparison between stroke nonparetic fast and paretic fast conditions, the two-way ANOVA showed significant interactions (periods × conditions) for bilateral plantarflexion moments, bilateral hip extension moments, and paretic hip flexion moment (p ≤ 0.01). At the ankle, post-hoc testing revealed a decrease in the paretic (fast) plantarflexion moment (peak value: mean change of 19%; p < 0.001; Fig. 4C) and an increase with the nonparetic (slow) belt (peak value: mean change of 9.4%; p = 0.001; Fig. 4D). At the hip, the peak value for the paretic (fast) hip extension moment increased by 16.1% (p < 0.001), while the nonparetic (slow) peak hip extension moment decreased by 16.7% (p < 0.001; Fig. 4H). The peak value for the paretic (fast) hip flexion moment decreased by 14.4 % (p < 0.001; Fig. 4G).
Net joint moment symmetry ratios
Healthy participants and individuals post-stroke showed the same behavior for the plantarflexor symmetry ratios with a significant effect of periods (p = 0.001). For healthy individuals, peak plantarflexion moment symmetry ratios (right/left or nonparetic/paretic) were 0.98 (SD 0.07) and 0.66 (SD 0.15) at baseline and post adaptation, respectively (Fig. 5A). For stroke individuals, corresponding values were 1.38 (SD 0.28) at baseline and 1.10 (SD 0.23) at post-adaptation, respectively (Fig. 5B).
At the hip, healthy and individuals post-stroke also showed the same behavior. For hip extensors, a significant effect of periods was found (p = 0.005). Symmetry ratios for peak hip extensor moments were 0.92 (SD 0.13) and 1.28 (SD 0.27), respectively, for baseline and post-adaptation periods in healthy individuals (Fig. 5D), whereas for individuals post-stroke, the symmetry ratio for peak hip extensor moments was 1.65 (SD 0.60) at baseline compared to 2.24 (SD 1.11) at post adaptation (Fig. 5E). No significant effect of periods was found for the peak flexion moment ratio (not illustrated).
For the comparison between stroke nonparetic fast and paretic fast conditions, the two-way ANOVA depicted a significant interaction (periods × conditions) for plantarflexor (p < 0.001), hip extensor symmetry ratios (p < 0.001), and hip flexor symmetry ratios (p = 0.008). In the fast paretic condition, an increase in plantarflexion moment asymmetry in the post-adaptation period was found compared to baseline (from 1.30 (SD 0.27) to 1.83 (SD 0.52); p < 0.001; Fig. 5C). Asymmetry of the peak hip extension moment decreased from 1.69 (SD 0.58) at baseline to 1.20 (SD 0.40) at post-adaptation (p < 0.001; Fig. 5F). Asymmetry of the peak hip flexion moment increased from 1.07 (SD 0.46) to 1.37 (SD 0.57) (p = 0.001; not illustrated).
Relationship between changes in step length and plantarflexion moment
In healthy individuals, changes in step length and peak plantarflexion moment ratios (expressed as a percentage) between baseline and post adaptation were negatively correlated (r = –0.86; p <0.001; Fig. 6A). Moreover, the change in the step length of the left (slow) leg was highly correlated with the change in the right (fast) plantarflexion moment (r = 0.88; p < 0.001; Fig. 6B).
During the nonparetic fast condition, the change in the nonparetic (fast) step length for individuals post-stroke was correlated with the change in the paretic (slow) plantarflexion moment (r = 0.559; p < 0.01; Fig. 6C). During the paretic fast condition, the change in the paretic (fast) step length was moderately correlated with the change in the nonparetic (slow) plantarflexion moment (r = 0.535; p = 0.015; Fig. 6B).
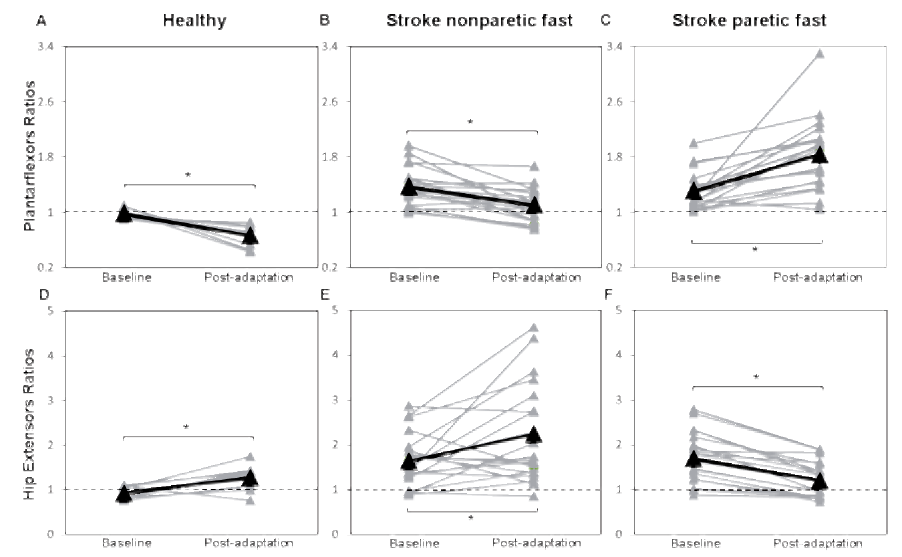
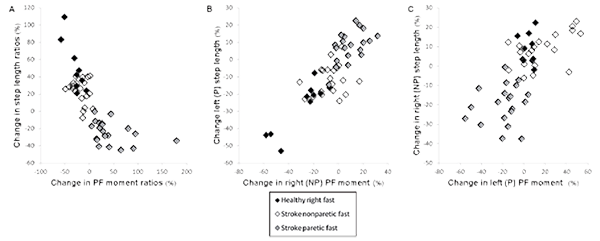
Fig. 6. A) Scatterplots showing the relationship between the percentage of change in step length ratios and peak plantarflexion moment ratios for healthy individuals, individuals post-stroke during the nonparetic fast condition, and individuals post-stroke during the paretic fast condition. B) Association between percentages of change in left (paretic) step length and right (nonparetic) peak plantarflexion moment. C) Association between percentages of change in right (nonparetic) step length and left (paretic) peak plantarflexion moment. SL: step length; PF: plantarflexors; P: paretic; NP: nonparetic.
DISCUSSION
The main objective of this study was to determine the kinetic after-effects that could explain step length after-effects following walking on a split-belt treadmill in healthy and individuals post-stroke. The most significant findings were the after-effects observed in the plantarflexion moment from mid-stance to initial swing (from 20 to 60% of the gait cycle) and the high correlation between changes in step length and peak plantarflexion moments in both groups.
Step length after-effects
The split-belt protocol resulted in similar step length adaptation and after-effects as those obtained in previous studies (7, 29). Thus, in the post-adaptation period, the step length of the leg that was on the fast belt during the adaptation period increased and the step length of the leg that was on the slow belt decreased compared to baseline, resulting in asymmetrical step lengths in healthy participants. The majority of individuals post-stroke (18/20) responded similarly to healthy when the nonparetic side was on the fast belt, except that the amplitude of the response was reduced. Compared to healthy individuals who presented symmetrical step length during the baseline period, some post-stroke participants presented a longer paretic step (8), while others presented a longer nonparetic step (6). In the former case (longer paretic step), the asymmetry was reduced after walking with the nonparetic side on the fast belt and was increased after walking with the paretic side on the fast belt. In the latter case (longer nonparetic step), baseline asymmetry decreased after walking with the paretic side on the fast belt and increased after walking with the nonparetic side on the fast belt.
Kinetic after-effects
Analyses of joint moments provide a better understanding of the biomechanical strategy that controls step length after-effect than kinematic information alone. In this study, healthy and individuals post-stroke exhibited the same behavior for ankle plantarflexion moments and hip extension moments. In individuals post-stroke, the kinetic after-effects were the same, regardless of the leg (paretic or nonparetic) that was on the fast belt during the adaptation period. Thus, during the post-adaptation period, the plantarflexion moment of the fast leg decreased, the plantarflexion moment of the slow leg increased and the hip extension moment of the fast leg increased compared to baseline. The increased hip extension moment of the fast leg at the beginning of the stance phase cannot explain the increase in ipsilateral step length. However, the plantarflexion moment of the slow leg from mid-stance to toe-off might contributes to this increase. In fact, the increased plantarflexion moment contributes to the forward progression of the trunk when the opposite leg is in swing, thus increasing step length (30, 31). By contrast, the considerable reduction in the plantarflexion moment of the fast leg from mid-stance to toe-off reduces the progression of the trunk during the swing phase of the slow leg, which contributes to the decrease in step length of the slow leg.
The increased hip extension moment observed on the fast side could be a reaction to the increase in propulsion by the slow plantarflexor muscles. Indeed, during gait, the propulsive force is mostly caused by the plantarflexor muscles at push-off (31, 32) and must be balanced by the braking force, which is partially caused by hip extensor muscles of the contralateral leg upon subsequent heel strike (33). The reduction of the paretic hip flexion moment during the paretic fast condition in individuals post-stroke could be the result of fatigue. This idea is supported by the fact that healthy individuals did not present this after-effect and that the nonparetic hip flexion moment did not decrease in the nonparetic fast session.
Relationship between step length and plantarflexion moment
Both groups showed a significant relationship between the change in step length and the change in contralateral plantarflexion moment. These relationships support the role of the plantarflexion moment as a major contributor of the contralateral step length. However, other factors could explain change in step length asymmetry. First of all, the role of plantarflexor muscles is not exclusive to the forward progression of the trunk (34). Previous research has shown that the energy produced by the gastrocnemius from late single-leg stance through pre-swing is delivered to the leg, whereas the soleus transfers its energy to the trunk (33). Therefore, the increase in the plantarflexion moment could also contribute to the increase of the ipsilateral step length. Other muscles, such as the hip flexors (10) or knee extensor muscles (31), could also influence step length.
Clinical implications
Previous studies found that step length asymmetry in individuals post-stroke can be reduced when the leg with the shorter step length is placed on the fast belt (7, 9). Our results suggest that split-belt treadmill training could be useful for restoring step length symmetry in individuals post-stroke who have a longer paretic step length because it punctually increases the paretic plantarflexion moment during stance. The increase of plantarflexion moment observed on the paretic side is clinically relevant because this parameter is often reduced in individuals post-stroke during gait and has been suggested as a cause of slow gait speed (11, 35) and step length asymmetry (10, 30). Out of the 20 participants post-stroke analysed in this study, 17 presented a reduced paretic plantarflexion moment compared to the nonparetic side at baseline. Immediately after the adaptation period, the paretic plantarflexion moment increased by 16.5%. For individuals post-stroke with a shorter paretic step, this intervention might be less recommended because it reduces the paretic plantarflexion moment. Therefore, this intervention temporarily increases asymmetry of the plantarflexion moment. From a clinical perspective, it might not be a good strategy for restoring step length symmetry during gait because this could lead to substantial overuse of the nonparetic side and reduced utilization of the paretic side. Allen et al. (10) suggested that an intervention that increases the paretic hip flexion moment at pre-swing could be a relevant approach for improving shorter paretic step length. This result was not observed when the paretic shorter step length was on the fast belt since the hip flexion moment on the paretic side was found to be reduced in post-adaptation.
Study limitations
Individuals post-stroke held the handrail during the adaptation period for safety purposes. This prevented the researchers from analyzing the joint moment during this period since forces on the handrail were not controlled. Therefore, this could limit the interpretation of the joint moment after-effects in the post-adaptation period. Future analyses on the adaptation period will be necessary to better understand the change in ankle and hip joint moments. Also, data analyses did not include the dorsiflexion moment, knee joint moment, or joint powers, which might contribute to step length adaptation.
Conclusion
The increase in the plantarflexion moment on the paretic side following the adaptation period with the nonparetic side on the fast belt is particularly interesting because stroke individuals often show a reduced paretic plantarflexion moment during gait. Future studies are needed to assess the long-term effect of this protocol and to determine if it could be used as an efficient training method for increasing the paretic plantarflexion moment during gait in stroke individuals.
Acknowledgements
Séléna Lauzière is supported by a Vanier Canada Graduate PhD scholarship from the Canadian Institutes of Health Research (CIHR). Carole Miéville is supported by PhD scholarships from the Fonds de recherche du Québec–Santé (FRQS) and the SensoriMotor Rehabilitation Research Team (SMRRT). Martina Betschart receives funding through a PhD scholarship from the SMRRT. This project was funded by the Ordre professionnel de la physiothérapie du Québec (OPPQ) and the Réseau provincial de recherche en adaptation-réadaptation (REPAR). The equipment and material required for the research conducted at the Pathokinesiology Laboratory was financed by the Canada Foundation for Innovation (CFI). We wish to thank Philippe Gourdou, Michel Goyette, Youssef El Khamlichi and Daniel Marineau for their technical support.
The authors declare no conflict of interest.
REFERENCES

