Ida Løchting, MSc1,2, Margreth Grotle, PT, PhD1,3, Kjersti Storheim, PT, PhD1,4, Erik L. Werner, MD, PhD5 and Andrew M. Garratt, PhD6
From the 1Communication and Research Unit for Musculoskeletal Disorders (FORMI), Oslo University Hospital, Ullevaal, 2Department of Clinical Medicine and 4Department of Health Sciences, University of Oslo, 3Faculty of Health Science, Oslo University college, Oslo, 5Research Unit for General Practice, Uni Research, Uni Health, Bergen and 6Norwegian Knowledge Centre for the Health Services, Oslo, Norway
OBJECTIVE: To evaluate the reliability and validity of the improved version of the Patient Generated Index (PGI) in patients with low back pain.
METHODS: The PGI was administered to 90 patients attending care in 1 of 6 institutions in Norway and evaluated for reliability and validity. The questionnaire was given out to 61 patients for re-test purposes.
RESULTS: The PGI was completed correctly by 80 (88.9%) patients and, of the 61 patients responding to the re-test, 50 (82.0%) completed both surveys correctly. PGI scores were approximately normally distributed, with a median of 40 (range 80), where 100 is the best possible quality of life. There were no floor or ceiling effects. The 5 most frequently listed areas affecting quality of life were pain, sleep, stiffness, socializing and housework. The test-retest intraclass correlation coefficient was 0.73. The smallest detectable changes for individual and group purposes were 32.8 and 4.6, respectively. The correlations between PGI scores and other instrument scores followed a priori hypotheses of low to moderate correlations.
Discussion: The PGI has evidence for reliability and validity in Norwegian patients with low back pain at the group level and may be considered for application in intervention studies when a comprehensive evaluation of quality of life is important. However, the smallest detectable change, of approximately 30 points, may be considered too large for individual purposes in clinical applications.
Key words: quality of life; low back pain; reliability; validity.
J Rehabil Med 2014; 46: 781–787
Correspondence address: Ida Løchting, Communication and Research Unit for Musculoskeletal Disorders (FORMI), Oslo University Hospital, Ullevaal. PO Box 4950 Nydalen, NO-0424 Oslo Norway. E-mail: ida.lochting@ous-hf.no
Accepted Feb 25, 2014; Epub ahead of print Aug 13, 2014
Introduction
Quality of life is widely recognized as an important outcome by patients, clinicians and researchers (1), and there has been considerable growth in the availability and application of instruments designed to measure health status and quality of life from the patient perspective (2, 3). However, relatively few instruments are available that assess quality of life relating to the impact of illness and dysfunction on the individual person or what are referred to as individualized quality of life instruments (2, 4). Outcomes that are important to patients are not routinely measured (5, 6) and the inclusion of individual instruments when evaluating health interventions has been recommended (7).
Whilst there is no universal definition of the term “quality of life” (8) there is broad agreement that it is individual and multidimensional (8). Standardized instruments have fixed domains and items and are often developed without patient involvement and hence may not cover areas of quality of life that are important to the patient. As a consequence they may have reduced content validity (4, 9). Individualized quality of life instruments have the advantage that the patient specifies areas of life that are important to them, which increase relevance and content validity (4). Used alongside standardized health status instruments, individualized instruments give a more complete assessment of quality of life. A recent study that included a review of patients’ perspective of recovery from low back pain (LBP) found that recovery is a highly individual, multidimensional and that domains such as fatigue, sleep, social function and emotional well-being are more important to patients’ than recognized in the literature (5). This study recommended the Patient Generated Index (PGI) for evaluating recovery from non-specific LBP alongside the existing core set of LBP outcome measures (5).
The individualized approach to quality of life, as assessed by the PGI, may have more relevance to clinical decision-making and assessment than standardized patient-reported outcomes (PROs), which are usually based on the concerns of groups of patients and aspects of quality of life that they are assumed to share (4). Individualized approaches also offer an opportunity to evaluate concepts such as adjustment and response shift, which may be of pertinence in a rehabilitation context (10).
The PGI was developed in the UK in the early 1990s for different illness groups including LBP (11). It is based on the definition that quality of life is “the extent to which hopes and ambitions are matched by experience”, which has had previous application in health-related research (12, 13). The PGI allows the patient to include areas of their life affected by their health problem that are important to them, together with a rating and importance weighting of these areas. The PGI has been evaluated and used in applications in several countries. However, the PGI has not been evaluated in patients with LBP since its development in the 1990s and it has not been evaluated in patients with LBP in Norway. Following a review of its psychometric properties it was concluded that the instrument has acceptable levels of reliability and had evidence for validity across different studies (14) and more recent versions of the PGI have been developed to improve acceptability and completion rates (14, 15). The PGI used in the current study is the latest available version, which is based on findings from previous studies including patient interviews to assess acceptability (16, 17), has an improved design and shorter scale in stage 2 and fewer points to distribute in stage 3. The study objective was to evaluate the reliability and validity of the latest version of the PGI in patients with LBP.
Methods
Design
The PGI was administered by means of a self-completed questionnaire to 90 patients with non-specific LBP receiving care in 1 of 6 treatment facilities in Oslo, Norway over one year from September 2008. These included 3 physiotherapy clinics, 1 outpatient rehabilitation clinic, 1 pain clinic and 1 orthopaedic department. Within 1 week following their inclusion at the institutions, patients were given a second PGI for the purpose of assessing test-retest reliability. The data collection procedures at the individual institutions meant that information on the total number of eligible patients asked to participate was unavailable. Data collection followed recommendations for sample sizes proposed for methodological studies including reliability and validity, suggesting that at least 50 patients are necessary to test for construct validity and test-retest reliability and agreement (18, 19).
Participants and ethics
The inclusion criteria were: patients with non-specific LBP, aged ≥18 years old and acceptable Norwegian. Exclusion criteria were sciatica or signs of “red flags” (20). The clinician asked patients fulfilling the inclusion criteria whether they would be willing to participate in the study and those agreeing gave written informed consent. The study was approved by the Norwegian Regional Committee for Medical Research Ethics and the Data Inspectorate and followed the Declaration of Helsinki.
Patient-reported outcomes
The baseline questionnaire included the PGI and other measures of health status that were used for the purposes of testing construct validity. The PGI is completed in 3 stages. In the first stage, patients are asked to list up to 5 important areas in their life affected by their LBP. The second stage asks patients to rate the extent to which their LBP has affected them in each area and in the rest of their lives on a 7-point scale, from “the worst they can imagine” to “exactly as they would like it to be”. The third stage asks patients to imagine that they can improve some or all of the areas. They have 10 points to distribute across the areas that they would most like to improve. The overall score from 0 to 100, representing the worst and best possible quality of life, respectively, is computed as follows: [Σ (area score × points spend /10)]/6 × 100 (21).
An example of the 3 stages in the completion of the PGI for patients with LBP is given in Appendix I. Following recommendations, different colours were used to separate the stages of the PGI that are intended to aid completion (17).
The PGI has been translated into Norwegian following recommended criteria (22). A trigger list of areas considered important for patients with LBP was included. The list was based on previous findings for patients with musculoskeletal disorders (11, 15, 22) and discussion in an expert panel. A closed format of the PGI was used in this study, where baseline areas are included at follow-up.
The other instruments included the EuroQol-5D (EQ-5D) (23), which is a generic utility instrument with 5 items that have 3-point descriptive scales of no problem, some problems and severe problems. The EQ-5D index is based on utility weights from the general population and is scored from –0.59 to 1.0, where 1 is the best possible score. The EQ-5D has evidence for reliability and validity in Norwegian LBP patients (24).
Disability in daily activities was assessed by the back-specific Roland Morris Disability Questionnaire (RMDQ), which has 24 yes/no items that sum to a score from 0 to 24, where 24 is the most severe disability (25). The RMDQ has evidence for reliability and validity in Norwegian LBP patients (26).
Psychological distress was assessed by the Hopkin’s Symptom Check List (HSCL-25), which comprises 25 items relating to psychological distress (27). The HSCL-25 asks about symptoms complaints during the last week and items have a 4-point scale, from “not at all” to “to a large extent”. The items sum to give a score from 0 to 4, where 4 is the most severe symptoms. The Norwegian HSCL-25 version has been used in several studies (28, 29).
Illness perceptions was assessed by The Brief Illness Perceptions Questionnaire (Brief IPQ) (30) which has 9 items comprising cognitive and emotional illness perceptions. The items have a 0–10 scale with end-point descriptors. The overall score from 0 to 10, represents the degree to which the illness is perceived as threatening or benign. Higher scores represent a more threatening view of the illness. The instrument has evidence for reliability and validity (30).
Pain catastrophizing was assessed by the 13-item Pain Catastrophizing Scale (PCS) (31), which asks about past painful experiences and the degree to which they were experienced, on a 5-point scale from “not at all” to “all the time” (31). PCS total scores range from 0 to 52, where 52 is the highest level of catastrophizing. The PCS has evidence for reliability and validity in Norwegian patients with LBP (32).
Fear avoidance was assessed by the Fear Avoidance Beliefs Questionnaire (FABQ) (33), which comprises 16 items that give 2 subscales of fear avoidance for work (FABQ-W) and fear avoidance beliefs for physical activity (FABQ-PA). The items have a 7-point scale from “completely disagree” to “completely agree”. Scale scores range from 0 to 42 for the FABQ-W and 0–24 for the FABQ-PA, where higher scores represent greater fear avoidance beliefs. The questionnaire has been evaluated in patients with LBP in Norway (34).
Finally, the questionnaire included a 10-point numeric rating scale measuring pain and questions relating to duration of LBP, age, gender and employment. The test-retest questionnaire included a health transition item asking about change in LBP since baseline with a 6-point descriptive scale from “worse” to “completely recovered”.
Statistical analysis
The COnsensus-based Standards for the selection of health Measurement INstruments (COSMIN) checklist for measurement properties of health status questionnaires informed instrument evaluation including sample size, reliability, agreement and validity (18, 35). The PGI was assessed for levels of missing data and floor/ceiling effects were considered present if more than 15% of the respondents had the highest or lowest possible score (18). The test-retest reliability of the PGI score was assessed by intraclass correlation (ICC) 2.1, which should exceed the criterion of 0.7 for use in groups of patients (18). The standard error of measurement (SEM) and the smallest detectable change (SDC) were used to assess agreement in accordance with published recommendations. SEM was calculated by taking the square root of the error variance of an analysis of variance (ANOVA) analysis. The SDCindividual is equal to 1.96 × √2 × SEM and reflects the smallest within-person change in score that with p < 0.05 can be interpreted as “real change”, above measurement error. The SDCgroup is equal to SDCindividual divided by √ n (18). Limits of agreement (Bland and Altman plot) were performed as an additional parameter of agreement (mean difference test-retest against mean test-retest scores). Limits of agreement lines were drawn at đ +/– 1.96 × SDdifference (18).
Construct validity was assessed by comparing the baseline PGI scores with those for the other instruments based on a priori hypotheses derived from a structured literature review of PGI and related variables (11, 14, 15). It was expected that PGI scores would be positively associated with physical and social functioning and psychological well-being. Moderate to high correlations were expected between the PGI scores and Numeric Rating Scale (NRS) pain and RMDQ. Moderate to high correlations were expected with EQ-5D scores, which measure general health status. Low to moderate correlations were expected with instrument scores relating to beliefs and aspects of psychological well-being, including the HSCL-25, Brief IPQ, PCS and FABQ. Given the condition-specific focus of the PGI, it was further hypothesized that correlations would be generally higher for the specific instruments with the exception of the FABQ, which assesses specific beliefs. Spearman’s rho was used for correlations because not all data were normally distributed. Correlations below 0.3, 0.3 to 0.6 and over 0.6 were considered low, moderate and high, respectively (36).
SPSS version 18 was used for statistical analysis.
Results
Participation
The study included 90 patients, the majority of whom were attending primary care (33%) or an orthopaedic hospital department (33%). Most of the patients reported having chronic LBP (78.9%); 57.8% were female and mean age was 47.6 (SD 11.8) years (Table I).
|
Table I. Patient characteristics at baseline and test-retest |
||
|
Variables |
Baseline n = 90 |
Test-retest n = 61 |
|
Recruited from, n (%) |
||
|
Primary healthcare |
30 (33.3) |
14 (23.0) |
|
Outpatient rehabilitation clinic |
24 (26.7) |
22 (36.1) |
|
Orthopaedic hospital department |
30 (33.3) |
21 (34.4) |
|
Pain clinic hospital |
6 (6.7) |
4 (6.6) |
|
Duration current episode, n (%) |
||
|
0–6 weeks |
11 (12.2) |
8 (13.1) |
|
7–12 weeks |
8 (8.9) |
3 (4.9) |
|
> 3 months |
71 (78.9) |
5 (82.0) |
|
EQ-5Da, median (range) |
0.7 (1.2) |
0.7 (1.0) |
|
RMDQb, median (range) |
7.0 (24) |
7.0 (24) |
|
HSCL-25c, median (range) |
1.5 (2.0) |
1.5 (2.0) |
|
FABQd, median (range) |
||
|
Physical activity |
9.0 (22) |
9.0 (22) |
|
Work |
15.0 (42) |
15.5 (42) |
|
Back pain (NRS)e, median (range) |
5 (8) |
5 (8) |
|
Sex, n (%) |
||
|
Male |
38 (42.2) |
29 (47.5) |
|
Female |
52 (57.8) |
32 (52.5) |
|
Age years, mean (SD) |
47.6 (11.8) |
49.2 (11.2) |
|
Employment status, n (%) |
||
|
Employed |
41 (45.6) |
25 (41.0) |
|
Not employed/sick leave |
24 (26.7) |
18 (29.5) |
|
Pension |
25 (27.8) |
18 (29.5) |
|
aEuroQuol-5D (EQ-5D) (–0.59 to 1.0). Higher score represent better health-related quality of life. bRoland Morris Disability Questionnaire (RMDQ) (0–24). Higher score represent greater overall disability. cHopkin’s Symptom Check List (HSCL-25) (1–4). Higher scores represent more severe symptoms. dFear Avoidance Beliefs Questionnaire (FABQ) physical activity (0–24). FABQ work (0–42). Higher scores represent increased levels of fear avoidance beliefs. eNumeric Rating Scale (NRS) (0–10). Higher scores represent more pain. |
||
Completion of the PGI
The PGI was correctly completed by 80 (88.9%) patients who returned a questionnaire. No statistical significant differences were found between patients with correct or incorrect completion in relation to clinical setting, duration of back pain, age, gender, and employment status. The PGI scores were approximately normally distributed with a median of 40 (range 80), where 100 is the best quality of life. There were no floor or ceiling effects.
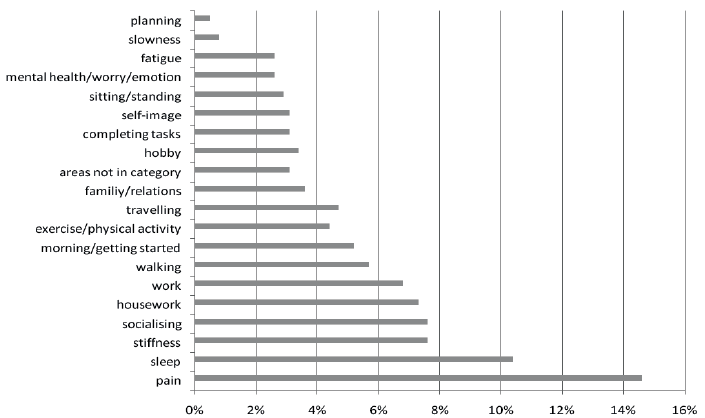
The 384 areas chosen in stage 1 of the PGI could be classified into 20 categories, of which 90% were found in the trigger list (Fig. 1). The most frequently listed areas for the 86 patients completing stage 1 of the PGI were pain (65%), sleep (47%), stiffness (34%), socializing (34%) and housework (33%).
Fig. 1. Classification of the 384 areas given in stage 1 of the Patient Generated Index (PGI) (n = 86).
Test-retest reliability
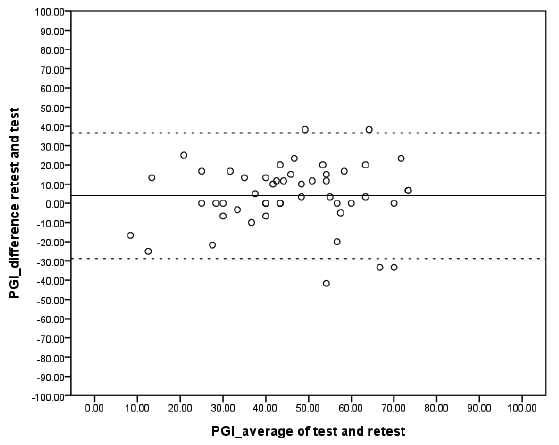
The time interval between test and return of the re-test PGI ranged from 1 to 31 days, with a median of 7 days. Of the 61 patients responding to the re-test, 50 (82.0%) completed both administrations correctly (Table II). The ICC was 0.73 (95% CI 0.52–0.84). The SEM was 11.8 and the SDCindividual and SDCgroup were 32.8 and 4.6, respectively. Similar results were found for those patients who reported “no change” at the re-test assessment (Table II). The limits of agreement are presented in Fig. 2.
|
Table II. Median (range) at baseline and re-test and agreement for all patients (n = 50), for patients reporting “no change” (n = 27) and for patients reporting a re-test period under two weeks (n = 41) |
||||||
|
Baseline Median (range) |
Re-test Median (range) |
SEMb |
SDCindividualc |
SDCgroupd |
ICCe (95% CI) |
|
|
PGI scoresa (n = 50) |
42.50 (80) |
49.17 (83.33) |
11.83 |
32.77 |
4.64 |
0.73 (0.52–0.84) |
|
PGI scores (n = 27) |
43.33 (78.33) |
46.67 (76.67) |
11.43 |
31.66 |
6.09 |
0.72 (0.40–0.87) |
|
PGI scores (n = 41) |
41.67 (68.33) |
48.33 (83.33) |
10.56 |
29.25 |
4.57 |
0.76 (0.54–0.87) |
|
aPatient Generated Index (PGI) scores 0–100: overall score of PGI. A higher score reflects better quality of life. bStandard error of measurement (SEM) agreement: √within people residual mean square. cSmallest detectable change (SDC) individual: (√within people residual mean square) × 2.77. dSDC group: (SDC individual/√n). eIntraclass correlation (ICC) agreement: 2-way random effects model (absolute agreement). CI: confidence interval; SD: standard deviation. |
||||||
Fig. 2. Limits of agreement (n = 50). The solid and the dotted lines represent the mean and the mean ± 1.96 standard deviation (SD), respectively. PGI: Patient Generated Index.
Construct validity
The results of the correlations between the PGI scores and those for the other instruments supported all the a priori hypotheses. There were moderate correlations in the range –0.39 to –0.45 between the PGI and the scores for the EQ-5D, RMDQ, NRS pain, HSCL-25 and Brief IPQ. Low correlations were found for the PCS and FABQ scores (Table III).
|
Table III. Correlation between the Patient Generated Index (PGI) and EQ-5D, RMDQ, NRS pain, HSCL-25, Brief IPQ, PCS and FABQ scores (n=80) |
|
|
PGI instrument |
Correlation coefficient |
|
EQ-5Da |
0.40* |
|
RMDQb |
–0.45* |
|
NRS painc |
–0.43* |
|
HSCL-25d |
–0.39* |
|
Brief IPQe |
–0.45* |
|
PCSf |
–0.17 |
|
FABQ Pg |
–0.20 |
|
FABQ W |
–0.23 |
|
*p < 0.001 level. aEuroQuol-5D (EQ-5D) (–0.59 to 1.0). Higher scores represent better health-related quality of life. bRoland Morris Disability Questionnaire (RMDQ) (0–24). Higher scores represent greater overall disability. cNumeric Rating Scale (NRS) (0–10). Higher scores represent more pain. dHopkin’s Symptom Check List (HSCL-25) (1–4). Higher scores represent more severe symptoms. eThe Brief Illness Perceptions Questionnaire (Brief IPQ) (0–10). Higher scores represent more threatening or benign illness perceptions. fPain Catastrophizing Scale (PCS) (0–52) Higher scores represent higher levels of catastrophizing. gFear Avoidance Beliefs Questionnaire (FABQ) physical activity (0–24), FABQ work (0–42). Higher scores represent increased levels of fear avoidance beliefs. |
|
Discussion
This study evaluated the reliability and validity of the PGI for patients with LBP and is the first to do so since the PGI was developed in the early 1990s. The PGI was recently recommended as a standardized measure of recovery from non-specific LBP (5) and the current study shows that the PGI is acceptable to this patient group.
Approximately 90% of the respondents completed the PGI correctly at baseline. This represents a considerable improvement from the first evaluation of the PGI in patients with LBP, acknowledging differences in the study design and setting of the 2 studies (11). More recently, studies evaluating the PGI in patients with rheumatic diseases with a comparable version of the PGI reported similar results (15, 22) and these results compare favourably with those for other studies (11, 37). The higher completion rates may be due to greater acceptability to patients following the use of a shorter scale in stage 2 and fewer points in stage 3. In addition, the different colours used to separate the stages may have improved completion (17).
However, the completion was still lower than for the standardized instruments. Interviews or focus groups with patients that are designed to address issues of completion may contribute to further improvements in the acceptability of the PGI. Other means of completion may be necessary to achieve similar rates to those of standardized instruments. Electronic administration offers scope for tailoring the instructions of the PGI to those of the individual patient, which may make the use of such instruments more feasible in future applications.
The ICC was acceptable and the results are similar to previous evaluations. However, a few studies using the same or comparable formats have reported ICCs above 0.8 (15, 22). It is possible that the ICC in this study was influenced by the duration between test and re-test, which ranged from 1 to 31 days with a median of 7 days. There has been some discussion relating to the most appropriate length of the period between test and re-test; however, several authors agree that approximately 2 weeks is acceptable (38). In this study, 10 patients had a test-retest period longer than 2 weeks, which may be considered too long, as some of these patients were under treatment (8). However, as Table II shows, this did not seem to influence the test-retest results.
The agreement results, including SEM and SDC, indicated that a change of above approximately 30 points at an individual level and 5 points at group level on the 0–100 scale are necessary to preclude measurement error. These findings are comparable to other PRO instruments, such as the Short Form (36) Health Survey (SF-36) in patients with LBP (39). A SDC estimate of 30 points might be considered too large for clinical application on an individual basis. We are aware of only one other study reporting SDC for the PGI (22), which found an SDCindividual of 20 in patients with rheumatic diseases, with a test-retest interval of approximately 1–2 days. Again, it is possible that the test-retest period may have influenced the results and a shorter period is recommended in future studies.
The authors of a review of the PGI concluded that construct validity has generally been reported as acceptable (14). Our results are comparable with those of other studies, including studies of patients with musculoskeletal disorders that have reported moderate levels of correlation with comparable instruments such as the EQ-5D, NRS pain and SF-36 (15, 22, 40). Slightly higher correlations were found with disease-specific instrument scores, which follows previous findings (15). The lowest correlations were with the scores for instruments measuring pain catastrophizing and fear-avoidance, which relate more generally to specific aspects of beliefs rather than health or quality of life. The evaluations of structural validity using factor analysis and modern psychometric methods are not possible for the PGI, since each patient nominates their own areas creating an individualized item pool.
Patients choose areas of importance to them, which lends the PGI content validity from the perspective of the individual patient at the time of completion. Among the 5 most important areas of life affected by LBP were pain, sleep and social life. These areas are known to be important to patients with LBP, and are included in the proposal for standardized use of back-specific outcome measures, such as the RMDQ and the Oswestry LBP Disability Index (ODI) (41). However, many of the areas mentioned by patients as important, including stiffness, work, exercise, social relations and psychological well-being, are not covered by standardized outcome measures commonly applied in LBP research. Although standardized instruments developed with patient involvement include important areas for the majority of patients, these findings lend support to the argument that individualized instruments, such as the PGI, have the advantage of capturing what is relevant to the individual patient by eliciting important additional concerns and priorities. These findings are supported by a qualitative study of recovery from LBP, which found that additional areas were identified as more important to patients than previously recognized (42). Moreover, standardized outcome measures assess outcomes across a number of scale scores. This creates difficulties for researchers and practitioners who must consider different instrument scores and their importance as measures of outcome. The PGI, through its inclusion of areas of greatest importance, as defined and rated by patients, gives a single score that circumvents this problem, and hence is simpler to use in research and clinical applications. Over 4% of patients mentioned exercise or physical activity as an important area in their lives. These areas were not part of the trigger list in this study but, because they are important to patients, they should be considered for future inclusion in the list.
There are a number of instruments available that include individualized content or weightings for areas (2). The Measure Yourself Medical Outcome Profile (MYMOP) has been adapted from the PGI and aims to assess the outcomes that the patient considers the most important by asking the patient to choose one or two symptoms and one activity that is limited because of health problem(s) (43). Parts of the MYMOP are recommended for completion as part of the clinical consultation. The SEIQOL is similar to the PGI, in that completion involves the listing of important areas and scoring them (44). However, the SEIQOL assesses overall quality of life rather than quality of life related to a specific health problem. The PGI was considered a more appropriate self-report instrument for assessing quality of life relating to specific diseases and health status, including LBP. Moreover, the PGI has been previously evaluated in patients with back pain (11, 40).
Study limitations
The lack of data available from the institutions meant that it was not possible to assess the overall response rate, which is the main weakness of the study. The clinicians were asked how many patients they had given the questionnaire; however, this information was not seen as completely reliable, as some did not have specific routines for registering all patients they considered for inclusion. Previous studies with the PGI have found acceptable overall response rates for self-completed postal questionnaires that included multiple instruments to assess health status and quality of life (11, 40). Hence, there is no reason to believe that inclusion of the PGI leads to lower overall response rates to this form of self-administered questionnaire. Another potential limitation may be that the time interval between test and re-test questionnaires was too long for some patients, although the median was 7 days, which is considered acceptable (45). Some patients were under treatment, and this limitation may have given poorer reliability estimates than those from a more appropriate design.
Conclusion
The present study shows that the PGI is appropriate for assessing individualized quality of life in patients with LBP. The PGI has evidence for acceptability, reliability and validity at the group level and should be considered for application in intervention studies alongside other measures of quality of life when a comprehensive evaluation of quality of life is important. However, the SDC of approximately 30 points may be considered too large for individual purposes in clinical applications.
ACKNOWLEDGEMENTS
This project was funded by The Research Council of Norway.
We thank the patients participating in this study. We also want to thank the following institutions involved in the data collection: NIMI/Hjelp 24, Ullevål Stadium, Oslo University Hospital Rikshospitalet, Aker Hospital, Friskvernklinikken Asker, Stadion Physiotherapy Clinic and Hans & Olaf Physiotherapy.
The authors declare no conflicts of interest.
References
APPENDIX I. The 3 stages in the completion of the Patient Generated Index (PGI) for patients with low back pain | |||||
Stage 1: Area affected | Stage 2: Score area 0–6 | Stage 3: Distribute 10 points | Total | ||
1. Work | 2 | × | 4/10 | = | 0.8 |
2. Play with my children | 3 | × | 4/10 | = | 1.2 |
3. Hobby | 2 | × | 0/10 | = | 0 |
4. Exercise | 2 | × | 0/10 | = | 0 |
5. Sleep | 3 | × | 1/10 | = | 0.3 |
6. All other areas affected by your low back pain | 3 | × | 1/10 | = | 0.3 |
PGI sum scorea | 2.6/6 | × | 100 | = | 43.3 |
aPGI sum score = [ Σ (area score × points spend /10) ] / 6 × 100. | |||||

