Megan L. Tinl, PT, DPT1, Madhuri K. Kale, PT, MS1, Saloni Doshi, PT, DPT1, Anthony J. Guarino, PhD2 and Marianne Beninato, DPT, PhD2
From the 1Department of Rehabilitation Services, Brigham and Women’s Hospital and 2Department of Physical Therapy School of Health and Rehabilitation Sciences, MGH Institute of Health Professions, Boston, MA, USA
OBJECTIVE: To evaluate the predictive validity of the Mobility Scale for Acute Stroke (MSAS) in determining discharge destination (home or not home) after an acute stroke.
DESIGN: Cohort study.
SUBJECTS: Two-hundred and twenty-three patients with acute ischemic or intraparenchymal hemorrhagic, unilateral stroke
METHODS: The MSAS was administered as part of the initial physical therapy examination. The Receiver Operating Characteristic determined the optimal MSAS cutoff score associated with discharge home. A multiple logistic regression equation with discharge destination as the criterion variable (home or not home) was conducted with age, length of stay and optimal MSAS cutoff score as covariates.
RESULTS: Subjects were discharged home 35.9% (n = 80) and not home 64.1% (n = 143) of the time. Mean age was 68.5 years (standard deviation 1.8). The ROC determined 26 to be the optimal cutoff score for the MSAS. Results of the multiple logistic regression equation indicated that controlling for age and length of stay, only the MSAS cutoff score of 26 reliably predicted discharge to home with an adjusted odds ratio of 57.79 with a 95% confidence interval of 20.09–166.21.
CONCLUSION: The MSAS may be useful for predicting discharge destination from the acute hospital after stroke.
Key words: stroke; acute; outcome assessment; rehabilitation; patient discharge.
J Rehabil Med 2014; 46: 00–00
Correspondence address: Megan Tinl, PT, DPT, Department of Rehabilitation Services, Brigham and Women’s Hospital, 75 Francis St, Tower 2C, Boston, MA 02115, USA. E-mail: mtinl@partners.org
Accepted Oct 10, 2013; Epub ahead of print Dec 12, 2013
INTRODUCTION
After acute stroke, timely discharge planning can enhance use of healthcare resources, improve patient outcomes, and decrease financial burden (1). After medical stabilization, the rehabilitation team is largely responsible for determining the most appropriate post-acute level of care (1). Of particular importance is identifying those patients who may be safely discharged home as compared with those who will need further in-patient rehabilitation. It is therefore imperative to utilize measures that accurately and efficiently aid in determining the most appropriate rehabilitation setting. The rehabilitation team plays a key role in determining discharge destination by evaluating activity limitations and tolerance for rehabilitation (2).
Assessment of activity limitations, including position changes, transfers, walking, dressing and other aspects of self care, have been studied as predictors of discharge destination from the acute hospital setting in people post stroke. Specifically, higher scores on the 10-item Barthel Index (BI) (3) have been associated with discharge home as compared with discharge to in-patient rehabilitation settings (4–7). The Functional Independence Measure (FIM) (7, 8), developed as a post-acute rehabilitation measure, has been studied as a predictor of discharge destination after acute stroke where higher FIM scores were also associated with discharge to home versus other settings (7, 9–11). In addition to these better known indices of activity, the Mobility Scale for Acute Stroke (MSAS) (12, 13) is an assessment tool developed in the Australian healthcare system to predict discharge destination from the acute hospital setting in patients with acute ischemic or hemorrhagic stroke (14). The MSAS is a unidimensional instrument that produces a single aggregate score from 6 basic mobility activities that correspond with the range of abilities seen in people with acute stroke (12). The advantages of the MSAS include being shorter than either the BI or the FIM and, unlike the FIM, the MSAS was designed specifically for use in stroke in the acute hospital setting (12). Additionally, all 6 items are typically part of an initial physical therapy assessment. As such, the MSAS can be administered efficiently as part of usual care (12, 13, 15). Previous research in the Australian health care system has demonstrated that the MSAS explained 69% of the variation in the total length of stay (LOS) when measured at two weeks post stroke (14). The mean LOS was, however, 89 days in the Australian system because stroke care in that system is continuous from acute care through the rehabilitation phase (14). These findings are difficult to extrapolate to the U.S. care system because at two weeks post onset, most patients within the U.S. system have already been discharged from the acute setting (16). The MSAS, nevertheless, may be a significant predictor of discharge destination from the acute hospital setting in the U.S. healthcare system, however, has yet to be researched for that purpose.
The aim of the present study, therefore, was to evaluate the predictive validity of the MSAS in determining the discharge destination (home or not home) after acute stroke. Specifically, we sought to identify an optimal cut off score on the MSAS and prospectively determine the accuracy of that score for predicting discharge destination as home versus not home in people with acute, ischemic or intraparenchymal hemorrhagic stroke. Furthermore, we also sought to determine how accurately an optimal score on the MSAS combined with age, sex, stroke hemisphere, and type of stroke as covariates predicted discharge home from the acute care setting.
METHODS
Participants
Participants were patients admitted to the neuroscience service of a tertiary care academic hospital who were referred for physical therapy examination from January 2009 to January 2010. Participants were included if they had a diagnosis of acute, unilateral, cerebral, ischemic or intraparenchymal hemorrhagic stroke confirmed by imaging. Participants were excluded if they resided in a skilled nursing facility or were non-ambulatory prior to admission, had a secondary major trauma at the time of the stroke, had a diagnosis of subarachnoid hemorrhage, or underwent a surgical intervention or interventional radiology procedure for stroke management. The Institutional Review Board for Human Subject Research of the Brigham and Women’s’ Hospital approved this study.
Mobility Scale for Acute Stroke
The MSAS (12) is a measure comprised of 6 items which include bridging in a supine position (lifting buttocks off of a surface with knees bent and feet flat), moving from a supine to sitting position and back, performing a sit to stand transfer, and assessment of sitting balance, standing balance, and gait (Table I). Each item is scored on a 6 point ordinal scale (1–6) based on the amount of physical assistance required to complete the task. A lower score indicates that more assistance is required to perform the task. Scores range from inability to perform the task (score 1), maximal assistance of one or two people required (score 2), moderate assistance of one required (score 3), minimal assistance of one required (score 4), supervision required (score 5), to independent and safe (score 6). Total scores range from 6 to 36.
Concurrent validity of MSAS scores has been reported with the Motor Activity Scale (r = 0.89, p < 0.001), the Functional Ambulation Classification (r = 0.83, p < 0.001), the motor score of the FIM (r = 0.88, p < 0.001), and the BI (r = 0.88, p < 0.001) (12). Excellent intra-rater reliability has been established with Spearman rho ranging from 0.95 to 0.98 (12). Inter-rater reliability based on the weighted Kappa has also been reported ranging from 0.80 to 0.93 (12) and was unaffected by years of experience of the physical therapist (12). Training prior to administration of the MSAS in the reliability study (12) consisted of self instruction based on a written description of the operational definitions of the rating scale and the tasks.
|
Table I. Mobility Scale for Acute Stroke (MSAS) scores for whole sample and by discharge disposition group |
|||
|
MSAS Score |
Home n = 80 Median (IQR) |
Other n = 143 Median (IQR) |
Whole sample n = 223 Median (IQR) |
|
Total MSAS |
34 (19–36) |
15 (6–36) |
22 (6–36) |
|
Item 1. Bridging |
6 (1–6) |
3 (1–6) |
5 (1–6) |
|
Item 2. Sit from Supine, return to Supine |
6 (3–6) |
3 (1–6) |
4 (1–6) |
|
Item 3. Sitting Balance x 3 minutes |
6 (4–6) |
4 (1–6) |
5 (1–6) |
|
Item 4. Sit to Stand from chair no arms |
6 (3–6) |
2 (1–6) |
3 (1–6) |
|
Item 5. Standing Balance x 1 minute |
5 (1–6) |
2 (1–6) |
4 (1–6) |
|
Item 6. Gait 10 meters with/without gait aide |
5 (1–6) |
1 (1–6) |
1 (1–6) |
|
Home: those patients discharged home from acute care; Other: those patients discharged to other in-patient facilities from acute care; IQR: interquartile range. |
|||
Procedures
Patients were evaluated by a physical therapist on the neuroscience service upon referral from the medical team within 24–72 h of being deemed medically stable. The hospital is designated by the Massachusetts Department of Public Health as a Primary Stroke Service provider and participates in the American Heart Association “Get with the Guidelines” quality improvement program for stroke (17). As such, patients with a diagnosis of stroke who had potential rehabilitation needs were referred for physical therapy evaluation for the purposes of early rehabilitation and discharge planning. The MSAS was used to assess mobility as part of the initial physical therapy examination. All physical therapists participating in the study were trained in the use of the MSAS prior to the start of data collection. Each therapist became familiar with the operational definitions of the 6 tasks and with the rating scale. In addition to MSAS scores, demographic data, stroke type, hemisphere affected, discharge destination, and LOS were collected retrospectively from the medical record.
Data analyses
All statistical tests were conducted using IBM SPSS version 20 (SPSS Inc, 233 S. Wacker Dr., Chicago, IL 60606–6307) with alpha set at p < 0.05. Variable characteristics were analyzed by frequencies for categorical variables and measures of central tendency for continuous variables. Differences in characteristics between patients discharged home versus not home were conducted with the Pearson’s Chi-square if the variables were categorical and the Studentized t-test if the variables were continuous or the Welch’s t test if the equal variance assumption was violated.
Because reliability is not the property of the instrument but of the sample scores (18), Cronbach’s alpha, average inter-item correlation, corrected item-total correlations, and the squared multiple item to total correlations were calculated to assess internal consistency. Although internal consistency is necessary, it is not sufficient to determine unidimensionality (19). Unidimensionality of a scale requires both internal consistency and a single factor solution (20). The unidimensionality of the MSAS scores was assessed by a series of factor analyses with the following extractions, principal axis, maximum likelihood, and parallel analysis, as recommended by Meyers et al. (21). The parallel analysis is considered a more accurate measure of unidimensionality (21). The alpha was used as a confirmatory measure if the factor analyses yielded a single factor solution (20).
The optimal MSAS cutoff score to differentiate patients discharged home from not home was determined by the Receiver Operating Characteristic (ROC) analysis. The aggregated MSAS scores were plotted and the area under the curve (AUC or c statistic) was calculated. The point on the curve nearest the upper left hand corner was chosen as the optimal cutoff score for classifying participants according to discharge destination as this cutoff score rendered the maximum number of accurate classifications considering sensitivity (SN; true positives) and specificity (SP; true negatives). A multiple logistic regression analysis was performed with discharge destination as the dependent variable and age, LOS, and the optimal dichotomized MSAS score as covariates.
RESULTS
Analysis was based on 223 patients. The mean age of the sample was 65.5 years (standard deviation; SD 14.8) (range 19–94) and patients were 51.6% male. The right hemisphere was affected in 50.7% of patients and the left hemisphere in 49.3%. Stroke type was predominantly ischemic (83.0%) as compared with intraparenchymal hemorrhage (17.0%) (Table II). The mean LOS was 6.67 days (SD 6.0) (range 1–41). Patients were discharged home 35.8% (n = 80) of the time. Patients who were not discharged home comprised a total of 64.2% (n = 143) including 55.2% (n = 123) to acute rehabilitation, 8.1% (n = 18) to skilled nursing facility and 0.9% (n = 2) to hospice care. The median MSAS total score was 22 (range 6–36); 6.7% of participants scored the minimum of 6 and 15.2% of patients scored the maximum of 36 (Fig. 1). The MSAS was administered a mean of 4.2 days post-stroke (+/–2.54; range 1–18 days, mode = stroke day 3).
|
Table II. Demographics between home and other facility |
|||||
|
Variable |
Other facility n (%) |
Home n (%) |
χ2 |
df |
p |
|
Sex |
1.09 |
1 |
0.29 |
||
|
Female |
73 (67.6) |
35 (32.4) |
|||
|
Males |
70 (60.9) |
45 (39.1) |
|||
|
Diagnosis |
1.82 |
1 |
0.18 |
||
|
Ischemic |
115 (62.2) |
70 (37.8) |
|||
|
IPH |
28 (73.7) |
10 (26.3) |
|||
|
Hemisphere |
1.61 |
1 |
0.21 |
||
|
Left |
66 (60.0) |
44 (40.0) |
|||
|
Right |
77 (68.1) |
36 (31.9) |
|||
|
Hemisphere: hemisphere affected by stroke; IPH: intraparenchymal hemorrhage; p-value from Pearson χ2. |
|||||
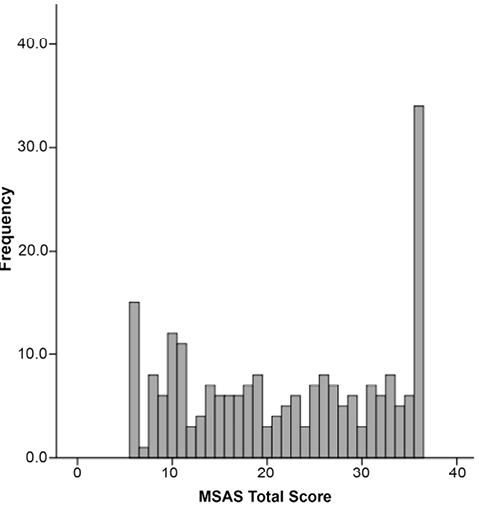
Fig. 1. Distribution of Mobility Scale for Acute Stroke (MSAS) initial scores (n = 223).
Results of the Student t-test indicated a significant difference in age, t(221) = 3.07, p = 0.002, η2 = 0.041, a weak effect. Patients who were discharged home were younger, (M home = 64.51, SD home = 16.07) than patients discharged to other facilities (M not home = 70.76, SD not home = 13.64). Because the equal variance assumption was violated as measured by the Levene’s Test, F(1, 221) = 20.76, p < 0.001, the Welch’s t test was conducted which indicated a significant difference in LOS, Welch’s t(14.42), p < 0.001, η2 = 0.13, a large effect. Patients discharged home had a shorter LOS time (M home = 3.91, SD home = 2.77) than patients discharged to other facilities (M not home = 8.36, SD not home = 6.64). Results of the Pearson’s χ2 reported no statistically significant differences between the groups on sex, type of stroke (ischemic vs. hemorrhagic), or hemisphere affected.
Results of the Cronbach’s alpha indicated that the MSAS scores achieved a coefficient of 0.97. The average inter-item correlation was 0.85 and the corrected item-total correlations ranged from 0.85 to 0.97. The squared multiple correlations ranged from 0.77 to 0.94. A single factor solution was reported by the different factor analysis extractions.
The ROC determined 26 to be the optimal cutoff score for the MSAS to predict discharge destination with an area under the curve of 96 (95% confidence interval; CI = 0.93–0.98) which is an excellent index of differentiation between the groups (21). The overall success rate was 0.89 with a SN of 0.94 and a SP of 0.86. The positive predicted value was.78 with an OR of 92.25 (95% CI of 33.23 to 256.13) (Fig. 2).
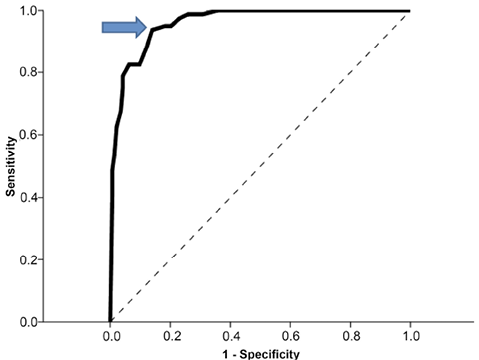
Fig. 2. Receiver operating characteristic curve of plotted Mobility Scale for Acute Stroke (MSAS) scores plotted with home/not home as dichotomous outcome. Dotted line indicates area of 0.50. Arrow indicates cutoff MSAS score of 26.
The significant variables of age, LOS, and optimal MSAS cut off score of 26 were entered into a multiple logistic regression analysis with discharge destination (home or not home) as the criterion variable. The case-to-variable ratio of 10-to-1 as advised by Peduzzi et al. (22), was exceeded in this study. Prior to conducting the multiple logistic regression analysis, data were evaluated to determine if there were any violations to the assumptions of normality, linearity, and homoscedasticity of residuals, as well as multicollinearity. Both the condition index of 13.84 reported from the collinearity diagnostics table and the tolerance values exceeding 0.90 indicated that multicollinearity was not a concern. Additionally, there were no violations to the aforementioned assumptions.
Results indicated the overall model fit was statistically significant, χ2 (3, N = 223) = 156.04, p < 0.001, indicating that the predictors reliably distinguished between patients returning home from those discharged to another facility. The model explained 69% (Nagelkerke’s R2) of the variance in discharge destination. The Hosmer and Lemeshow Test reported non-significance, χ2 (8) = 3.65, p = 0.89 suggesting an excellent fit between the model and data. According to the Wald criterion, none of the additional variables improved the predictive classification beyond that seen with the MSAS cut off score of 26 alone. Table III presents the regression coefficients, Wald statistics, odds ratios, and the 95% CI for the odds ratios for each of the 3 predictors.
|
Table III. Logistic regression results |
||||
|
Variables |
B |
Wald Test |
Odds ratio |
95% CI for odds ratio |
|
MSAS score cutoff 26 |
4.05 |
56.66 |
57.79 |
20.09–166.21 |
|
LOS |
–0.14 |
3.59 |
0.87 |
0.76–1.00 |
|
Age |
–0.02 |
1.58 |
0.98 |
0.95–1.01 |
|
Constant |
–0.88 |
0.45 |
0.42 |
|
|
MSAS scores entered as dichotomous variable as < 26 or ≥ 26. MSAS: Mobility Scale for Acute Stroke; LOS: length of stay; CI: confidence interval. |
||||
DISCUSSION
This prospective study suggests that a cut off score of 26 on the MSAS may be a useful predictor of discharge destination after acute hospitalization for ischemic or intraparenchymal hemorrhagic stroke. The items contained within the MSAS are routinely assessed during a physical therapy examination and do not require time-consuming, additional test administration. The cutoff score of 26 accurately predicted discharge destination (home or not home) and may be a useful clinical guide in decision making regarding discharge planning. This study was the first to demonstrate the use of the MSAS for this purpose within the context of the U.S. healthcare delivery system.
The accuracy of the MSAS in predicting discharge destination after acute stroke compares favorably with and may be superior to other activity scales such as the BI (3) and the FIM (8). Samuelsson et al. (5) found significantly higher BI scores (p < 0.001) in those discharged home after acute stroke. Bohannon et al. (4) found a positive correlation between BI scores collected at the time of the first therapy visit and discharge destination (Pearson r = 0.535) acutely after stroke. van der Zwaluw et al. (6), applying logistic regression, showed that BI scores explained 47% of the variation of discharge destination (home vs. dependent living situation) when age and BI score were taken into account. In comparison, our model was able to explain 69% of the variance of discharge destination. The association of the FIM (8) with discharge destination has been studied to a limited extent in the acute setting. Unsworth (11) developed predictive models to assist clinicians in the Australian healthcare system to determine whether patients should be discharged to nursing homes, inpatient rehabilitation, or to home. They used 3–7 items from the FIM or the total FIM plus 9 additional variables, such as swallowing, co-morbidities, and cognition. Their models correctly classified between 74.9% and 80.5% of patients when assessed 3 days prior to discharge from the acute setting. This compares with our overall prediction rate of 89%. In a retrospective study of patients with stroke in an acute care setting, Bohannon et al. (9) determined that FIM admission scores for bed mobility, transfers, locomotion, and stairs correlated significantly with discharge destination (Spearman rho = 0.588, 0.599, 0.616, and 0.486, respectively). Mauthe et al. (10), using discriminate analyses, identified 6 items from the admission FIM (bathing, bowel management, toileting, social interaction, dressing lower body, and eating) that together correctly classified 70% of patients according to predicted discharge destination from acute care. Our current findings suggest that the 6 items comprising the MSAS yield more accurate prediction of discharge destination. It appears that the level of physical assistance required to perform the activities assessed in the MSAS is a more discriminative indicator of discharge destination after acute stroke than measures that assess a combination of skills, including cognitive and communication ability, performance of self-care tasks, and mobility. Clinically, patients who require an increased amount of physical assistance for mobility are less likely to be discharged home after an acute stroke due to the lack of adequate assistance available in their home environment as well as the decreased intensity of rehabilitation available in home settings. In our sample, patients who went home had a mean MSAS score that was twice as high as those who did not. These findings underscore the importance of ability in these activities assessed by the MSAS in determining discharge destination.
Several studies have also found predictive value in the National Institutes of Health Stroke Scale (NIHSS) (4, 23–26). Treger et al. (26) found that the relative risk of discharge to either a rehabilitation or nursing facility increased with increasing stroke severity as measured by the NIHSS. Similarly, Reynolds et al. (25) found that mild, moderate, and severe stroke severity, measured by the NIHSS, was closely associated with discharge to home, rehabilitation, and skilled nursing facility, respectively. Using multivariate analysis, Schlegel et al. (23) found that moderate (NIHSS 6–13) stroke was associated with discharge to rehabilitation (OR 4.8) and severe (NIHSS > 13) stroke with discharge to a nursing facility (OR 310.0). Rundek et al. (24) found that patients with moderate stroke severity (NIHSS 6–13) had increased odds of going to rehabilitation (OR = 8.0) or a nursing home (OR = 3.8) versus home. They also found that patients with severe (NIHSS ≥ 14) stroke had even greater odds of going to either a rehabilitation (OR = 17.8) or a nursing facility (OR = 27.9) than home. In our current findings, although we did not have a measure of initial stroke severity available, the MSAS score generated large ORs comparable or greater than the aforementioned studies for discharge to home versus another setting, suggesting that it may be as useful as stroke severity scales for predicting discharge destination and should be a routine part of rehabilitation assessments in the acute setting. Interestingly, Bohannon et al. (4) found that the NIHSS added no predictive value relative to discharge destination after accounting for the ability to perform specific activities reflected in BI scores. These findings and those of the current study suggest that activity, as measured by the MSAS and similar scales, may be a better predictor of discharge setting and need for further rehabilitation as compared with the body function level measures of the stroke severity scales. This is likely due to the fact that stroke severity scales only quantify stroke-related neurologic deficits and do not take into account how these deficits translate into difficulty with activity, which is an important consideration in the determination of discharge destination from the acute hospital setting. Additionally, these stroke severity scales do not quantify the amount of physical assistance required to complete an activity, which if significant, can be a further determining factor in the need for ongoing inpatient rehabilitation.
In our study, we established an optimal cutoff score of 26 for prediction of discharge destination. This gives clinicians a valuable, usable reference point for clinical decision making. None of the other covariants added value to the MSAS score for prediction of discharge destination. The literature on the role of sex (4, 5, 24, 26–35), age (4, 5, 23, 24, 26–28, 31, 32, 35, 36), type of stroke (23, 24, 26, 31, 32), length of acute hospitalization (26, 37, 38) and number of days spent in the intensive care unit (31) is mixed on these factors’ association with discharge destination from the acute care setting. The findings based on the current sample suggest that activity, as measured by the MSAS, is a more important factor in determining discharge destination from the acute setting.
Our study has several potential limitations. We excluded subjects if they had surgical intervention or interventional radiology procedures related to the diagnosis of stroke, presumably eliminating some of the more severely-involved individuals. Factors that have previously been shown to contribute to prediction of discharge destination from acute care, including the administration of tissue plasminogen activator (23), ischemic stroke subtypes (39), and volume of hemorrhagic stroke (40) were not investigated in this study. Additionally, cognitive limitations (26, 27, 34), prestroke activity level (4, 26, 28), and social situation (24, 30, 32, 36) were not investigated in this study. Future studies may include additional variables such that may improve the predictive accuracy of the MSAS.
As a reflection of the relatively small sample size, the CI for the ORs were broad. A larger sample size would likely attenuate this effect. Nevertheless, even using the lower limit of the 95% CI, the MSAS at a cutoff score of 26 may be a powerful predictor of discharge destination after stoke from the acute care setting. This interpretation, however, will need to be verified with a multisite study as the results from this current single site should not be generalized to all acute care settings. Further study of the utility of the MSAS for predicting discharge destination at different acute care sites is indicated. The results from our Cronbach analysis indicate high internal consistency. In addition, the inter-item and item-total correlations strongly supported the internal consistency of the scale, and the results of the single factor solution and the high alpha coefficient strongly supported the unidimensionality of the MSAS. Nevertheless, further study of the psychometric properties of the MSAS using Rasch analysis is particularly warranted, considering its ordinal nature.
In conclusion, our results suggest that the MSAS, at a cut off score of 26, may be a useful and accurate tool for predicting discharge destination after stroke from the acute hospital setting. The MSAS is a 6-item measure of activity that is an integral part of the physical therapy examination, and as such, may be utilized to facilitate discharge planning and optimize utilization of resources.
ACKNOWLEDGEMENTS
We wish to thank physical therapists Merideth Donlan, Jason Figueiredo, Patricia Flynn, and Christine Iracheta for their assistance with data collection.
REFERENCES

