Daniel Merrick, MD, PhD1, Gunnevi Sundelin, PT, PhD2 and Britt-Marie Stålnacke, MD, PhD1
From the 1Department of Community Medicine and Rehabilitation, Rehabilitation Medicine and 2Department of Community Medicine and Rehabilitation, Physiotherapy, Umeå University, Umeå, Sweden
OBJECTIVE: To follow up 2 rehabilitation strategies for patients with chronic pain: a 2-day interdisciplinary team assessment followed by either (i) a 4-week outpatient multimodal rehabilitation programme, or (ii) a subsequent rehabilitation plan.
METHODS: After a 2-day interdisciplinary team assessment at our pain rehabilitation clinic, 296 consecutive patients were selected to undergo either a multimodal rehabilitation programme (n = 76) or a rehabilitation plan (n = 220). They completed questionnaires regarding beliefs about the future (only at assessment), Multidimensional Pain Inventory and sick leave, both at assessment, and at 1-year follow-up.
RESULTS: Both the rehabilitation plan and multimodal rehabilitation programme groups improved significantly as regards decreased sick leave and the Multidimensional Pain Inventory scales Pain severity, Interference, and Support. The multimodal rehabilitation programme group also improved significantly regarding Life control and Affective distress. For men, low disability level and for women a positive expectation about work was associated with no sick leave at follow-up.
CONCLUSION: The multimodal rehabilitation programme had long-term positive effects on sick leave and all Multidimensional Pain Inventory scales. However, a less intense intervention (rehabilitation plan) with follow-up in primary care can decrease levels of sick leave and improve some Multidimensional Pain Inventory scales. An interdisciplinary team assessment of patients with chronic pain seems to be useful for selecting which patients should undergo different rehabilitation interventions.
Key words: pain; sick leave; multimodal rehabilitation.
J Rehabil Med 2013; 45: 00–00
Correspondence address: Britt-Marie Stålnacke, Department of Community Medicine and Rehabilitation, Rehabilitation Medicine, Umeå University, SE-901 87 Umeå, Sweden. E-Mail: brittmarie.stalnacke@rehabmed.umu.se
Accepted May 20, 2013; Epub ahead of print Sep 3, 2013
INTRODUCTION
The prevalence of chronic musculoskeletal pain is high (1) and has major economic, psychological and social consequences for the individual as well as for the community (2, 3). Some studies imply that women have higher prevalence rates of chronic musculoskeletal pain, and are more likely to report more severe pain than men (4–7). In general, patients with chronic musculoskeletal pain report low life satisfaction (8), low self-perceived level of activity (8, 9), stress, anxiety and depression (10). Chronic musculoskeletal pain also plays an important role in reduced work effectiveness, more lost work days, frequent use of healthcare, sick leave and disability retirement, and contributes significantly to the rising healthcare costs on a national level (3, 11–13). In 2002, Sweden was the leading country within the European Union in sick-listing for musculoskeletal pain (3). Back and/or neck pain together with mental disorders have been one of the leading disorders causing long-term sick-listing and new cases of disability retirement in Sweden (14).
Sustainable treatment effects are needed for patients with chronic pain who are on sick leave or at risk of being on sick leave (15). Currently, there is support for the efficacy of intensive multidisciplinary treatment for reducing days on sick leave as well as facilitating a return to work (15, 16). However, the reality is that the vast majority of patients with chronic pain do not receive multimodal rehabilitation (17). Of the patients referred to specialist pain rehabilitation clinics in Sweden, approximately 25% participate in multidisciplinary rehabilitation programmes, while 75% are only assessed (18, 19). In most studies of multidisciplinary rehabilitation, women comprise the majority of patients. There is a lack of knowledge regarding the results for women and men, respectively, since few studies have presented results for each gender separately.
Moreover, chronic pain patients are a heterogeneous group, which means a variety of interventions might be needed (20, 21) and some patients may get adequate help by treatment from a single profession, such as physiotherapy or psychologist sessions. It has therefore been suggested that the evaluation of chronic pain patients should be based on a multidimensional assessment, the emphasis being on assessing the patient and not just the pain (22). Hence, the Multidimensional Pain Inventory (MPI) (22) was developed, a tool that combines information from 3 axes: 1 psychosocial and 2 behavioural. In addition, in order to select adequate intervention for each patient, it may be important to base the initial assessment on an interdisciplinary team approach. Patients referred to specialist pain rehabilitation clinics in Sweden are commonly assessed by interdisciplinary teams. Based on the team assessment, patients are then selected for participation in multimodal rehabilitation programmes. Since only patients who participate in rehabilitation programmes are evaluated by a national pain rehabilitation registry, the Swedish Quality Registry for Pain Rehabilitation (SQRP) (18, 19), it may be of importance to also study the group of patients not evaluated by the SQRP.
Therefore, to investigate the team assessment in the rehabilitation process and the 1-year outcomes after rehabilitation, we decided to study the 2 different rehabilitation strategies consisting of a 2-day interdisciplinary team assessment followed by either (i) a 4-week outpatient multimodal rehabilitation programme (MMR), or (ii) a subsequent rehabilitation plan in primary healthcare (RP). The aims were: (i) to follow up the 2 rehabilitation strategies after 1 year, focusing on sick leave; and (ii) to identify predictive factors for not being on sick leave at follow-up
METHODS
Design
This study was a prospective study in a clinical setting with 1-year follow-up of 2 different rehabilitation strategies for chronic pain patients conducted at the Pain Rehabilitation Clinic at the Umeå University Hospital, Sweden.
Patients
A total of 296 patients, 102 men and 194 women, were referred from primary care units to the pain rehabilitation clinic at the Umeå University Hospital. The criteria for patients to be subjects for a 2-day team assessment were: age 18–65 years and disabling chronic musculoskeletal pain in need of an assessment at specialist level. Patients were assessed consecutively by our interdisciplinary assessment teams. Data were gathered between 1 October 2007 and 30 September 2008 and at follow-up 1 year later; thus, the study went on until 2009. Written, signed and informed consent was obtained from all participants. All patients were interviewed and examined in a standardized 2-day procedure, after which the patients were allocated to either RP or MMR. A total of 220 patients were allocated to the rehabilitation plan and primary care group (RP). Seventy-six patients were eligible for an outpatient, multimodal rehabilitation programme lasting 4 weeks (MMR). Both groups were followed up after 1 year.
This study was performed in accordance with the Declaration of Helsinki and approved by the Regional Ethical Review Board of Umeå University (Dnr: 08-160M).
Procedure
Postal questionnaires included in the SQRP (18) were used at the initial assessment and 1 year later for both the RP and the MMR group. The patients completed the first questionnaire at home and handed them in at the initial assessment. For the 1-year follow-up, participants completed the second questionnaire at home to be returned by post in a prepaid addressed envelope. If necessary, we reminded the patients by post, and if the patients had still not responded, we tried to reach the person by telephone. The selected questionnaires covered demographics (only at baseline) including work status (both at baseline and follow-up), pain intensity (only at baseline), anxiety/depression (at baseline), disability index (at baseline), one domain of life satisfaction (vocational health; both at baseline and follow-up), the first section of MPI (22) (both at baseline and follow-up) as well as patients’ beliefs about the future (only at baseline): How convinced are you about recovery?; How do you envisage it will be to return to work, to study, or to extend your working hours?; When do you expect to return to work, to study, or to extend your working hours?
Two-day interdisciplinary assessment
The 2-day interdisciplinary team assessment was based on the biopsychosocial approach, which considered physical, psychosocial and social aspects of the chronic pain condition. Each professional interviewed and examined the patients individually in a standardized 2-day procedure. The interdisciplinary teams consisted of a specialist physician in rehabilitation medicine, a physiotherapist, a social worker, an occupational therapist, and a cognitively trained psychologist, if needed. The physician’s assessment included: a pain history and clinical examination to exclude serious underlying conditions that would cause pain; need for further investigations, and/or optimization of the pharmacological treatment. The psychologist assessed psychological factors, such as anxiety and depression. Coping strategies were assessed by the psychologist and the social worker. The physiotherapist performed a structured physical examination, and the occupational therapist examined activity levels in daily life. The team also assessed the patient’s expectations and readiness for change. On the second day, the assessment was discussed at a team conference together with the patient and the patient’s general practitioner who was invited to the conference. If the general practitioner could not attend the conference, he/she had the possibility of participating over the telephone. At the conference, the team discussed their findings with the patient, giving information about and explaining the pain and the patient had the opportunity to ask clarifying questions. It was decided whether the patient fulfilled the inclusion criteria and was suitable for the 4-week multimodal rehabilitation programme (MMR) or if the patient should undergo a rehabilitation plan, with suggestions and recommendations for further treatment with follow-up at the patient’s primary healthcare centre (RP). Both the referring general practitioner and the patient received a copy of the rehabilitation plan.
Rehabilitation plan and primary care group
If the interdisciplinary team considered after the 2-day assessment that the patient would benefit from treatment by one profession only (physiotherapist, psychologist, occupational therapist, etc.) and/or did not fulfil the inclusion criteria for the MMR program, an individual rehabilitation plan was presented to the patient and the general practitioner to monitor. The rehabilitation plan included an assessment of the patient’s work capacity, suggestions and recommendations for further investigations and treatment for the RP group.
Multimodal rehabilitation programme
If the interdisciplinary assessment team considered the patient to be suitable for a 4-week outpatient rehabilitation programme and he/she agreed to participate and the inclusion criteria were fulfilled, they were accepted to the MMR programme in groups of 6–8 participants. Inclusion criteria for the MMR programme were (i) disabling chronic pain (on sick leave or experiencing major interference in daily life due to chronic pain); (ii) age 18–65 years; (iii) no further medical investigations needed; (iv) written consent to participate in and attend the MMR programme; and (v) agreement not to participate in other parallel treatments.
Exclusion criteria were: (i) ongoing major somatic or psychiatric disease; (ii) a history of significant substance abuse; and (iii) state of acute crisis.
The MMR programme included physical and occupational therapy, information and training in coping strategies, information about bodily and psychological reactions to chronic pain, relaxation and body-awareness training. All patients also had an individual schedule covering 6 h a day for the 4 weeks. At the end of the programme, contacts were established with external collaborating partners such as the workplace, the Swedish Social Insurance Agency and the patient’s general practitioner.
Outcome measures
Sick leave. The sick leave situation for the MMR and the RP groups was registered by the self-reported SQRP questionnaire at the assessment (baseline) and at follow-up. In Sweden, patients can be on 4 levels of sick leave: 25, 50, 75 and 100%. We divided the patients’ work status into 3 categories: full-time sick leave, part-time sick leave and no sick leave. We defined full-time sick leave as 100% sick leave, and patients on part-time sick leave as at least 25% up to 75% sick leave. The rest made up the group of patients who were not on sick leave. It included patients who worked full-time, students, patients on parental leave, unemployed and patients on welfare payments.
Multidimensional Pain Inventory. The MPI is divided into 3 sections: 1 psychosocial part (section one) and 2 behavioural parts (22). Section 1 comprises 5 scales reporting Pain severity, Interference with life, Support from significant others, Life control, and Affective distress and contains altogether 28 questions. The patient is asked to indicate on a 7-point scale ranging from 0–6. Section 2 contains reports of perceived responses from significant others. Section 3 contains questions concerning 19 common activities. Only section 1 was used in this study.
Patients’ thoughts about the future. Simple 5-category scales were constructed for this purpose. We dichotomized the responses into 2 groups: 1–3 = positive outlook and 4–5 = negative outlook. The patients were asked to indicate on a self-reported form their thoughts about the future regarding the following 3 questions: (i) How convinced are you about recovery? (ii) How do you envisage it will be to return to work, to study, or to extend your working hours? (iii) When do you expect to return to work, to study, or to extend your working hours? Anchor points were: 1 = Entirely convinced about recovery; 5 = Not at all convinced about recovery, and 1 = Very easy; 5 = Very difficult and 1 = Immediately and 5 = Never. Categories 2–4 were not specified.
Visual analogue scale. The visual analogue scale (VAS) was used to rate the pain intensity for “current pain” (23). VAS is a 100-mm scale that has been proven to be reliable (24), and has been validity tested and shown reproducibility for chronic pain (25).
Disability Rating Index. The level of disability was measured by the Disability Rating Index (DRI) (26). The DRI instrument is a questionnaire covering 12 items concerning physical function, where the patient indicates on a 100-mm VAS their presumed ability (capacity) to perform various daily physical activities. The DRI items can either be analysed separately or as a total mean index score, DRI Index, which has been used in this study. The DRI has proven to be both reliable and valid for patients with chronic neck, shoulder and low back pain (27).
Hospital Anxiety and Depression Scale. The Hospital Anxiety and Depression Scale (HADS) (28) was developed to identify cases of anxiety disorders and depression in a hospital setting. It is divided into an Anxiety and a Depression subscale, both including 7 questions to be assessed on a 4-point Likert scale (0–3). The maximum total score in each category is 21 points. HADS is categorized into: normal (0–7 points), mild (8–10 points) and moderate/severe (> 10 points). HADS has proven to be both reliable, valid, sensitive and specific in assessing symptom severity in anxiety and depression in different populations (29).
Life satisfaction (LiSat-11). Life satisfaction was assessed using the LiSat-11 questionnaire (30), which comprises estimations of life satisfaction in 11 domains. Levels of satisfaction were estimated on a 6-grade scale (from 1 = very dissatisfying to 6 = very satisfying). The LiSat-11 scale is dichotomized into satisfied (5–6) or not satisfied (1–4). In this study, we studied the domain “vocational health”. LiSat-11 has been shown to have a fairly good test-retest reliability, specificity, and sensitivity (30). Patients were compared with a healthy Swedish reference group of 2553 individuals (30).
Statistical analyses
Data analyses were conducted using SPSS version 18.0 software. Data are reported as means (standard deviation; SD) unless indicated otherwise. Differences between groups at baseline were tested with Mann-Whitney U test and χ2 test. For analyses within the intervention groups over time, we used the Wilcoxon test and the McNemar test. Between the groups, differences over time (RP vs MMR) were analysed using the Mann-Whitney U test. In order to avoid mass significance, we interpreted the p-value < 0.01 as significant.
Furthermore, an univariate logistic regression analysis was employed to analyse association between the “no sick leave” group at 1-year follow-up and the following dichotomized variables: anxiety (normal and mild vs moderate/severe) depression, (normal and mild vs moderate/severe), gender (male/female), patients’ beliefs about recovery (positive vs negative), patients’ vision about work (positive vs negative), patients’ expectation about work (positive vs negative outlook), primary school and secondary school vs university, DRI (0–50 mm vs 51–100 mm), pain intensity VAS (current pain; 0–50 mm vs 51–100), age (≤ 39 vs > 39), intervention (RP vs MMR), MPI pain severity (dichotomized into 0 ≤ 2 and > 2–6), MPI interference (dichotomized into 0 ≤ 2 and > 2–6), MPI life control (dichotomized into 0 ≤ 2 and > 2–6), MPI affective distress (dichotomized into dichotomized into 0 ≤ 2 and > 2–6), and MPI support (dichotomized into 0 ≤ 2 and > 2–6), Variables that had a p-value < 0.3 in the univariate regression analyses were then included in the stepwise multiple regression analyses. The results of the logistic regression analyses are presented as an odds ratio (OR). The reliability of the OR is expressed as a 95% confidence interval (CI). Statistical significance was set at p < 0.05 for the multiple regression analyses.
RESULTS
The study initially included 296 consecutive patients at our Pain Rehabilitation Clinic. They were allocated to either a rehabilitation plan (n = 220) or a multimodal rehabilitation programme (n = 76). Ten patients in the RP group and one patient in the MMR group did not respond to the first questionnaire and were therefore excluded (non-respondents). Both questionnaires, the first 1 at the 2-day interdisciplinary assessment and the second questionnaire at the 1-year follow-up, regarding MPI were answered by 145 patients in the RP group and by 51 patients in the MMR group. As regards sick leave data, an additional 5 patients did not respond at 1-year follow-up. In total, 140 patients in the RP group and 51 patients in the MMR group answered the questions regarding sick leave, both at baseline and at 1-year follow-up (Fig. 1).
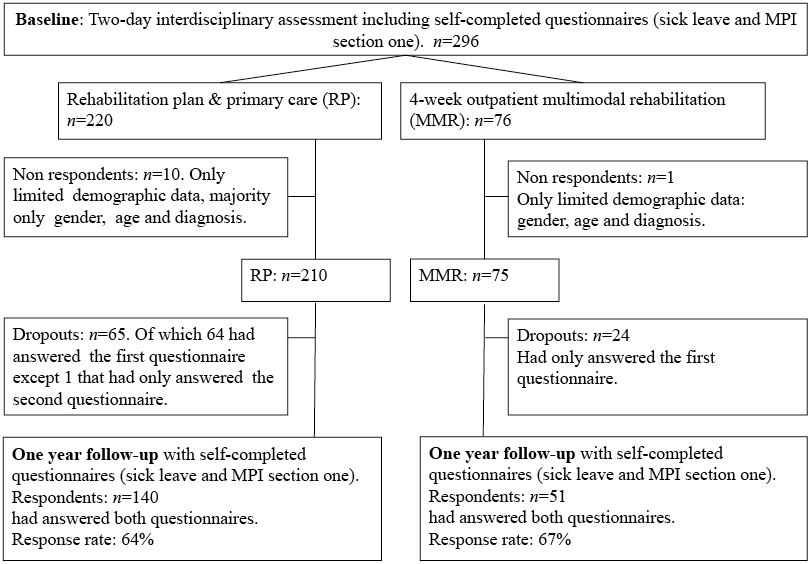
Fig. 1. Flow of patients at assessment and at 1-year follow-up. MPI: Multidimensional Pain Inventory; RP: rehabilitation plan; MMR: multimodal rehabilitation.
Comparisons at baseline between the RP group and MMR groups
The MMR group had a significantly more positive outlook regarding “How convinced are you about recovery?” (p = 0.008) and “When do expect to return to work, to study, or to extend your working hours?” (p = 0.008) (Table I).
|
Table I. Comparison between rehabilitation plan (RP) and multimodal rehabilitation (MMR) programme at baseline. Mean (standard deviation; SD) if not stated otherwise. p-value < 0.01 considered as significant, but p-values between 0.01 and 0.05 are also displayed |
|||||
|
RP |
MMR |
p-value |
|||
|
n |
n |
||||
|
Demographic characteristics Age, years, mean (SD) Gender, females % Education, % Primary Secondary school University Job status, % Employed Unemployed Students Others Pain condition characteristics Pain now, VAS mm, mean (SD) Years with chronic pain, years, mean (SD) How convinced are you about recovery?, % 1–3: positive outlook 4–5: negative outlook How do you envisage, it will be to return to work, to study, or to extend working hours?, % 1–3: very easy 4–5: very difficult When do you expect to return to work, to study, or to extend your working hours?, % 1–3: as soon as possible 4–5: never DRI index, mm, mean (SD) |
210 210 205 207 209 172 198 183 170 209 |
38.9 (10.5) 62 19.5 63.4 17.1 59.4 26.1 4.3 10.2 61.8 (21.5) 6.2 (6.4) 34.3 65.7 35.5 64.5 47.1 52.9 51.2 (18.3) |
75 75 73 74 74 61 73 66 63 75 |
39.2 (9.7) 76 17.8 58.9 23.3 75.7 14.9 4.1 5.5 58.3 (20.7) 5.2 (5.0) 52.1 47.9 37.9 62.1 66.7 33.3 45.1 (18.8) |
0.718 0.027 0.504 0.128 0.276 0.372 0.008 0.564 0.008 0.019 |
|
DRI: Disability Rating Index |
|||||
Follow-up in the RP group and MMR groups regarding work status
The patients on full-time sick leave, part-time sick leave and no sick leave were dichotomized into sick leave (full-time or part-time) vs no sick leave. Both the MMR group and the RP group improved significantly at 1-year follow-up regarding being on “no sick leave”, p < 0.001 (see Fig. 2). No significant differences were found regarding work status at baseline between the MMR and the RP group, nor were there any significant differences between the 2 groups over time (Table II).
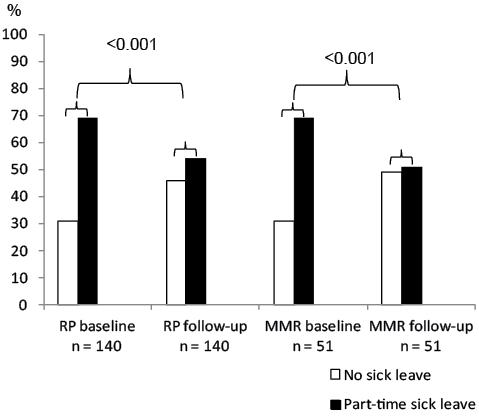
Fig. 2. Work status, in percent, for the rehabilitation plan (RP) and the multimodal rehabilitation (MMR) programme group (n = 191).
|
Table II. Detailed description of sick leave at baseline and follow-up |
||||
|
Work status |
RP group (n = 140) |
MMR group (n = 51) |
||
|
Baseline n |
Follow-up n |
Baseline n |
Follow-up n |
|
|
Full-time sick leave |
62 |
35 |
20 |
12 |
|
Part-time sick leave |
34 |
40 |
15 |
14 |
|
No sick leave, total Employed Students Unemployed Parental leave 100% Parental leave 50% Parental leave 25% Welfare Other Student 50% |
44 32 4 3 1 – – 1 3 – |
65 42 8 6 2 1 1 4 1 – |
16 12 1 1 1 – – – – 1 |
25 20 4 – – – – – – 1 |
|
RP: rehabilitation plan; MMR: multimodal rehabilitation. |
||||
Follow-up in the RP group and MMR groups regarding MPI
Both the RP and the MMR groups improved significantly from baseline to follow-up regarding Pain severity (p < 0.001), Interference (p < 0.001) and Support (RP, p < 0.001; MMR, p = 0.003). The MMR group also improved significantly regarding Life control (p < 0.001) and Affective distress (p = 0.003). When comparing differences between the groups over time, significant changes were found for Pain severity (p = 0.001), Interference (p < 0.001) and Affective distress (p = 0.003) in favour of the MMR group (Table III).
Comparisons of men and women in the RP group and MMR groups regarding MPI
Both women and men improved significantly over time in the RP group: the women regarding 3 scales: Pain severity (p < 0.001), Interference (p = 0.002), and Support (p = 0.001); the men regarding 1 scale: Support (p < 0.001). Only women scored significant changes over time in the MMR group, regarding Pain severity (p < 0.001), Interference (p = 0.001), Life control (p = 0.001), Affective distress (p = 0.005) and Support (p = 0.006). The men in the MMR group (n = 7) did not improve significantly at 1-year follow-up. In both the RP and the MMR groups, there were no significant gender differences at baseline, nor were there any significant differences over time between men and women (Table III).
|
Table III. Multidimensional pain inventory part one |
||||||||||
|
RP |
MMR |
|||||||||
|
n |
Baseline Mean (SD) |
Follow-up Mean (SD) |
Within RP differences p-value |
n |
Baseline Mean (SD) |
Follow-up Mean (SD) |
Within MMR differences p-value |
RP vs MMR p-value |
||
|
Comparison within rehabilitation plan and multimodal rehabilitation programme and between the groups |
||||||||||
|
Pain severity Interference Life control Affective distress Support |
145 145 144 145 145 |
4.3 (0.9) 4.3 (1.1) 2.9 (1.2) 3.0 (1.5) 4.3 (1.3) |
3.9 (1.2) 3.9 (1.4) 3.1 (1.2) 3.0 (1.4) 3.8 (1.2) |
< 0.001 < 0.001 0.015 0.982 < 0.001 |
51 51 51 51 51 |
4.3 (0.9) 4.4 (0.9) 3.0 (0.8) 3.3 (1.2) 4.3 (1.3) |
3.1 (1.3) 3.3 (1.5) 3.1 (1.2) 2.5 (1.5) 3.9 (1.3) |
< 0.001 < 0.001 < 0.001 0.003 0.003 |
0.001 < 0.001 0.021 0.003 0.688 |
|
|
♀ RP |
♂RP |
|||||||||
|
n |
Baseline Mean (SD) |
Follow-up Mean (SD) |
Within ♀ differences p-value |
n |
Baseline Mean (SD) |
Follow-up Mean (SD) |
Within ♂ differences p-value |
♀ vs ♂ at baseline p-value |
♀ vs ♂ over time p-value |
|
|
Comparison within and between women and men in the RP group |
||||||||||
|
Pain severity Interference Life control Affective distress Support |
95 95 95 95 95 |
4.3 (0.9) 4.2 (1.2) 2.9 (1.2) 2.9 (1.5) 4.1 (1.4) |
3.9 (1.2) 3.9 (1.4) 3.2 (1.2) 3.0 (1.4) 3.7 (1.3) |
< 0.001 0.002 0.016 0.362 0.001 |
50 50 50 50 50 |
4.3 (0.9) 4.4 (0.9) 2.9 (1.2) 3.3 (1.4) 4.7 (0.8) |
4.0 (1.2) 4.0 (1.3) 3.0 (1.2) 3.0 (1.4) 4.0 (1.0) |
< 0.001 0.018 0.442 0.367 < 0.001 |
0.651 0.707 0.759 0.123 0.025 |
0.700 0.944 0.299 0.927 0.135 |
|
♀ MMR |
♂ MMR |
|||||||||
|
n |
Baseline Median (range) |
Follow-up Median (range) |
Within ♀ differences p-value |
n |
Baseline Median (range) |
Follow-up Median (range) |
Within ♂ differences p-value |
♀ vs ♂ at baseline p-value |
♀ vs ♂ over time p-value |
|
|
Comparison within and between women and men in the MMR group |
||||||||||
|
Pain severity Interference Life control Affective distress Support |
44 44 44 44 44 |
4.2 (4.3) 4.3 (4.4) 3.1 (3.2) 3.1 (4.7) 4.8 (4.7) |
3.3 (5.0) 3.5 (5.3) 3.6 (4.5) 2.2 (5.6) 4.0 (6.0) |
< 0.001 < 0.001 0.001 0.005 0.006 |
7 7 7 7 7 |
4.7 (1.0) 4.5 (2.0) 2.5 (2.0) 3.3 (2.3) 3.7 (4.0) |
4.0 (3.7) 4.0 (3.3) 3.7 (4.5) 2.5 (4.7) 3.9 (3.3) |
0.180 0.043 0.235 0.236 0.233 |
0.424 0.886 0.727 0.658 0.931 |
0.198 0.658 0.564 0.412 0.779 |
|
RP: rehabilitation plan; MMR: multimodal rehabilitation; SD: standard deviation. |
||||||||||


Life satisfaction in the general population and in the RP group and MMR groups
Fig. 3 presents the life satisfaction domain scores of “vocational health” in a representative section of the general adult Swedish population (30) (n = 2,553) together with the satisfied patients in the RP (n = 139) and MMR (n = 50) groups at baseline and follow-up.
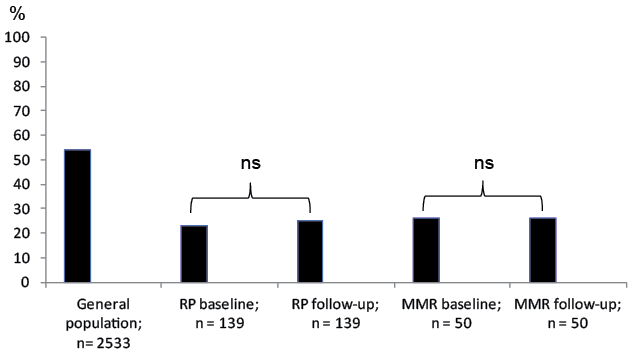
Fig. 3. Vocational health among the general population in Sweden (30), rehabilitation plan (RP) and the multimodal rehabilitation (MMR) programme group. ns: not significant.
More than half of the Swedish population (54%) consider themselves to be satisfied regarding the domain “vocational health”. The RP group was less satisfied at baseline (23%), but increased slightly in satisfaction at follow-up (25%), although not reaching the levels of the general population.
The MMR group was also less satisfied compared with the general population concerning “vocational health” at baseline (26%) and stayed on the same level at follow-up (26%).
Univariate logistic regression and stepwise multivariate analyses
Univariate logistic regression analyses were performed and in the first calculation, all patients were included. The dependent factor was “not being on sick leave” at 1-year follow-up. The significant variables in the univariate analyses were analysed in a stepwise multiple regression analysis (Table IV). In the multiple logistic regression analyses, only “positive expectation about work” was associated with no sick leave at 1-year follow-up.
|
Table IV. Univariate logistic regression and stepwise multivariate analyses |
||||
|
Covariates |
n |
OR (95% CI) |
p-value |
Dependent |
|
Logistic regression for all patients Patients’ vision about work Patients’ expectation about work Patients’ belief about recovery DRI index VAS Pain Intensity Age MPI Interference MPI Support Covariates used in the multiple logistic regression Multiple logistic regression Patients’ expectation about work |
170 160 182 185 191 191 191 191 154 |
2.80 (1.46–5.37) 3.08 (1.60–5.95) 2.11 (1.14–3.92) 0.51 (0.27–0.96) 0.44 (0.24–0.79) 0.40 (0.22–0.71) 0.27 (0.10–0.72) 0.54 (0.24–1.19) 3.0 (1.54–5.85) |
0.002 0.001 0.017 0.006 0.037 0.002 0.009 0.13 0.001 |
Being on no sick leave
Being on no sick leave |
|
OR: odds ratio; CI: confidence interval; MPI: Multidimensional Pain Inventory; VAS: visual analogue scale. |
||||
When we analysed women and men separately, the stepwise multiple regression analyses (Table V) revealed that, for women, the variable “positive expectation about work” was associated with no sick leave at 1-year follow-up, while, for men, the variable “low disability level” was linked to no sick leave at 1-year follow-up.
|
Table V. Univariate regression and stepwise multivariate analyses |
||||
|
Covariates |
n |
OR (95% CI) |
p-value |
Dependent |
|
Logistic regression for women Patients’ vision about work Patients’ expectation about work Patients’ belief about recovery DRI index VAS Pain Intensity Age MPI Interference MPI Life Control MPI Support Covariates used in the multivariate logistic regression Multiple logistic regression Patients’ expectation about work Logistic regression for men Patients’ vision about work Patients’ belief about recovery DRI index Age Covariates used in the multivariate logistic regression Multiple logistic regression DRI index |
124 118 128 133 136 136 136 136 136 114 46 54 52 55 51 |
3.19 (1.48–6.90) 3.56 (1.64–7.72) 1.88 (0.92–3.86) 0.49 (0.25–0.98) 0.48 (6.23–1.011) 0.38 (0.19–0.76) 0.24 (0.083–0.72) 1.67 (0.85–3.30) 0.50 (0.21–1.17) 3.64 (1.66–7.94) 2.0 (0.58–6.91) 3.2 (0.92–11.20) 0.33 (0.11–1.034) 0.45 (0.15–1.32) 0.30 (0.010–1.01) |
0.003 0.001 0.086 0.044 0.053 0.006 0.010 0.143 0.108 0.001 0.27 0.069 0.057 0.15 0.039 |
Being on no sick leave
Being on no sick leave Being on no sick leave Being on no sick leave |
|
CI: confidence interval; MPI: Multidimensional Pain Inventory; VAS: visual analogue scale. |
||||
DISCUSSION
The present study shows that the number of patients on sick leave decreased significantly both in the MMR group and in the RP group at follow-up after 1 year. In the multivariate analyses of all patients, only the factor “positive expectation about work” was singled out as being associated with no sick leave at follow-up. The results in the MMR group confirm previous research that multimodal rehabilitation improves the potential for chronic pain patients to decrease sick leave/increase a return to work (15, 16, 31–33). Recently, Busch et al. (34) reported that these effects were stable over 10 years. The MMR programme in the present study was based on a cognitive behavioural approach, a concept that has been shown to be essential in MMR for effective sick leave reduction (35, 36). In a previous study, Linton et al. (36) showed better results as regards sick leave in different MMR groups compared with a group with minimal treatment. However, all groups improved at follow-up after 1 year. Minimal treatment included medical examination, information and explanation regarding pain diagnosis. These components were included in our 2-day interdisciplinary assessment and, together with the assessment of the patients’ work capacity and recommendations in the rehabilitation plans, may have contributed to the results in the RP group. Moreover, the close collaboration with the referring general practitioners who attended the team conference on the second day of the assessment (or participated by phone) made it possible to ensure that the rehabilitation plans would be monitored.
Most studies of sick leave after rehabilitation of patients with chronic pain have focused on MMR (15, 16, 31–33) and less is known about the effects of a structured team assessment. Norrefalk et al. (37) made an attempt to evaluate a multi-professional assessment and reported decreased sick leave after 1 year. However, the assessment period was longer (1–2 weeks) than in our study.
Patients’ own expectations have been found to be a strong predictive factor for reduced sick leave and return to work (38, 39). It was therefore not surprising that the patients’ positive expectation about work was a predictive factor for not being on sick leave at follow-up in the present study. Pre-treatment expectations of rehabilitation outcome may differ between men and women. In a Dutch study of pre-treatment expectations of rehabilitation outcome, men were more likely than women to expect that the cause of the pain would be found (40). Thus, if this expectation was fulfilled, it might lead to the pain condition being treated, but on the other hand waiting for a diagnosis could result in patients not taking an active part in rehabilitation. In our study, low disability level was associated with not being on sick leave for men, while a positive expectation about work was linked to not being on sick leave at follow-up after 1 year for women. These findings may be due to different gender roles, but also to factors such as coping and compliance with the rehabilitation interventions (41). Psychosocial factors at work as well as in private life have been shown to be of importance in preventing long-term disability and sick leave (42, 43). Slightly more patients in the MMR group were satisfied with their vocational health compared with the RP group, which may reflect the occupational situation with a higher proportion of employed patients in the MMR group. However, compared with the general population (30), patients in both groups rated their satisfaction with vocational health on the LiSat-11 clearly lower both at baseline and at follow-up. Even though the work status increased after the rehabilitation interventions, the patients’ chronic pain condition may have affected their vocational health.
We used the MPI to measure different dimensions of the chronic pain condition. The MMR group improved on all 5 MPI scales at follow-up, which is in accordance with Nyberg et al. (44), who, on the basis of SQRP national data from 13 pain rehabilitation clinics, reported improvements in most MPI scale scores in patients 1 year after completing a pain rehabilitation programme. Although patients in the RP group did not reach these results, they improved on some of the scales. The MPI scales that improved most both in the MMR and the RP groups were the Interference and the Pain severity scales. These scales have been shown to be predictors of having no or part-time sick leave 1 year after multimodal pain rehabilitation (44). However, in our univariate regression analysis, only the Interference scale was significantly associated with not being on sick leave. When men and women were analysed separately, the same result was shown for women, while no relationship was found between the MPI scales and sick leave for men. Moreover, in line with a previous study from our clinic, we did not find any significant differences between men and women when the scores on the MPI scales were compared (9).
Some limitations of the study should be noted. In this study general practitioners referred the patients to a specialist pain rehabilitation clinic because of chronic musculoskeletal pain. Thus, the patients represent a selected group with more severe or complex consequences of pain than patients being treated in primary care. While this study was conducted in a clinical setting and the focus was on the interdisciplinary assessment and the long-term results of the 2 interventions, patients were not randomly selected. The strengths of the study are that we included all patients that underwent a team assessment at our clinic during 1 year and the response rate in each group was high. Moreover, all instruments have been widely used and have shown good validity and therefore are included in the SQRP quality registry. However, for questions included in the SQRP, such as “Patients’ thoughts about the future”, content validity was ensured by consensus of an expert group of specialists in rehabilitation medicine. Although it is not mandatory to answer the questionnaires included in the SQRP, most patients answered the first questionnaire at the assessment. The number of drop-outs was higher in the RP than in the MMR group, but the response rate after 1 year was more or less the same in both groups. This was an unexpected finding, since the RP patients had only been at the clinic for 2 days, while the MMR patients had probably established stronger relationships with both the staff and the other patients during their 4 weeks of participating in the MMR. This may have had a positive effect on the response rate. The inclusion criteria for the MMR were relatively wide and the professionals in the assessment team had to decide, using a biopsychosocial approach, whether the patient was suitable for the multimodal rehabilitation programme or if the patient should undergo a rehabilitation plan in primary care. Therefore, we cannot rule out that there may have been a selection bias that affected the 2 groups. At the assessment, there was a significant difference between the RP and the MMR groups regarding the patients’ expectations about recovery. Although the patients’ own expectations and a positive outlook have been found to be related to more positive results (38), it seems reasonable to assume that aspects of placebo and expectation bias may have influenced the results in our study.
In accordance with Linton et al. (36) we used self-reporting for measuring sick leave. Although there are studies that have established the validity of self-reporting, there are still measurement errors with self-report measures influenced by memory and other factors. However, Linton et al. (36) pointed out that there is also a risk of missing information when relying on “objective “reports such as the Swedish Social Insurance Agency since only sick leave of more than 15 consecutive days is recorded.
Moreover, in all countries there are factors other than rehabilitation that can influence sick leave and the success of return to work. Since changes to the social insurance system regarding sick leave in Sweden were introduced by the government during the follow-up in our study, we cannot rule out that these factors have influenced the results.
In conclusion, an interdisciplinary team assessment followed by a multimodal rehabilitation programme or a less intense intervention in primary care may decrease levels of sick leave.
REFERENCES

