Matthias Bethge, PhD1,2, Friedrich Michael Radoschewski, MD2 and Christoph Gutenbrunner, MD1
From the 1Department for Rehabilitation Medicine, Coordination Centre for Applied Rehabilitation Research, Hannover Medical School, Hannover and 2Department of Health Care Research and Quality Management in Rehabilitation, Charité – Universitätsmedizin Berlin, Berlin, Germany
OBJECTIVE: To evaluate the predictive value of the Work Ability Index (WAI) for different indicators of the need for rehabilitation at 1-year follow-up.
DESIGN: Cohort study.
METHODS: Data were obtained from the Second German Sociomedical Panel of Employees, a large-scale cohort study with postal surveys in 2009 and 2010.
RESULTS: A total of 457 women and 579 men were included. Confirmatory factor analysis confirmed the one-dimensionality of the WAI. Regression analyses showed that poor and moderate baseline WAI scores were associated with lower health-related quality of life and more frequent use of primary healthcare 1 year later. Subjects with poor baseline work ability had 4.6 times higher odds of unemployment and 12.2 times higher odds of prolonged sick leave than the reference group with good or excellent baseline work ability. Moreover, the odds of subjectively perceived need for rehabilitation, intention to request rehabilitation and actual use of rehabilitation services were 9.7, 5.7 and 3 times higher in the poor baseline WAI group and 5.5, 4 and 1.8 times higher in the moderate baseline WAI group, respectively. A WAI score ≤ 37 was identified as the optimal cut-off to predict the need for rehabilitation.
CONCLUSION: The WAI is a valid screening tool for identifying the need for rehabilitation.
Key words: cohort study; Work Ability Index; screening; rehabilitation.
J Rehabil Med 2012; 00: 00–00
Correspondence address: Matthias Bethge, Department for Rehabilitation Medicine, Coordination Centre for Applied Rehabilitation Research, Hannover Medical School, Carl-Neuberg-Straße 1, DE-30625 Hannover, Germany. E-mail: bethge.matthias@mh-hannover.de
Submitted January 17, 2012; accepted July 10, 2012
INTRODUCTION
Rehabilitation is 1 of 4 general health strategies (prevention, cure, rehabilitation and support) (1). It is effective in improving the work ability of persons with chronic diseases and disabilities across a range of health-related problems (2). Social insurance agencies in many Western countries therefore offer rehabilitation services to prevent health-related early retirement and to support participation in working life for persons who temporarily lose all or some of their work ability and can be expected to return to work after rehabilitation. The importance of rehabilitation as a major health strategy will increase as a result of the challenges of population ageing and the integration of elderly workers into the workforce despite chronic illness (1).
However, in many cases, the reduction in work ability and the associated need for rehabilitation does not lead to utilization of rehabilitation services. In Germany, 59.3% of all male pensioners and 52.3% of all female pensioners with disabilities did not use medical rehabilitation services before their health-related early retirement (3). These figures point to a latent need for rehabilitation that does not translate into actual use of services. Major barriers to access (i.e. factors that prevent persons from utilizing rehabilitation when needed) include personal and environmental factors, or, in most cases, a combination of these factors. In Germany, persons in need must actively and formally request rehabilitation services. Insufficient information policy by social insurance agencies and a lack of appropriate counselling by general practitioners may hinder patients who are in need of rehabilitation from utilizing these health services. Patients with low incomes may be particularly affected by this problem. International research suggests that these individuals obtain care in lower quality facilities that have more difficulties coordinating continuity of care (4). Moreover, population surveys and surveys of general practitioners indicate that persons in need often refrain from requesting rehabilitation due to precarious and insecure working conditions and fear of job loss (5, 6).
The development of new access paths to rehabilitation was therefore identified as a major challenge for rehabilitation research (7). Recent research in Germany focuses on the use of register data from sickness insurance companies and pension insurance agencies to screen for patients in need of rehabilitation (8, 9). Other studies emphasize the importance of primary care actors and occupational physicians as gatekeepers to rehabilitation in a strongly segmented healthcare system (6, 10). However, these actors need valid work ability assessments enabling them to recommend rehabilitation services. The availability of valid assessments is especially important for general practitioners. Recent studies have shown that primary care physicians report a lack of competence in this area (11). Assessment instruments with a high degree of validity for measurement of work ability are needed as decision aids to support these actors in the process of work ability management. Although a variety of complex methods exists for assessing work ability in different settings (12), only a few allow for quick screening and are therefore suitable for continuous and repeated use.
One of these is the Work Ability Index (WAI), which is based on the work ability concept of Ilmarinen and colleagues from the Finnish Institute of Occupational Health (13). They described work ability as the interaction of individual determinants (health, competence and attitudes) and the work environment. The theoretical basis of Ilmarinen et al.’s concept of work ability is the stress-strain model, which emphasizes the importance of the interaction of individual and environmental determinants of work ability. This makes it compatible with the notion of functioning defined by the International Classification of Functioning, Disability and Health (ICF), which is the reference system for the present concept of rehabilitation (1). The WAI enables the user to assess the degree to which workers consider their state of health adequate to cope with their job demands (see Methods). The WAI yields a continuous score ranging from 7 to 49 points, where higher scores indicate better work ability. WAI scores can be categorized into excellent (44–49 points), good (37–43 points), moderate (28–36 points) and poor work ability (7–27 points). Finally, the authors of the WAI linked these categories with the different activities necessary, and recommended suitable measures to maintain, support, improve or restore work ability (14).
According to German social security legislation, the challenges of improving and restoring work ability imply a need for medical rehabilitation, which falls under the responsibility of the German Pension Insurance Fund (GPIF). This generally involves a 3-week stay in an inpatient rehabilitation centre and includes the opportunity for outpatient aftercare and graded return-to-work. Although the WAI and the need for rehabilitation are theoretically linked, there is no evidence from cohort studies that the German version of the WAI is able to predict rehabilitation-related problems and the need for rehabilitation. The aim of the present study was therefore to determine the prognostic value of the WAI for different indicators of the need for rehabilitation and need-related characteristics (health-related quality of life, primary healthcare utilization, indicators of participation in working life) and to derive a WAI cut-off score that best defines the need for rehabilitation.
METHODS
Setting and participants
Data were obtained from the Second German Sociomedical Panel of Employees (GSPE-II). Like its predecessor GSPE-I (15), the GSPE-II is a large-scale cohort study designed to identify environmental and personal risk factors affecting work ability and participation in working life. For the GSPE-II, 3,750 women and 3,750 men aged 45–59 years were selected randomly from the register of the federal GPIF. Baseline and follow-up data were collected by postal surveys in 2009 and 2010. In both cases, one reminder was sent to persons who did not respond within 4 weeks. Only those participants who explicitly consented to follow-up were contacted one year later. The study was approved by the data protection commissioner of the GPIF.
Work Ability Index
Work ability was assessed using the German version of the WAI questionnaire (14), which contains the following 7 items: (i) current work ability compared with lifetime best; (ii) work ability in relation to the demands of the job; (iii) number of current diseases diagnosed by a physician; (iv) estimated work impairment due to diseases; (v) sick leave during the past year; (vi) own prognosis of work ability two years from now; and (vii) mental resources.
The test-retest reliability of the WAI was found to be consistent (16). Moreover, several studies have confirmed that a poor WAI rating predicts productivity loss at work, retirement intentions, long-term sickness absence and early retirement (17–23).
Dependent variables
Health-related quality of life and healthcare utilization. Health-related quality of life (HRQoL) was measured using the 8 scales of the Medical Outcomes Study 36-Item Short-Form Health Survey (24). Physical HRQoL was assessed using the physical functioning, physical role, bodily pain and general health perception scales. Mental HRQoL was assessed using the vitality, social functioning, emotional role and mental health scales. Item scores of the multi-item scales were summed, averaged and transformed into values ranging from 0 to 100, with higher values indicating better mental or physical HRQoL. The level of healthcare utilization was assessed by asking the respondents how often they had visited 8 different types of physicians (including general practitioners) in the last 12 months. Physician visits were summed to yield a total score. The number of hospital days in the last 12 months was also assessed.
Activity and participation in working life. Activity and participation in working life were measured using the following indicators: employment status (employed vs unemployed), sick leave between the first and second survey (≤ 6 weeks vs > 6 weeks), retirement intention (no vs yes), and degree of disability (< 50 vs ≥ 50). The degree of disability describes the consequences of disability on participation on a range from 0 to 100 and enables entitlement to disability benefits, amongst others dismissal protection, additional holidays and tax release.
Need for rehabilitation. The need for rehabilitation due to health-related reduction in work ability exists if rehabilitation can be expected to achieve its defined normative goal of improving the affected person’s work ability (25). As there is still no gold standard for assessing the need for rehabilitation by questionnaires, we used the following 3 proxy measures, which are strongly related to, yet distinct from, an evidenced-based definition of the need for rehabilitation: subjectively perceived need for rehabilitation; intention to request rehabilitation within the next 12 months; and actual use of rehabilitation services between the first and second survey.
Data analyses
Confirmatory factor analysis (CFA) was used to test whether the proposed one-factor model of the WAI fitted the data (26). We calculated the Goodness of Fit Index (GFI), the Normed Fit Index (NFI) and the Comparative Fit Index (CFI). These indices yield values ranging from 0 to 1, whereby values close to 1 are indicative of good fit and those greater than 0.90 or, better, 0.95 generally indicate satisfactory fit (26). Cronbach’s alpha was calculated to assess internal consistency among items. In addition, we calculated rank-biserial correlations for binary measures and Spearman’s rho for continuous measures to describe crude associations between baseline WAI categories and dependent follow-up variables. Linear and logistic regression models were used to estimate the longitudinal impact of the baseline WAI categories on the dependent follow-up variables after adjusting for baseline scores of the dependent variables. Subjects with good or excellent baseline WAI ratings were combined to form the reference group in these models. Statistical differences were regarded as significant if the two-sided p-value of the test was less than 0.05. For further analyses of the predictive value of the continuous WAI score for the different indicators of need for rehabilitation, receiver operating characteristic curves (ROC curves) were constructed and the areas under the curve (AUC) were determined. The AUC represents the probability that a randomly selected person in need of rehabilitation will have a lower WAI score than a randomly selected person without the need for rehabilitation. Values greater than 0.5 indicate that prediction is better than chance (27). Sensitivity, specificity and Youden’s Index J with J = sensitivity + specificity – 1 were calculated for each WAI score (28). The cut-off score associated with the highest J was considered to represent the optimal cut-off to predict the need for rehabilitation. AMOS 19 was used for confirmatory factor analysis. All other calculations were performed with SPSS 19.
RESULTS
Participants
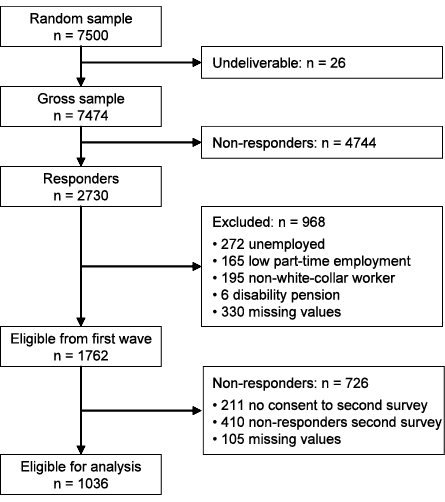
During the first survey, 7,500 questionnaires were posted, 26 of which were returned as undeliverable. A total of 2,730 valid questionnaires were returned, corresponding to a response rate of 36.5%. Data on the gender and age of non-responders were obtained from the GPIF registers. Responders and non-responders did not differ in terms of age and gender (responders: 51.5 years (standard deviation (SD) 4.3); female: 51.1%; non-responders: 51.3 years (SD 4.3); female: 49.4%). Only white-collar workers with at least half-time employment in the first survey were included in the longitudinal analysis. Respondents who were unemployed (n = 272) or working less than half-time (n = 165) were excluded. As the GPIF is mainly responsible for white-collar workers, we also excluded the small proportion of non-white-collar respondents (n = 195) to attain a more homogeneous sample. Six persons already receiving disability pensions (n = 6) were also excluded. Another 330 participants were excluded because of missing data for one of the baselines variables. Of the 1,762 remaining respondents, 1,551 (88.0%) consented to participate in the follow-up survey 1 year later. A total of 1,141 (73.6%) participants responded to the second questionnaire, 105 of whom were excluded because of missing data for a dependent variable. Thus, 1,036 persons (457 women and 579 men) were included in the longitudinal analysis (Fig. 1).
Fig. 1. Participants in the Second German Sociomedical Panel of Employees.
Baseline and follow-up sample characteristics
Mean age at baseline was 50.9 years (SD 4.1) for follow-up responders. Of these, 44.1% were female. Mean work ability score was 38.7 (SD 7.1). Work ability was good or excellent in 69.6%, moderate in 22.2%, and poor in 8.2% of respondents. Baseline characteristics of the follow-up responder and non-responder populations (including persons excluded because of missing follow-up data) are shown in Table I. Non-responders to the follow-up survey had lower HRQoL and work ability scores at baseline, but the differences were small.
|
Table I. Baseline characteristics of follow-up responders and non-responders (n = 1,762) |
||
|
|
Responders n = 1,036 |
Non-responders n = 726 |
|
Age, years, mean (SD) |
50.9 (4.1) |
51.2 (4.1) |
|
Gender, % female |
44.1 |
45.3 |
|
Work Ability Index, mean (SD) |
38.7 (7.1) |
37.6 (7.5) |
|
Physical function, mean (SD) |
89.0 (15.7) |
86.2 (18.5) |
|
Physical role, mean (SD) |
85.1 (28.9) |
79.5 (34.0) |
|
Pain, mean (SD) |
76.2 (25.3) |
72.5 (27.6) |
|
General health, mean (SD) |
67.5 (18.1) |
64.7 (20.0) |
|
Vitality, mean (SD) |
60.2 (18.8) |
57.9 (19.9) |
|
Social functioning, mean (SD) |
83.9 (22.2) |
81.1 (23.6) |
|
Emotional role, mean (SD) |
83.5 (31.1) |
81.6 (33.6) |
|
Mental health, mean (SD) |
72.3 (17.7) |
69.5 (19.0) |
|
Hospital days, mean (SD) |
0.9 (4.4) |
0.9 (5.3) |
|
Physician visits, mean (SD) |
6.4 (8.4) |
7.7 (11.5) |
|
Sick leave, % > 6 weeks |
5.3 |
6.5 |
|
Retirement intention, % yes |
3.9 |
5.9 |
|
Degree of disability, % ≥ 50 |
4.9 |
6.6 |
|
Perceived need for rehabilitation, % yes |
16.4 |
18.9 |
|
Intention to request for rehabilitation, % within 12 months |
9.5 |
13.1 |
|
Former utilization of rehabilitation, % yes |
29.0 |
31.5 |
|
SD: standard deviation. |
||
At 1-year follow-up, 4.4% of the participants were unemployed, 4.7% had taken more than 6 weeks of sick leave since the first survey, 4.1% expressed health-related early retirement intentions, and 5.8% reported a certified disability of at least 50%. Concerning the evaluated indicators of the need for rehabilitation, 16.4% of follow-up responders expressed a perceived need for rehabilitation, 10.8% intended to request for rehabilitation within the next 12 months, and 6.9% had used rehabilitation services since the first survey.
Crude associations between baseline WAI categories and follow-up measures of HRQoL ranged from ρ = 0.40 to ρ = 0.53. Better baseline WAI categories were associated with lower healthcare utilization (hospital days: ρ = –0.18; physician visits: ρ = –0.53). Rank-biserial correlations between baseline WAI categories and follow-up measures of participation in working life ranged from rrbc = –0.20 to rrbc = –0.71, and those between baseline WAI categories and follow-up measures of need for rehabilitation ranged from rrbc = –0.25 to rrbc = –0.57. Follow-up characteristics and crude associations between baseline WAI categories and follow-up dependent variables are shown in Table II.
|
Table II. Follow-up sample characteristics in 2010 (n = 1,063) |
||||||
|
|
Work Ability Index in 2009 |
Total n = 1,036 |
r |
p |
||
|
Poor n = 85 |
Moderate n = 230 |
Good/excellent n = 721 |
||||
|
Physical function, mean (SD) |
63.6 (27.6) |
79.7 (17.5) |
93.1 (10.6) |
87.7 (17.0) |
0.49 |
0.000 |
|
Physical role, mean (SD) |
38.5 (37.9) |
65.8 (37.7) |
92.1 (20.7) |
81.9 (31.8) |
0.50 |
0.000 |
|
Pain, mean (SD) |
44.8 (28.7) |
59.5 (25.6) |
83.9 (19.8) |
75.3 (25.8) |
0.48 |
0.000 |
|
General health, mean (SD) |
41.8 (19.9) |
53.7 (17.5) |
73.3 (14.2) |
66.4 (19.0) |
0.53 |
0.000 |
|
Vitality, mean (SD) |
35.5 (17.7) |
47.1 (16.7) |
65.9 (15.0) |
59.2 (18.8) |
0.53 |
0.000 |
|
Social functioning, mean (SD) |
52.4 (26.0) |
70.9 (23.1) |
91.1 (15.9) |
83.4 (22.4) |
0.53 |
0.000 |
|
Emotional role, mean (SD) |
42.7 (44.4) |
69.1 (38.9) |
90.7 (23.4) |
81.9 (33.0) |
0.40 |
0.000 |
|
Mental health, mean (SD) |
50.3 (20.6) |
60.9 (19.4) |
77.5 (14.0) |
71.6 (18.5) |
0.47 |
0.000 |
|
Hospital days, mean (SD) |
3.5 (16.7) |
1.4 (5.9) |
0.5 (2.6) |
0.9 (6.0) |
–0.18 |
0.000 |
|
Physician visits, mean (SD) |
17.5 (17.6) |
10.0 (8.9) |
4.2 (5.5) |
6.6 (9.0) |
–0.53 |
0.000 |
|
Employment status, % unemployed |
14.1 |
3.9 |
3.5 |
4.4 |
–0.20 |
0.000 |
|
Sick leave, % > 6 weeks last 12 months |
25.9 |
6.5 |
1.7 |
4.7 |
–0.55 |
0.000 |
|
Retirement intention, % yes |
21.2 |
9.1 |
0.4 |
4.1 |
–0.71 |
0.000 |
|
Degree of disability, % ≥ 50 |
20.0 |
10.0 |
2.8 |
5.8 |
–0.42 |
0.000 |
|
Perceived need for rehabilitation, % yes |
54.1 |
36.5 |
5.5 |
16.4 |
–0.57 |
0.000 |
|
Intended request for rehabilitation, % within 12 months |
35.3 |
22.2 |
4.3 |
10.8 |
–0.50 |
0.000 |
|
Utilization of rehabilitation, % last 12 months |
16.5 |
10.0 |
4.7 |
6.9 |
–0.25 |
0.000 |
|
SD: standard deviation; r: Spearman’s ρ for continuous dependent variables and rank-biserial correlation for binary dependent variables. |
||||||
Factorial structure
Confirmatory factor analysis showed that goodness of fit was close to 0.95 (GFI = 0.957; NFI = 0.946; CFI = 0.950), indicating that the proposed 1-factor model fitted the sample data well. Moreover, Cronbach’s alpha was equal to 0.83, indicating that responses to the WAI sub-dimensions were highly consistent.
Predicting health-related quality of life and healthcare utilization
Adjusted linear regression analyses confirmed consistent associations of the baseline WAI categories and follow-up values of all HRQoL and healthcare utilization scales (Table III). Subjects with moderate baseline work ability scored 17 points lower on the physical role scale than those in the reference group with good or excellent baseline work ability (b = –16.9; 95% confidence interval (95% CI): –21.0 to –12.7), and participants with poor baseline work ability scored 28 points lower (b = –28.4; 95% CI: –35.7 to –21.2). On the emotional role scale, subjects with moderate baseline work ability scored 11 points lower (b = –10.5; 95 CI: –14.8 to –6.2), and those with poor baseline work ability scored 24 points lower (b = –24.0; 95 CI: –30.9 to –17.1) than the reference group. Furthermore, persons with poor baseline WAI ratings reported more hospital days (b = 2.2; 95% CI: 0.8 to 3.5) and more physician visits (b = 6.0; 95% CI: 4.2 to 7.8) between the first and second survey than those in the reference group.
|
Table III. Mean differences of health-related quality of life and healthcare utilization in 2010 from linear regression analyses (n = 1,036) |
||||
|
|
Poor vs good/excellent WAI scores |
Moderate vs good/excellent WAI scores |
||
|
Mean difference (95% CI) |
p |
Mean difference (95% CI) |
p |
|
|
Physical function |
–4.5 (–7.3 to –1.7) |
0.002 |
–2.7 (–4.4 to –1.1) |
0.001 |
|
Physical role |
–28.4 (–35.7 to –21.2) |
0.000 |
–16.9 (–21.0 to –12.7) |
0.000 |
|
Pain |
–14.5 (–19.6 to –9.4) |
0.000 |
–10.1 (–13.4 to –6.8) |
0.000 |
|
General health |
–7.0 (–10.4 to –3.6) |
0.000 |
–5.8 (–7.9 to –3.6) |
0.000 |
|
Vitality |
–10.6 (–14.1 to –7.2) |
0.000 |
–6.8 (–9.0 to –4.5) |
0.000 |
|
Social functioning |
–14.4 (–18.9 to –9.9) |
0.000 |
–8.2 (–11.0 to –5.5) |
0.000 |
|
Emotional role |
–24.0 (–30.9 to –17.1) |
0.000 |
–10.5 (–14.8 to –6.2) |
0.000 |
|
Mental health |
–6.4 (–9.9 to –2.9) |
0.000 |
–5.6 (–7.8 to –3.4) |
0.000 |
|
Hospital days |
2.2 (0.8 to 3.5) |
0.001 |
0.7 (–0.2 to 1.6) |
0.106 |
|
Physician visits |
6.0 (4.2 to 7.8) |
0.000 |
3.2 (2.1 to 4.3) |
0.000 |
|
Mean differences and 95% confidence intervals (CI) are derived from linear regression analyses and adjusted for baseline values of the dependent variables. WAI: Work Ability Index. |
||||

Predicting participation in working life
Adjusted longitudinal associations of baseline WAI categories and indicators of participation in working life are shown in Table IV. After 1 year, persons with poor baseline work ability had 4.6 times higher odds of unemployment (odds ratio (OR) = 4.6; 95% CI: 2.2 to 9.5) and 12.2 times higher odds of prolonged sick leave (OR = 12.2; 95% CI: 5.3 to 28.1). Persons with poor or moderate baseline WAI scores had also higher odds of retirement intentions at follow-up (poor: OR = 19.4; 95% CI: 4.9 to 76.6; moderate: OR = 17.9; 95% CI: 5.1 to 62.8). Moreover, the odds of severe disability were 4.8 times higher for persons with moderate baseline work ability (OR = 4.8; 95% CI: 1.6 to 14.2).

Predicting the need for rehabilitation
Lower baseline WAI category ratings were associated with higher odds of subjectively perceived need for rehabilitation and intention to request rehabilitation 1 year later. Compared with the reference group, the respective odds were 9.7 and 5.7 times higher for persons with poor baseline WAI scores (perceived need: OR = 9.7; 95% CI: 5.4 to 17.5; intended request: OR = 5.7; 95% CI: 3.0 to 10.9) and 5.5 and 4 times higher for those with moderate baseline WAI scores (perceived need: OR = 5.5; 95% CI: 3.5 to 8.7; intended request: OR = 4.0; 95% CI: 2.4 to 6.7). Moreover, the odds of actually using rehabilitation services after the first survey were 1.8 times higher in subjects with moderate baseline WAI scores (OR = 1.8; 95% CI: 1.0 to 3.2) and 3 times higher in those with poor baseline WAI scores (OR = 3.0; 95% CI: 1.5 to 6.0) (Table V).
|
Table V. Odds ratios for indicators of the need for rehabilitation in 2010 from logistic regression analyses |
||||
|
|
Poor vs good/excellent WAI scores |
Moderate vs good/excellent WAI scores |
||
|
OR (95% CI) |
p |
OR (95% CI) |
p |
|
|
9.7 (5.4 to 17.5) |
0.000 |
5.5 (3.5 to 8.7) |
0.000 |
|
|
Intended request |
5.7 (3.0 to 10.9) |
0.000 |
4.0 (2.4 to 6.7) |
0.000 |
|
Utilization |
3.0 (1.5 to 6.0) |
0.002 |
1.8 (1.0 to 3.2) |
0.049 |
|
Odds ratio (OR) and 95% confidence intervals (CI) are derived from logistic regression analyses and adjusted for baseline values of the dependent variables. WAI: Work Ability Index. |
||||

Receiver operating characteristic curves
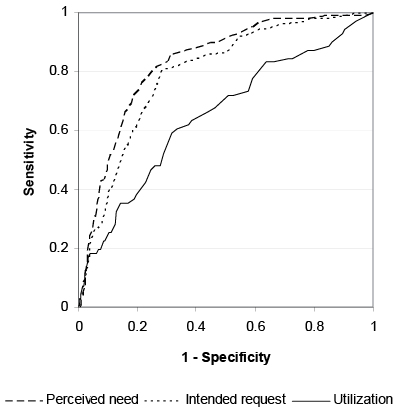
Analyses of the ROC curves confirmed the predictive value of the continuous WAI score, with an AUC equal to 0.834 (95% CI: 0.803 to 0.865) for subjective need and an AUC equal to 0.796 (95% CI: 0.756 to 0.837) for an intended rehabilitation request within the next 12 months (Fig. 2). For actual utilization of rehabilitation services, the AUC was less, but still significantly different from 0.5 (AUC = 0.651; 95% CI: 0.581 to 0.721). All indicators of the need for rehabilitation yielded the highest J value when the cut-off value was ≤ 37 points.
Fig. 2. Receiver operating characteristic curves for ability of the continuous Work Ability Index score in 2009 to predict indicators of the need for rehabilitation in 2010.
DISCUSSION
The results of the present study confirm the one-dimensionality of the WAI and demonstrate that it does have predictive power for participation in working life and subjectively perceived need for rehabilitation. Moreover, we identified the optimal cut-off to predict the need for rehabilitation as a WAI score ≤ 37. This range is nearly identical to that of the WAI ranges for poor (7–27 points) and moderate work ability (28–36 points), for which the WAI developers recommend measures to restore and improve work ability.
The factorial structure of the WAI remains controversial. Some authors question the one-dimensionality of the instrument. Our CFA showed that the one-factor-model of the WAI fits the data well. However, Martus et al. (29), who used CFA to test 4 different factorial models, suggested the use of a two-factor model with correlated factors, allowing subscales 4 and 6 to load on both factors (CFI = 0.97). The one-factor model yielded unsatisfactory fit (CFI = 0.85) in their analyses. However, their small sample consisted of only 4 arbitrary white-collar samples, making the results strongly susceptible to random variation, whereas our results are based on a large random sample. Moreover, our results from a convenient German sample are consistent with those of the cross-national NEXT study that showed one-dimensionality of the WAI at least for the German and the Finnish sample (30). Interestingly, it also showed that a two-dimensional structure was more appropriate for 6 other European samples.
A major goal of our study was to verify the accuracy of the WAI in predicting health-related limitations of work activity and participation, as described by indicators such as HRQoL, utilization of primary healthcare and participation in working life. Several studies have shown cross-sectional associations between the WAI and HRQoL (30–34). However, longitudinal evidence regarding the predictive value of the WAI for HRQoL remains scarce. Ahlstrom et al. (35) reported prospective associations in a sample of women. Our results in a large sample of men and women are in line with these findings and additionally show that the WAI predicts the utilization of primary healthcare.
Some prospective studies have shown the predictive value of the WAI for sickness absence, especially long-term sick leave. One study (36) reported higher odds of sick leave of over two weeks duration in construction workers with less-than-excellent WAI ratings. Kujala et al. (37) found that the WAI predicts long-term sick leave (> 9 days) in young workers with low work ability ratings. Finally, the WAI as well the changed WAI explained sick leave in a sample of female workers on long-term sick leave (35). Our study provides additional evidence that the WAI also has strong predictive value for sick leave in middle-aged and older white-collar workers.
Concerning the prognostic relevance of the WAI for unemployment, disability certification and retirement intention, the findings of our one-year follow-up study are in line with those of other cohort studies reporting that workers with less-than-excellent WAI ratings had higher odds of receiving disability pensions. Alavinia et al. (17) determined that Dutch construction workers with moderate and poor WAI scores had 8 and 32 times higher hazard rates for disability pensions after an average follow-up period of 23 months. In our study, only 1 of the 46 unemployed cases in the second survey already received a disability pension. Given the legal barriers to being granted a disability pension, the follow-up period of 1 year was probably too short to measure a substantial rate of new pension cases in a random sample of still employed persons. However, the fact that our subjects with poor baseline WAI scores had elevated odds of unemployment, retirement intention and disability certification indicates that unemployment could be an intermediate step on the way to being granted a disability pension.
To our knowledge, the GSPE-II is the first cohort study that examined the ability of the WAI in predicting the need for rehabilitation. This was accomplished by using 3 indicators of the need for rehabilitation: subjectively perceived need for rehabilitation, intention to request for rehabilitation with the next 12 months and actual use of rehabilitation services. Predictions of perceived need and an intended request were stronger than those of actual use of rehabilitation services. We presume that the study indicators mark different motivational and volitional phases as described by the Health Action Process Approach (38). Persons with a perceived need for rehabilitation might have not yet developed a request intention, for reasons such as low outcome expectancy, and persons with rehabilitation intentions may be hindered from acting on these intentions because they do not yet know when, where and how to submit a formal rehabilitation request. These considerations suggest that factors others than work ability itself influence whether a person in need will actually obtain access to rehabilitation services. Identifying persons as pre-intenders or intenders would offer an opportunity for specific strategies to support them in gaining access to the services needed.
Several methodological issues have to be considered that mark strengths and limitations of our study. The main strengths of the study are its longitudinal design and a fairly large random sample. Moreover, we adjusted our analyses for baseline scores of the dependent variables in order to estimate the additional predictive value of the baseline WAI. Nevertheless, the study has several limitations. Firstly, the response rate of the first survey was low. Other authors have described such a response rate as reasonable for an anonymous survey in the working population (31). However, we cannot rule out the possibility of bias from selective participation. Although our responders and non-responders did not differ in terms of gender and age, we were unable to investigate the characteristics of the non-responders in depth. Secondly, analysis of follow-up responders and non-responders indicated selective follow-up participation characterized by lower baseline HRQoL and work ability in non-responders, although these differences were small. Thirdly, data on sickness absence, physician visits and hospital days were assessed by self-report. This is also a concern for the WAI items that assess sick leave and number of illnesses. The validity of questionnaire data on healthcare utilization and sick leave is still controversial. A recent study comparing the self-reported amount of sick leave with register data on sick leave showed that there is indeed some bias, but that agreement between self-reported and register data is relatively good. The authors therefore concluded that self-reported data on sickness absence are valuable in epidemiological studies (39). Comparable findings were reported for self-reported and administrative data on healthcare utilization (40). Fourthly, the need for rehabilitation was assessed only by self-report, and it was not evaluated by professionals. Assessing the need for rehabilitation is a complex task that has to consider restrictions, goals, prognosis and the capacity to participate in rehabilitation. The items that we used were associated with HRQoL, sick leave and other health-related outcomes. However, the perceived need for rehabilitation, and the request intentions, probably overestimate the prevalence of persons in need. Utilization of rehabilitation might underestimate it when need for rehabilitation does not lead to a formal rehabilitation request. Further research is needed to explore the concurrent validity of these items. A multidimensional assessment by experienced rehabilitation physicians could probably serve as valid external criterion.
Given the consistency of our results, we conclude that the WAI could support general practitioners and occupational physicians in monitoring work ability and the potential need for rehabilitation in their patients and clients. Moreover, the WAI could enable a strategy of the pension insurance agencies for proactive identification of persons in need of rehabilitation. In this context, we recently proposed a 3-staged screening procedure (9): Screening of register data using a validated risk index in a first step, postal screening with the WAI in case of persons with high-risk index scores in a second step and individual counselling and information in a third step.
In addition, our study provides important suggestions for further epidemiological rehabilitation research. The GSPE-II was initiated to explore the feasibility of conducting rehabilitation-related cohort studies using samples extracted from the registers of the GPIF. Low response rates to the baseline survey indicate that larger sample sizes are needed to establish long-term cohorts. However, the response rate of over 70% to the follow-up survey indicates that sample attrition is manageable if follow-up is limited to persons who have consented to participate. In this context, it seems feasible to establish an access panel of persons who are willing to respond and therefore available for random sampling. Such an access panel could be used as a sampling frame for rehabilitation-related cross-sectional surveys and prospective studies. As we have seen, however, the prevalence of indicators such as long-term sick leave or utilization of rehabilitation services is quite low in random samples. Therefore, future epidemiological research on rehabilitation should also explore the possibility of establishing a panel of high-risk subjects who are likely to use rehabilitation services. This could be done, for example, by using sick leave registers as a sampling frame.
ACKNOWLEDGEMENTS
The GSPE-II and this research have been funded through the German Pension Insurance Fund according to § 31 Abs. 1 Nr. 5 SGB VI. The authors would like to thank Suzyon Wandrey and Juliane Briest for proofreading.
REFERENCES

