OBJECTIVE: Widespread deep tissue pain hyperalgesia was evaluated in women with chronic whiplash associated disorder (n = 25) and controls (n = 10) using computerized cuff pressure algometry and hypertonic saline infusion.
METHODS: A pneumatic double-chamber cuff was placed around: (i) the arm and (ii) the leg. Cuff inflation rate was constant and the pain intensity was registered continuously on a visual analogue scale (VAS); thresholds of detection and tolerance were extracted. For assessment of spatial summation the protocol was repeated with a single-chamber cuff inflated around the leg. Temporal summation of pain was assessed from the leg with constant cuff pressure stimulation at 2 different pressure intensities for 10 min. Hypertonic saline was infused in the tibialis anterior muscle.
RESULTS: Cuff pressure pain thresholds were lower in subjects with whiplash associated disorder compared with controls (p < 0.05). Tonic pressure stimulation evoked higher maximal VAS and larger areas under the VAS curve in subjects with whiplash associated disorder compared with controls (p < 0.05). The pain threshold and tolerance were higher during single cuff than double cuff stimulation. The area under the VAS curve after intramuscular saline infusion was larger in whiplash associated disorder (p < 0.05).
CONCLUSION: The results indicated widespread hyperalgesia in chronic whiplash associated disorder and facilitated temporal summation outside the primary pain area, suggesting involvement of central sensitization.
Key words: assessment; cuff algometry; neck; pain; WAD.
J Rehabil Med 2012; 44: 648–657
Correspondence address: Björn Gerdle, Rehabilitation Medicine (IMH), Faculty of Health Sciences, SE-581 85 Linköping, Sweden. E-mail: bjorn.gerdle@liu.se
Submitted June 10, 2011; accepted March 14, 2012
Introduction
Chronic whiplash associated disorder (WAD) is a significant cause of disability in Western society. Annual incidences of between 0.8 and 4.2 per 1,000 inhabitants are reported (1). Pain and disability symptoms diminish rapidly in the initial months after the accident, but show little improvement after 3 months have elapsed (2). It was recently concluded that approximately 50% of those with acute WAD will report neck pain symptoms after one year (3). Intense acute pain and other symptoms and greater initial disability predicted slower recovery (3).
A wide array of aetiological mechanisms are suggested; e.g. injuries to the upper cervical ligaments (4, 5) and facet joints (6, 7) and psycho-cultural factors (8). Biochemical alterations in the trapezius muscle and signs of persistent musculoskeletal inflammation have also been found (9, 10). Several types of study indicate alterations in central nociceptive systems and pain processing in WAD (11–15). The above-mentioned factors do not necessarily exclude each other and may instead reflect different aspects of a complex chronic pain condition; the bio-psycho-social model emphasizes an integrated relationship between neurobiological, psychological and social factors (16).
Assessments of pain sensitivity in deep tissue of non-painful regions of the body may be of importance for better understanding of the complexity of the pain condition; e.g. whether or not widespread hypersensitivity (pressure, cold and heat) is present. In clinical practice it is generally recognized that a chronic pain condition associated with anatomically widespread (spatial) hypersensitivity will be more complicated to treat and rehabilitate than a condition without such signs. Several studies indicate that chronic WAD is associated with lowered pressure pain thresholds (PPT; i.e. the pressure when perception of pain occurs during gradually increasing pressure) both within the primary pain area (i.e. neck-shoulder region), within the same dermatomes as the primary pain area (e.g. arm or thumb) and remote to the primary pain area (e.g. in the tibialis anterior) (17). However, these studies have registered PPT using different types of handheld algometers. They have in common that they compress a relatively small part of the deep tissue. The question arises as to whether these registrations are representative for larger volumes of tissue? Cuff pressure algometry represents a method for assessing sensitivity, mainly in muscle and deep connective tissue. With this method considerably larger tissue volumes are compressed (18, 19). It has been used in patients with chronic widespread pain (i.e. fibromyalgia) but not in patients with local/regional pain conditions. Moreover, the spatial and temporal summation aspects of pressure pain have not previously been assessed, either in regional or widespread chronic pain conditions (20).
In a recent study of chronic WAD we reported that the cold pain threshold, but not the heat pain threshold, was lowered in remote pain-free areas (17). Hence, the spatial distribution of hypersensitivity might be modality dependent.
A chemical stimulus is another modality that can be used to investigate the pain sensitivity of the muscle; e.g. the intramuscular hypertonic saline model with the opportunity to assess both aspects of sensitization and referred pain (11, 21–23).
The hypothesis of the present study was that patients with chronic WAD compared with healthy controls have altered patterns of pain responses to pressure and chemical stimuli in non-painful deep tissues, reflecting changes in central processing of pain, including generalized hyperalgesia, facilitated spatial and temporal summation and expanded pain areas (i.e. central sensitization).
Hence, the aims of this study of chronic WAD and healthy controls were to compare the sensitivity to: (i) painful pressure stimulation of deep tissue, including aspects of spatial and temporal summation, and (ii) intramuscular hypertonic saline injections including assessment of local and referred pain areas.
Material and Methods
Subjects
Patients were recruited from the Pain and Rehabilitation Centre, University Hospital, Linköping, Sweden. Their case histories established chronic WAD without other serious disease or pain syndrome. All patients had acquired their symptoms after a traffic accident. Inclusion criteria were WAD classified as at least grade II according to the Quebec classification (24), ongoing pain for more than 6 months and minimum 18 years of age. Patients with ongoing or planned pregnancy, drug or alcohol abuse, generalized pain drawing (3 quadrants or more) and use of psychotropic drugs or strong opioids were excluded. Twenty-five women with chronic WAD (mean age 36 years (standard error of the mean (SEM) 1.3), age range 24–46 years) were included after examination of medical records, positive response to information letter and telephone call. All patients were instructed to suspend any pain medication at least from midnight on the day of assessment.
Our intention when planning the study was to include equal numbers of patients and healthy controls. However, during the data collection concerning controls technical problems occurred with the custom-made cuff algometry equipment, which not was possible to solve within the project. A new second version of the custom-made cuff algometer now exists, but due to technical problems associated with the first version, we do not have a comparison of accuracy of the two versions. Hence, only 10 female healthy controls (controls; mean age: 41 years (SEM 2.0), range 32–50 years), mainly students and university staff with no clinical pain condition, were included. No significant differences concerning body weight (controls 66.9 kg (SEM 2.2) vs WAD: 68.3 kg (SEM 2.9)), height (controls: 168 cm (SEM 2) vs WAD: 166 cm (SEM 1.0)), systolic blood pressure (controls: 122 mmHg (SEM 2) vs WAD: 128 mmHg (SEM 2)), diastolic blood pressure (controls: 74 mmHg (SEM 2) vs WAD: 78 mmHg (SEM 2)) or leg circumference (controls: 38 cm (SEM 0.6) vs WAD: 38 cm (SEM 0.7)) existed between the two groups. None in controls and 18 patients out of 25 in WAD were on sick-leave/disability pension.
The study was conducted in accordance with the Declaration of Helsinki, approved by the local ethics committee (M89–04), and all participants gave informed written consent. The approval of the local ethics committee included the possibility for the subjects (both WAD and controls) of receiving 1,000 SEK as compensation for the participation in the study.
Protocol
The subjects were assigned a coded name, appeared in a randomized order and were instructed not to discuss anything related to their medical condition with the personnel performing the assessments. The pre-session briefing was conducted in a standardized manner and was identical for controls and subjects with WAD. Part of the briefing, covering the aim and type of stimulation, was written. All relevant details regarding handling of the visual analogue scale (VAS), and the different pain thresholds were verbally relayed by the research nurse performing the assessments. The persons responsible for interpreting data (i.e. the authors) were not present during the assessments.
Each patient marked painful areas on a body chart prior to the session and the assistant used this to decide which side to assess. The side with most extensive pain areas according to the body chart was chosen when possible, for controls and patients with symmetrical pain distribution the side was randomized before the session. The experimenter could only see right or left in the protocol and was not informed of the status of the subject (WAD or controls). Measurements (arm and leg) were always made on the same side (i.e. right or left).
All assessments were made in one session. Before and after the experimental assessments the habitual neck pain intensity was recorded. Leg circumference (assessment side), blood pressure (right arm), weight, and height were recorded. Cuff algometry with double and single-chamber cuffs were completed on the leg (i.e. remote to the primary pain area). On the leg, the temporal summation pain profile was assessed twice with two different constant pressure levels at the leg (i.e. tonic stimulation). Thereafter, cuff algometry with double-chamber cuffs were completed on the arm (i.e. within the same dermatomes as the primary pain area). Finally, saline-induced muscle pain was assessed in the same leg as the cuff algometry and was evaluated by intramuscular infusion of hypertonic saline in m. tibialis anterior (TA). Breaks of between 5 and 10 min were allowed between the individual assessments.
Habitual pain intensity
Habitual pain intensity was recorded using a 10-cm VAS with endpoints 0 cm “no pain” and 10 cm “worst possible pain”. These intensity registrations were reported to the assistant outside the laboratory and were blinded to the experimenter handling the sensitivity assessments. The final habitual pain intensity was rated approximately two min after the saline-induced muscle pain had ceased (see below).
Cuff pressure algometry
The experimental setup consisted of a double chamber 13-cm wide tourniquet cuff (a silicone high-pressure cuff, separated lengthwise into two equal-size chambers, VBM Medizintechnik GmbH, Sulz, Germany), a computer-controlled air compressor, and an electronic VAS (Aalborg University, Denmark). The compression rate of the compressor was pre-set to 1 kPa/s and controlled by the computer. The cuff was connected to the compressor and wrapped around the mid-portion of the triceps surae muscles of the leg or around the heads of biceps and triceps muscles of the arm. The maximum pressure limit used was 100 kPa (760 mmHg). The stimulation could be aborted at any time by the subject using a push button or the experimenter via the computer or the pressure-release button.
The pain intensity was recorded simultaneously using an electronic VAS (10 Hz sampling rate of the computer). The electronic VAS had a variable lever and the magnitude was displayed on a red light bar fully visible to the subject. Zero and 10 cm extremes on the VAS were defined as “no pain” and as “worst possible pain”, respectively.
Pain detection threshold (PDT; kPa), pain tolerance threshold (PTT; kPa) and pain tolerance intensity (PTI; mm) were extracted. PDT was defined as the pressure equivalent to the moment of transition from strong to painful pressure (i.e. VAS > 0 for the first time). PTT was defined as the pressure level where the subject felt a pain sensation strong enough to feel like interrupting or stopping the session, at which point the subject did so by pressing the stop button (19). PTI was defined as the pain intensity (VAS) corresponding to PTT. Moreover, the area under pressure-VAS curve (PVA) obtained during threshold examination was calculated. A small PVA is a sign of high pain sensitivity.
The presence of spatial summation at the leg was also investigated; i.e. the effect of doubling the area stimulated under the cuff (i.e. double vs single cuff). A significantly lower value with double cuff indicated clinical spatial summation. According to a clinical approach we compared PDT, PTT, PTI and PVA between single and double cuff. Spatial summation was also evaluated in a more strict psychophysiological sense by comparing pressure-VAS curves from single- and double-cuff stimulation and extracted as the area difference under the pressure-VAS curves at the lowest PTT (i.e. only the pressure intensities included for both double and single-cuff stimulation) (denoted PVAincrease). A larger difference in the area under the curves indicated a high degree of spatial summation. The difference between PVAsingle and PVAdouble (regardless of pressure intensity) was also calculated (denoted as PVAdifference).
The temporal pain summation was assessed by measuring VAS as a function of time during a constant pressure intensity with double cuff inflation for 10 min (i.e. tonic stimulation) followed by a 2-min recording with zero pressure. Cuff inflation to the pre-set pressure intensity was momentary. Two successive recordings were made, separated by 5 min (i.e. 7 min without tonic stimulation when the 2 min recording with zero pressure is included), with the first pressure level set to 25 kPa and another stimulation intensity equal to the mean value of PDT and PTT (see above). The later stimulation intensity was designed to achieve a pressure level related to the individual pressure pain sensitivity. From the VAS recordings the maximal VAS (VASpeak) and time to VASpeak were extracted. Moreover, the area under the time-VAS curve (TVA) and the temporal summation index (TSI; defined as VASpeak/time to VASpeak) were then calculated. TSI and time to VASpeak were only established for the 25 kPa level. If a subject aborted the 10-minute pressure stimulation prematurely, the remaining time (s) with pain sensation (denoted timeRESC) was also registered manually with a timer.
Saline-induced muscle and referred pain
Infusion of hypertonic saline was made approximately 10 min after the last item of the cuff algometry of the arm and accomplished with a computer-controlled syringe pump (IVAC, model 770, Alaris Medical, San Diego) and a 10 ml plastic syringe. A tube (IVAC G30303, extension set with polyethylene inner line) was connected from the syringe to a 27G hypodermic needle (Braun) (21). Infusion of sterile hypertonic saline (6%) into the tibialis anterior muscle was performed with a bolus infusion of 0.5 ml over 20 seconds (90 ml/h). The pain intensity of the saline-induced muscle pain was scored continuously on the 100-mm electronic VAS (Aalborg University, Denmark; 0 cm indicated “no pain” and 10 cm “worst possible pain”). The pain intensities were sampled every fifth second by the computer and recorded for maximum 20 min including the infusion time (21); the area under the time-VAS curve (AUCsaline), maximal VAS (VASpeaksaline), and the time to VASpeaksaline (time to VASpeaksaline) were extracted.
The patients drew the distribution of the perceived saline-induced muscle pain on an anatomical map after the pain had ceased. The circumference was then digitized (ACECAD D9000 + digitizer, Freeware, Almeethaq), and the area (in the following labelled pain area) was calculated using Sigma-Scan (Systat Software Inc, San Jose) (21). Pain around the infusion site was defined as local pain, as long as the area was continuous. Pain areas separated from local pain were defined as referred pain areas (often located at the ankle level). Pain spread distal to the malleoli could represent either local or referred pain as long as it covered an area distal to a line between the malleoli. Pain spread proximal to the knee joint was defined as proximal pain. Also, the number of referred pain areas was recorded for each subject.
Statistical analysis
Data in text and tables are presented as mean values ± SEM. Mann-Whitney U test was used for group comparisons. Wilcoxon signed-rank test was used for within-group comparisons. The χ2 and Fisher’s exact tests were used for comparison of dichotomized variables, mainly referred pain areas. p < 0.05 was regarded as significant in all analyses. Multivariate analyses were performed using the SIMCA-P+, version 12.0 (Umetrics Inc., Umeå). When investigating the correlations between variables, Principal component analysis (PCA) and partial least squares (PLS) regression were applied (15). PCA was used to extract and display systematic variation in a data matrix. The obtained components (p) are per definition not correlated and are arranged in decreasing order with respect to explained variation. Variables loading on the same component (p) are correlated and variables with high loadings but with different signs are negatively correlated. Variables with absolute loadings ≥ 0.20 and that had a 95% confidence interval not equal to zero were considered significant. R2 describes the goodness of fit; the fraction of sum of squares of all the variables explained by a principal component.
PLS was used for the multivariate regression analysis of group membership (controls or WAD) and habitual pain intensities before and after the experiment (i.e. two Y-variables) using the variables obtained during single and double cuff stimulations and temporal profiles together with anthropometric data as regressors. The VIP variable (variable influence on projection) indicates the relevance of each X-variable pooled over all dimensions and Y-variables (the group of variables that best explain Y). VIP³1.0 was considered significant. Coefficients (PLS scaled and centred regression coefficients) were used to note the direction of the relationship (positive or negative).
Results
Habitual pain intensity in whiplash associated disorder
There was no significant difference in habitual pain intensity of the neck before and after the experiment (4.1 ± 0.5 vs 4.3 ± 0.6 cm) in WAD.
Cuff pressure algometry with increasing pressure
Detection and tolerance thresholds of pain. PTT with double cuff was significantly higher in controls than in WAD both in the arm (within the same dermatomes as the primary pain area) and leg (remote to the primary pain area) (Table I); a similar non-significant trend was noted for the single cuff stimulation of the leg. PVA was significantly smaller in WAD than in controls for the double, but not the single, cuff situation of the leg. PDT and PTI did not differ significantly between the two groups in arm (double cuff) or leg (both cuffs).
Spatial summation of cuff pressure stimulation. For all cuff assessments at the leg of both WAD and controls the PDT (p < 0.01), PTT (p < 0.001) and PVA (p < 0.001) were significantly higher during single cuff stimulation compared with double cuff stimulation. However, no significant group differences existed for the differences between single and double cuff of these variables. Furthermore, neither of the 2 variables intended to reflect spatial summation in a more strict psychophysiological sense, PVAincrease and PVAdifference, were significantly different between the two groups (Table I).
| Table I. Mean ± standard error of the mean (SEM) of cuff pressure pain variables obtained during increasing pressure (constant rate of inflation) in patients with chronic whiplash associated disorders (WAD) and in healthy controls in arm and leg. See text for statistical analyses of within-group differences |
| Variables | Group |
| Controls (n = 10) Mean ± SEM | WAD (n = 25) Mean ± SEM |
| Arm double cuff | | |
| PDT, kPa | 24.9 ± 5.6 | 18.8 ± 2.3 |
| PTT, kPa | 65.7 ± 6.2 | 47.9 ± 4.5* |
| PTI, cm | 9.8 ± 0.2 | 9.7 ± 0.1 |
| Leg double cuff | | |
| PDT, kPa | 23.3 ± 2.6 | 18.1 ± 1.9 |
| PTT, kPa | 49.5 ± 4.2 | 38.9 ± 3.5* |
| PTI, cm | 9.7 ± 0.2 | 9.5 ± 0.2 |
| PVA, cmkPa | 128.8 ± 13.3 | 96.2 ± 10.0* |
| Leg single cuff | | |
| PDT, kPa | 28.9 ± 4.8 | 23.4 ± 3.4 |
| PTT, kPa | 62.2 ± 6.3 | 52.3 ± 5.4 |
| PTI, cm | 9.7 ± 0.2 | 9.5 ± 0.2 |
| PVA, cmkPa | 178.7 ± 33.0 | 128.6 ± 12.0 |
| Spatial summation – leg | | |
| PVAincrease, cmkPa | 57.6 ± 15.0 | 35.5 ± 11.3 |
| PVAdifference, cmkPa | 49.9 ± 26.3 | 32.4 ± 6.9 |
| *Significantly lower compared with controls (p < 0.05). PDT: pain detection threshold; PTT: pain tolerance threshold; PTI: pain tolerance intensity; PVA: area under pressure-visual analogue scale curve. |
Cuff pressure pain sensitivity in leg vs arm. PTT using double cuff were significantly higher at the arm than at the leg in all subjects taken together and in both groups of subjects separately (all: p < 0.001; WAD: p < 0.002; controls: p > 0.02; Table I). PTI using double cuff were significantly higher at the arm than at the leg in all subjects taken together (p < 0.005) and in WAD (p < 0.01).
Tonic stimulation during 10 min
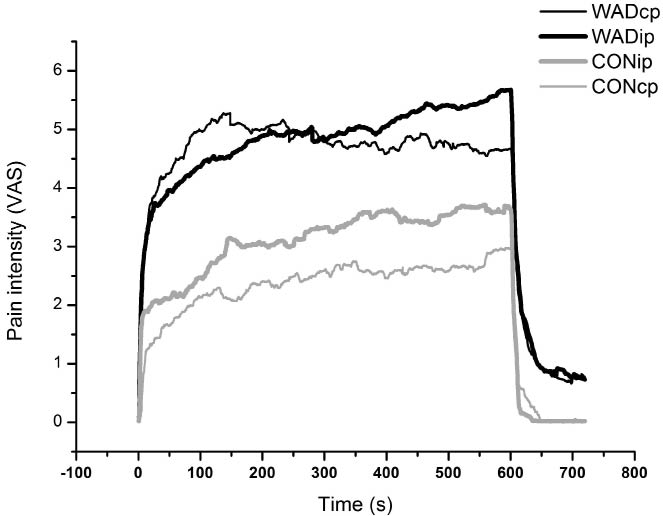
Constant pressure at 25 kPa. VASpeak was significantly higher and the time to VASpeak significantly shorter in WAD than in controls (Table II, Fig. 1). TSI was significantly higher for WAD compared with controls. TVA was significantly larger in WAD. One-third of the WAD patients and 4 of the controls (40%) had a negative slope after the VAS-peak, indicating habituation to pain stimuli; this difference in distribution between groups was not significant. Three patients in the WAD group aborted the registration before 10 min’ stimulation. The time with pain after rescue (i.e. timeRESC) varied between 13 and 155 seconds.Constant pressure at an individual pressure level. The mean pressure levels calculated and used during the tonic stimulation at the individual pressure level were 36.4 kPa (± 3.3) in controls and 28.5 kPa (± 2.6) in WAD (p < 0.03). VASpeak was significantly higher in WAD than in controls (Table II, Fig. 1).
| Table II. Mean ± standard error of the mean (SEM) of pain intensity (visual analogue scale; VAS) parameters during cuff pressure algometry with constant pressure during 10 min in the leg (tonic stimulation). Temporal profiles were obtained both at 25 kPa and at an intensity relative to the individual pain threshold in patients with chronic whiplash associated disorders and in healthy controls. See text for statistical analyses of within-group differences |
| Variables | Group |
| Controls (n = 10) Mean ± SEM | WAD (n = 25) Mean ± SEM |
| Temporal profile at 25 kPa | | |
| TVA, cm | 1457 ± 589 | 2644 ± 403* |
| VASpeak, cm | 3.3 ± 1.2 | 6.9 ± 0.7* |
| Time to VASpeak, s | 510 ± 45 | 283 ± 51* |
| TSI, cm–1 × 10⁻² | 0.10 ± 0.04 | 1.5 ± 0.56** |
| Temporal profile at an individual level | | |
| TVA, cm | 1896 ± 485 | 2985 ± 307 |
| VASpeak, cm | 4.4 ± 1.0 | 7.0 ± 0.5* |
| *Significantly different compared with controls (p < 0.05). **Significantly different compared with controls (p < 0.01). TVA: area under the time-VAS curve; TSI: temporal summation index; VASpeak: maximal VAS score. |
Fig. 1. Mean values of the pain intensity (visual analogue scale; VAS) ratings during constant pressure stimulation at 25 kPa (denoted cp; thin lines) and a constant pressure at an individual level (denoted ip; fat lines) in the 2 groups of subjects (subjects with whiplash associated disorder (WAD) and controls). Black lines represent WAD and grey lines represent controls.
Saline-induced muscle pain and referred pain
Infusion of hypertonic saline resulted in significantly larger areas under the VAS curve (AUCsaline) in WAD compared with controls (Table III).
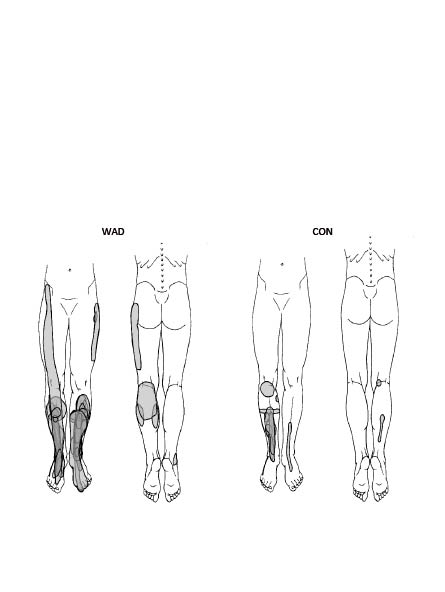
The drawn pain areas in the leg after saline infusion were expanded in WAD although not significantly (Table III; Fig. 2). The number of referred pain areas, pain distal to the malleoli and actual referred pain area did not differ significantly between the groups. However, only the patient group displayed proximal referred pain (n = 3) and had a total of 16 referred pain areas compared with 3 in the control group.
| Table III. Mean visual analogue scale score (VAS) (± standard error of the mean; SEM) parameters during saline-induced pain in m tibialis anterior in patients with chronic whiplash associated disorders (WAD) and in healthy controls. |
| Variables | Group |
| Controls (n = 10) Mean ± SEM | WAD (n = 25) Mean ± SEM |
| VASpeaksaline, cm | 5.4 ± 1.0 | 7.5 ± 0.6 |
| Time to VASpeaksaline, s | 264 ± 25 | 340 ± 30 |
| AUCsaline, cm) | 984 ± 215 | 1,755 ± 221* |
| Total pain area on drawingª | 1.2 ± 0.3 | 3.0 ± 0.7 |
| Referred pain area on drawingsª | 0.2 ± 0.1 | 0.9 ± 0.4 |
| aDenotes arbitrary units. *Significantly higher in WAD compared with controls (p < 0.05). VASpeaksaline: maximal VAS saline; AUCsaline: area under the time-VAS curve saline. |
Fig. 2. Pain areas in the leg after hypertonic saline infusion in the 2 groups of subjects (subjects with whiplash associated disorder (WAD) and CON (controls). Pain areas from all subjects are superimposed. Subjects only present unilateral pain (i.e. injected on pain-dominant side).
Multivariate analyses
Regression of group membership. This step of the multivariate analyses investigated which experimental variables (except the pain intensity variables before and after the experiment) together with anthropometric variables that in the multivariate context differed most prominently between the 2 groups (controls or WAD; Table IV). The 5 strongest regressors were (in descending order; a positive sign indicate that the WAD group had a high value while a negative sign indicates a low value for the WAD group): VASpeak (+) and time to VASpeak (–) at tonic stimulation at 25 kPa level and VASpeak (+) at tonic stimulation at the individual pressure intensity and PTT arm double cuff (–), and AUCsaline (+). However, the frequency of pain areas distal to the malleolus after hypertonic saline infusion was also associated with WAD membership (Table IV). Hence, the multivariate analysis generally confirmed the group differences reported in Tables I–III.
| Table IV. Multivariate regression (i.e. partial least squares; PLS) of group membership (controls or whiplash associated disorder (WAD); controls coded 0 and WAD coded 1) and habitual pain intensities (visual analogue scale score; VAS) in WAD before and after the experiment (i.e. 2 Y-variables) using the variables obtained during single and double cuff stimulations and tonic stimulations together with anthropometric data as regressors. Variable influence on projection (VIP) ≥ 1 is significant and given in bold type. The sign of the coefficient (Coeff) indicates direction of correlation. The bottom row shows R2 for the 2 regressions |
| Aspect | Variables | Group | VAS in WAD |
| VIP | Coeff | VIP | Coeff |
| Increasing pressure | PDT arm double cuff | 0.80 | –0.03 | 1.06 | –0.00 |
| PTT arm double cuff | 1.44 | –0.05 | 1.17 | –0.01 |
| PTI arm double cuff | 0.09 | 0.00 | 1.12 | –0.10 |
| PDT leg double cuff | 0.98 | –0.03 | 1.10 | –0.02 |
| PTT leg double cuff | 1.11 | –0.04 | 1.16 | –0.06 |
| PTI leg double cuff | 0.40 | –0.01 | 1.16 | –0.11 |
| PVA leg double cuff | 1.17 | –0.04 | 1.26 | –0.09 |
| PDT leg single cuff | 0.58 | –0.02 | 1.11 | –0.04 |
| PTT leg single cuff | 0.66 | –0.02 | 1.28 | –0.07 |
| PTI leg single cuff | 0.37 | –0.01 | 1.46 | –0.11 |
| PVA leg single cuff | 1.17 | –0.04 | 1.32 | –0.11 |
| PVAincrease | 0.75 | –0.02 | 0.83 | –0.05 |
| PVAdifference | 0.61 | –0.02 | 0.54 | –0.05 |
| Temporal | TVA at 25 kPa | 1.22 | 0.04 | 1.06 | 0.06 |
| VASpeak at 25 kPa | 1.76 | 0.06 | 1.12 | 0.01 |
| Time to VAspeak at 25 kPA | 1.67 | –0.05 | 1.64 | –0.16 |
| TSI at 25 kPa | 1.01 | 0.03 | 1.10 | 0.08 |
| timeRESC | 0.66 | 0.02 | 0.66 | 0.07 |
| Individual kPa level | 1.10 | –0.04 | 1.16 | –0.04 |
| TVA individual kPa | 1.22 | 0.04 | 0.15 | –0.01 |
| VASpeak individual kPa | 1.60 | 0.05 | 0.46 | –0.04 |
| Intramuscular saline | VASpeaksaline | 1.22 | 0.04 | 0.78 | 0.02 |
| Time to VASpeaksaline | 0.90 | –0.03 | 1.68 | –0.17 |
| Pain duration saline | 0.97 | 0.03 | 0.91 | –0.07 |
| AUCsaline | 1.31 | 0.04 | 0.67 | 0.03 |
| Total pain area drawing | 1.03 | 0.03 | 0.58 | 0.06 |
| Referred pain area on drawing | 0.66 | 0.02 | 0.28 | 0.03 |
| Proximal pain (yes/no) | 0.66 | 0.02 | 0.80 | –0.08 |
| Numbers of referred pain areas | 0.65 | 0.02 | 0.25 | 0.02 |
| Pain distal of malleolus | 1.22 | 0.04 | 0.50 | 0.05 |
| Anthropometry | Weight | 0.29 | 0.01 | 0.83 | –0.07 |
| Height | 0.62 | –0.02 | 0.84 | 0.08 |
| Leg circumference | 0.07 | 0.00 | 0.56 | –0.03 |
| R2 | 0.26 | | 0.53 | |
| PDT: pain detection threshold; PTT: pain tolerance threshold; PTI: pain tolerance intensity; PVA: area under pressure-VAS curve; TVA: area under the time-VAS curve; VASpeaksaline: maximal VAS saline; AUCsaline: area under the time-VAS curve saline; VASpeak: maximal VAS; timeRESC:remaining time with pain sensation; TSI: temporal summation index. |
Multivariate correlation analysis (PCA) of all subjects taken together. A PCA of the variables under investigation (except the habitual pain intensity variables) together with anthropometric variables for all subjects taken together was made and identified one significant component (R2 = 0.32; Table V). According to this analysis the PDT and PTT variables correlated negatively with TVA and VASpeak at the 25 kPa tonic stimulation and VASpeak saline and AUCsaline. In other words, high pain intensities and large areas under VAS curves during intramuscular saline and during the tonic pressure were significantly associated with low PDT and PTT in both arm and legs.
| Table V. Principal component analyses (PCA) based on the experimental outcome variables and anthropometric data together for all subjects taken together and for the 2 groups separately. In the PCA of subjects with whiplash associated disorder (WAD) the habitual pain intensities were also included. Loadings are presented and significant loadings are given in bold type for each significant component (p1 and p2). The bottom line shows the explained variation (R2) of each significant component |
| Aspect | Variables | All (p1) | Controls (p1) | WAD (p1) | (p2) |
| Increasing pressure | PDT arm double cuff | –0.25 | –0.22 | –0.25 | –0.09 |
| PTT arm double cuff | –0.28 | –0.25 | –0.28 | –0.05 |
| PTI arm double cuff | 0.10 | 0.11 | 0.10 | 0.27 |
| PDT leg double cuff | –0.27 | –0.26 | –0.27 | 0.03 |
| PTT leg double cuff | –0.25 | –0.22 | –0.25 | 0.19 |
| PTI leg double cuff | 0.06 | –0.00 | 0.08 | 0.24 |
| PVA leg double cuff | –0.21 | –0.1 | –0.23 | 0.22 |
| PDT leg single cuff | –0.27 | –0.25 | –0.27 | –0.02 |
| PTT leg single cuff | –0.28 | –0.24 | –0.29 | 0.06 |
| PTI leg single cuff | 0.08 | –0.18 | 0.18 | 0.16 |
| PVA leg single cuff | –0.17 | –0.08 | –0.21 | 0.15 |
| PVAincrease | –0.21 | –0.23 | –0.19 | –0.07 |
| PVAdifference | –0.06 | –0.05 | –0.04 | –0.05 |
| Temporal | TVA at 25 kPa | 0.25 | 0.27 | 0.22 | –0.02 |
| VASpeak at 25 kPa | 0.28 | 0.27 | 0.26 | –0.04 |
| Time to VAspeak at 25 kPA | –0.03 | –0.12 | 0.02 | 0.37 |
| TSI at 25 kPa | –0.09 | 0.21 | –0.15 | –0.28 |
| timeRESC | 0.08 | NA | 0.08 | –0.05 |
| Individual kPa level | –0.27 | –0.24 | –0.27 | 0.14 |
| TVA individual kPa | 0.11 | 0.21 | 0.03 | 0.34 |
| VASpeak individual kPa | 0.14 | 0.20 | 0.07 | 0.30 |
| Intramuscular saline | VASpeaksaline | 0.25 | 0.27 | 0.21 | 0.06 |
| Time to VASpeaksaline | –0.10 | 0.09 | –0.11 | 0.11 |
| Pain duration saline | 0.14 | 0.10 | 0.13 | 0.10 |
| AUCsaline | 0.23 | 0.27 | 0.19 | 0.07 |
| Total pain area drawing | 0.09 | 0.10 | 0.06 | 0.19 |
| Referred pain area on drawing | 0.04 | 0.01 | 0.03 | 0.03 |
| Proximal pain (yes/no) | 0.01 | NA | –0.02 | 0.22 |
| Numbers of referred pain areas | 0.03 | 0.00 | 0.02 | 0.02 |
| Pain distal of malleolus | 0.05 | –0.02 | 0.03 | 0.06 |
| Habitual pain intensity | VASbefore | NA | NA | 0.12 | –0.25 |
| VASafter | NA | NA | 0.09 | –0.27 |
| Anthropometry | Weight | 0.08 | 0.06 | 0.08 | 0.13 |
| Height | 0.04 | 0.05 | 0.07 | 0.08 |
| Leg circumference | 0.10 | 0.10 | 0.11 | 0.04 |
| R2 | | 0.32 | 0.41 | 0.31 | 0.12 |
| NA: not applicable; PDT: pain detection threshold; PTT: pain tolerance threshold; PTI: pain tolerance intensity; PVA: area under pressure-VAS curve; TVA: area under the time-VAS curve; VASpeaksaline: maximal VAS saline; AUCsaline: area under the time-VAS curve saline; VASpeak: maximal VAS; timeRESC: remaining time with pain sensation; TSI: temporal summation index. |
Multivariate correlation analysis of the two groups separately. The separate PCA in controls identified one significant component (R2 = 0.41), while the PCA of WAD had two significant components (cumulative R2 = 0.43; Table V).Very similar patterns as in all subjects were observed according to the first component of these two analyses.
The separate analysis of WAD (Table V) also included habitual pain intensities and these variables loaded significantly upon the second component (p2). Scrutinizing p2 it was obvious that high habitual pain intensities were associated with a short time to VASpeak and high TSI of the tonic stimulation at 25 kPa, together with small TVA and low VASpeak of the tonic stimulation at the individual pressure. Thus, the second component indicated correlations between habitual pain intensities and the experimental variables obtained during the tonic stimulations of the cuff algometry.
Regression of habitual pain intensity in whiplash associated disorder
Based on the results of p2 of the PCA in WAD (cf. Table V) it was further analysed which variables correlated most strongly with the two habitual pain intensity variables (Table IV). The two strongest regressors were time to VASpeak at tonic stimulation at 25 kPa and time to VASpeak after intramuscular saline, but also the variables of the increasing pressure (i.e. PDT, PTT, PTI and PVA) correlated with the two pain intensity variables. Hence, high pain intensities in WAD were associated with short times to VASpeak, but also low PDT, PTT, PTI and PVA of the leg (both single and double cuff), high VASpeak and high TSI of the tonic stimulation at 25 kPa.
Discussion
Main findings
The main findings of the present study were that chronic WAD showed signs of widespread hyperalgesia according to PTT, together with increased temporal summation during pressure stimulation and increased pain response (i.e. AUC) as a consequence of chemical stimulation in remote non-painful deep tissues (muscles). We found no differences in spatial summation for pressure between controls and WAD. Our findings taken together indicate central sensitization in chronic WAD (25, 26).
Deep-tissue hyperalgesia
PTT were significantly lower at the arms and legs (i.e. outside the primary pain area) in WAD compared with controls. In agreement with this it was found that the PVA from assessments of the legs was significantly smaller in WAD. These findings from areas outside the primary pain areas (i.e. neck and shoulders) indicate anatomically widespread pressure pain hypersensitivity in WAD even though the indicated VAS-levels when the subjects aborted the stimulation (PTI) did not differ between the two groups. Our results agree with, e.g. Scott et al. (27), who found widespread hypersensitivity to pressure, but also to heat and cold stimuli, in WAD. Moreover, hypersensitivity to electrical intramuscular stimulation of the tibialis anterior muscle in WAD compared with healthy controls has been reported (13).
There were no significant differences in pressure pain thresholds PDT (in the literature also labelled PPT) between the two groups during cuff stimulation of the arm or leg (Table I). Significantly lower pressure pain thresholds using manual pressure algometers have been reported in local/regional chronic WAD (i.e. without simultaneous widespread clinical pain including fibromyalgia) (9, 28). The fact that cuff pressure algometry and manual algometry compress different tissue volumes can explain the different results. One study reported significantly lower pressure pain thresholds in fibromyalgia compared with controls during cuff pressure algometry (20). A possible reason for this difference in pressure pain thresholds could be that fibromyalgia patients by definition both have habitual clinical widespread pain and clinical generalized hyperalgesia; this was not the case in this group of patients with WAD. Fibromyalgia may be associated with more prominent alterations in the nociceptive processing. According to this line of argument pressure tolerance reductions may occur in non-painful muscles prior to the development of widespread pain, clinically detectable hyperalgesia and lowered pressure pain thresholds.
Spatial summation
Continuous nociception may saturate the spatial summation mechanisms. Attenuated or saturated effects have been reported for the descending noxious inhibitory control system in other clinical pain conditions (29, 30), indicating a disturbed somatosensory function when the central nervous system is under barrage of nociceptive afferent signals. Doubling the area stimulated under the cuff (i.e. double vs single cuff) at the leg showed significant effects on several isolated pressure sensitivity parameters, e.g. in all subjects taken together: PDT, PTT and PVA were significantly affected. However, neither the differences between single and double cuff for these variables nor the more strict spatial summation variables (PVAincrease and PVAdifference) were significantly different between WAD and controls. Hence, we found no signs of altered spatial summation for pressure in areas remote to the primary pain area in WAD. This negative result has to be confirmed in larger studies.
Anatomical differences
Surprisingly higher pressure pain tolerance levels and higher associated pain intensity scores were recorded at the arm compared with the leg in both groups of subjects. The segmental levels of the arms are closer to the primary painful area of the neck and shoulders and increased pain sensitivity at the arms compared with the legs in WAD seems reasonable. Since saline infusion in the tibialis anterior muscle was the last item of assessment, this observed hypersensitivity in the legs cannot be explained by experimentally induced hypersensitivity caused by the muscle pain (31). The arm assessment was, however, performed as the last cuff pressure algometry item and an effect of generalized descending inhibitory control caused by the pressure pain evoked by the tonic cuff pressure cannot be ruled out (32).
Temporal summation during tonic pressure stimulation
WAD and controls had different temporal summation profiles; WAD showed higher VAS ratings immediately, which were maintained throughout the test (Fig. 1). The significant group difference concerning the TSI (Table II) could be interpreted as a sign of more rapid recruitment of nociceptors in WAD (33) or central sensitization. The proportion of subjects with habituation did not differ between WAD and controls. However, the proportion of habituating subjects in controls (40%) were markedly smaller than the figures presented previously, where healthy subjects showed a tendency to habituate in 72% of the cases (19). Enhanced effect of temporal summation, expanded referred pain areas (see below) and generalized hyperalgesia to pressure found in this study are findings considered to be associated with central sensitization (26).
Saline-induced muscle-pain and distribution
The hypertonic saline stimulation in the leg showed significantly larger areas under the VAS curve (AUCsaline) in subjects with WAD than in controls (Table III). Hence, the results of hypertonic saline stimulation gave further support to the conclusion that pain processing is altered in remote non-painful muscle tissue. Significant differences in pain intensity after hypertonic saline in the tibialis anterior muscle between subjects with chronic WAD and healthy controls were also found by Koelbaek Johansen and co-workers (11). However, in their study of chronic WAD, in contrast to the present study of local/regional pain associated with WAD, almost half of the subjects reported habitual widespread pain (11).
The total drawn pain area in the leg of subjects with WAD was not significantly enlarged compared with controls (Table III). Pain distal to the malleolus on the pain drawing was linked to WAD in the comprehensive multivariate context (Table IV). Proximal spread of referred pain was only found in the patient group. Proximal spread of pain after intramuscular saline induced muscle pain has been reported in other studies of WAD and chronic musculoskeletal pain (11, 34, 35). Enlarged referred pain areas and/or proximal spread of projection are probably a strong indicator of central sensitization and may correspond to basic neurophysiological experiments in animals with proximal segmental spread of hyperexcitability (36, 37). Future studies could include assessment of allodynia in the area of saline-induced referred pain.
Intercorrelations between different stimuli
The results of the present tests including more prolonged temporal aspects (i.e. pressure and chemical stimuli) were intercorrelated both in subjects with WAD and in controls according to the multivariate analyses (Table V). Moreover these variables also intercorrelated with pressure pain tolerance levels according to the PCA in Table V. According to the literature it is unclear if responses to different experimental pain modalities represent different specific dimensions (38, 39). A first interpretation might be that pressure and chemical stimuli do not represent specific domains. However, with the present design it cannot be excluded that specific dimensions to some extent can be intercorrelated; the first component (p1) in all subjects, in controls and in subjects with WAD explained a relatively low part of the variation in the data set (R2: 0.31–0.41).
Habitual pain intensities vs outcomes of deep nociceptive stimulation
In the present study habitual pain intensities correlated negatively with tonic pressure pain variables (i.e. time to VASpeak at temporal stimulation at 25 kPa and time to VASpeak after intramuscular saline), but also even though weaker (negatively) with the variables of pressure pain sensitivity (i.e. PDT, PTT, PTI and PVA) (p2 in Tables IV and V). The fact that ongoing habitual pain intensity influence pain sensitivity in non-painful areas of a chronic localized/regional pain condition has also been reported in other studies (40). Two studies of chronic WAD have investigated the interrelationships between habitual pain intensity and pressure pain sensitivity, but these studies investigated the primary pain area and came to different conclusions (27, 28). More studies of WAD are needed before any definite conclusions can be drawn about the relationships between the habitual pain intensity and pressure pain sensitivity within and outside the primary pain area in WAD. The increased sensitivity in areas outside the primary pain area can both be due to central neurobiological alterations (12) and increased attention or fear related to pain (17, 28).
Methodological aspects
All patients were evaluated at the Pain and Rehabilitation Centre, Linköping University Hospital before participation. It is of importance to stress that only patients with regional pain in the neck and shoulders were included and WAD patients with clinical habitual signs of widespread pain were excluded, in contrast to some other studies of WAD (11). The control group was small compared with the WAD group due to technical problems (see the section on Subjects). Hence, the study was under-powered with respect to the number of controls. Despite this, we found several significant group differences (Tables I–III). Moreover, we have used multivariate statistics, which allow a low subject-to-variables ratio (c.f. Statistical analysis section) and an effective extraction of important results compared with traditional univariate and bivariate statistics in small samples. However, the results of this study should be confirmed in larger studies also including patients managed in primary healthcare. When planning such larger studies it is also important to consider the order of tests and the duration of pauses between the tests using a certain nociceptive stimuli and between different nociceptive stimuli. One possible disadvantage with the present study might be that the subjects not were investigated in the same part of the menstrual cycle. However, the literature concerning the relationships between gonadal hormones and pain sensitivity in humans is not in consensus. There is also a lack of reliable methods to determine the cycle phase.
Clinical implications
Even though the non-invasive cuff pressure algometry technique deserves further evaluation in larger groups of both patients and healthy controls, the present results concerning WAD and the results of patients with fibromyalgia are promising (20). There is a need for easily administrated quantitative sensory testing techniques of deep tissues/muscles in order to quantify the degree of pain sensitivity. The multivariate analysis of group membership (Table IV) indicates that temporal pressure stimulation can be an important technique in clinical assessment of WAD. Studies on patients with chronic pain of non-neuropathic origin have shown a multitude of experimental, pharmacological and biochemical aberrations, which points to engagement of several neurobiological mechanisms and presents a heterogenic clinical picture (11–15, 34). The roles of these disturbances as prognostic and therapeutic markers are not known, and there is a need for clinical guidelines for the evaluation of such neurobiological disturbances (20).
CONCLUSION
Our experimental findings support the hypothesis of widespread neurobiological alterations in chronic WAD patients without clinical widespread pain and clinical hyperalgesia. Hence, deep tissue pain sensitivity outside the primary pain area in chronic WAD with regional neck pain showed widespread hypersensitivity and facilitated temporal summation together with a tendency for less effect of spatial summation. These findings might be related to central sensitization in systems processing nociception and pain. From a rehabilitation perspective it seems important to investigate the importance of widespread hyperalgesia with respect to effects of treatments and multimodal rehabilitation in patients with chronic WAD.
Acknowledgements
This study was supported by the Swedish Research Council. The authors report no affiliations or financial benefit from any source that could cause a conflict of interest. We want to thank research nurse Eva-Britt Lind and department secretary Lena Lindgren for their dedicated work with logistics, and parts of the evaluation process.
References