OBJECTIVE: To examine the measurement properties of a short version of the Stroke-Specific Quality of Life Scale (SS-QoL-12).
DESIGN: Self-report survey of patients with mild to moderate upper extremity dysfunction.
Patients: A total of 126 patients provided 252 observations before and after treatment.
METHODS: The construct validity and reliability was examined using the Rasch model; the concurrent and predictive validity was estimated using Spearman’s rank correlation coefficients. Paired t-test and the standardized response mean (SRM) were performed to estimate the responsiveness of the SS-QoL-12.
RESULTS: The 2-factor model (psychosocial and physical domains) fit the data better with smaller deviances. All but 1 item showed acceptable fit, and no item biases were detected. The reliability of the subscales and the whole scale ranged from 0.67 to 0.99. The total score showed fair correlations with the criterion measures at pretreatment (ρ = 0.28–0.40) and fair to good correlations at post-treatment (ρ = 0.39–0.54). The subscales had low to fair correlations at pretreatment (ρ = 0.19–0.49) and fair to good correlations at post-treatment (ρ = 0.31–0.56). The total and the subscales had low to good predictions at baseline (ρ = 0.22–0.52). The whole scale and the psychosocial subscale were mildly responsive to change (SRM = 0.22), but the physical subscale was not responsive to change (SRM = 0.08).
CONCLUSION: The SS-QoL-12 has acceptable to good measurement properties, with an advantage of requiring less time to administer than other scales. The use of the subscale and total scores depends on the purpose of research. Future studies should recruit stroke patients with a broad range of dysfunction and use a large sample size to validate the findings.
Key words: psychometrics; rehabilitation; quality of life; stroke.
J Rehabil Med 2012; 44: 629–636
Guarantor: Keh-chung Lin, School of Occupational Therapy, College of Medicine, National Taiwan University and Division of Occupational Therapy, Department of Physical Medicine and Rehabilitation, National Taiwan University Hospital, 17, F4, Xu Zhou Road, Taipei, Taiwan. E-mail: kehchunglin@ntu.edu.tw
Submitted August 22, 2011; accepted February 13, 2012
INTRODUCTION
Stroke is a main cause of disability and death worldwide (1). Stroke survivors often experience losses in physical function, impairments in activities of daily living (ADL) and reduced quality of life. To quantify the consequences of stroke and evaluate the effects of treatment methods, the Stroke-Specific Quality of Life Scale (SS-QoL), the first health-related quality of life (HRQoL) measure for stroke patients, was developed in 1999 (2). This stroke-specific instrument includes 49 items and offers a total score and 12 subscales (such as mobility, thinking, and social roles) scores to facilitate the comparisons of diverse patient groups. A number of studies have adopted the SS-QoL as an outcome measure to determine the effect of stroke on the health function of the patients (3, 4).
The reliability, validity and responsiveness of the SS-QoL have been investigated extensively. Studies in test-retest reliability showed moderate to excellent stability (5), and Cronbach’s alpha of 0.81–0.94 for all the 12 domains indicated good internal consistency (5). Previous investigations have reported 1-, 2-, 4-, 8-, and 12-domain solutions of the test structure of the SS-QoL (6–9). These inconsistent findings in construct validity did not confirm the proposed structure of 12 domains and leave a choice for clinicians and researchers to use various subscale scores or the total score only. Reports on responsiveness of the SS-QoL have ranged from non-responsiveness to moderate responsiveness (2, 10) and no consensus has been reached.
Owing to the burden of administration, Post et al. (11) proposed a short form of the Dutch version SS-QoL in the basis of a two-factor model of the SS-QoL (9). The item with the highest item-total correlation within the 12 domains was selected, and the 12 chosen items were grouped into physical and psychosocial domains. The two-domain with 12-item version (SS-QoL-12) was found to be highly correlated to the original SS-QoL, and the two subscales and the whole scale had good internal consistency (11). However, no studies to date have validated their findings or reported the psychometric and clinimetric properties of the SS-QoL-12 in patients after stroke.
Although the SS-QoL has good psychometric and clinimetric properties, it is not necessary that the SS-QoL-12 demonstrates the same measurement properties as the SS-QoL. The removal of items might jeopardize one or more important aspects of the original scale, resulting in different measurement properties between a shortened version and the original scale (12). Thus, the measurement properties of the SS-QoL may not be generalized to the SS-QoL-12, and it warrants further investigations before the SS-QoL-12 can be recommended for use.
The purpose of the present study was to evaluate the psychometric properties, including the construct and criterion-related validity and the reliability and responsiveness of the SS-QoL-12. The primary issues for study of construct validity in this study were: (i) the dimensionality underlying the SS-QoL-12, (ii) the validity of the category scoring system (termed as rating scale diagnostics), (iii) the fit of individual items to understand if all items appropriately reflect the underlying dimensions of SS-QoL-12 in stroke patients, and (iv) potential bias of items by the time since stroke onset and assessment time. The Rasch measurement model, investigating the dimensionality of an instrument to support the construct validity of an instrument, has been widely applied in medical outcome measures. Since the psychometric properties of the SS-QoL-12 have only been assessed using the traditional test theory, this study conducted the Rasch measurement model to examine the construct validity of the SS-QoL-12. Given the diverse findings on SS-QoL being unidimensional or multidimensional, SS-QoL-12 might also represent one dimension or two dimensions including physical and psychosocial ones.
The criterion-related validity was evaluated using the associations between the SS-QoL-12, ADL performance and upper extremity (UE) motor function before and after treatment. Reliability was examined using the Rasch measurement model. Finally, responsiveness was examined in changes of the proposed two subscales and the whole scale from pretreatment to post-treatment.
METHODS
Participants
Patients with moderate to mild dysfunction of their UE were recruited from 7 study sites in Taiwan. All participants were enrolled in our ongoing research project to study the efficiency of motor rehabilitation. The inclusion criteria included: (i) first-ever stroke, (ii) demonstration of Brunnstrom stage II or higher for the proximal and distal parts of the affected upper limb (13), (iii) no severe cognitive deficits (Mini-Mental State Examination score > 21) (14), and (iv) ability to understand the study and respond to questions. Exclusion criteria were: (i) excessive spasticity at any joint of the arm (Modified Ashworth Scale score < 2), and (ii) severe physician-determined medical problems (e.g. severe aphasia, a vision problem, or poor physical condition). The present study was approved by the human ethics committees at each participating site. All participants provided written informed consent.
Design and interventions
Eligible participants were randomly assigned to 1 of 3 treatment groups: distributed constraint-induced therapy (dCIT), bilateral arm training (BAT), and conventional rehabilitation. All participants received 2 h of therapy every weekday for 3–4 weeks. Three certificated occupational therapists were trained to administer the training protocol, and 3 independent evaluators blinded to the participant group evaluated patients’ functional status before and after treatment.
Measures
Measures used in the present study were the SS-QoL-12 and criterion measures, including the Functional Independence Measure (FIM), the Motor Activity Log (MAL), the Nottingham Extended Activities of Daily Living Scale (NEADL), and the Frenchay Activities Index (FAI). The 4 criterion measures showed sound psychometric properties in patients with stroke (15–18).
The SS-QoL-12 includes 12 items grouped into physical and psychosocial subscales. Performance is scored on a 5-point scale to indicate the amount of help required to complete a task (from total help to no help needed), the amount of trouble experienced when performing a task (from could not do it at all to no trouble at all), or the agreement on a statement about functioning (from strongly agree to strongly disagree). Higher scores indicate better function. Subscale scores are the mean of the item scores, and the total score is the mean of the subscale scores.
The FIM is commonly used to assess functional performance in stroke patients (19). It consists of 18 items encompassing two subscales (motor and cognition), with each item graded on a 7-point scale. Higher ratings indicate greater independence, with total scores ranging from 18 to 126.
The MAL assesses self-perceived use of the affected limb in daily life. Patients report the amount of use (AOU) and the quality of movement (QOM) for the affected upper limb in 30 activities of daily living. Each task is scored on a 6-point scale, from 0 to 5.
The NEADL involves 22 ADL tasks encompassing 4 subsections (mobility, kitchen, domestic, and leisure) (16). Activities performed by patients on their own or on their own with difficulty are scored as 1, and those the patients are not able to perform, or for which help is needed, are scored as 0. A total score is the sum of scores on each task, and the range is 0 to 22.
The FAI consists of 15 items and has been widely used to assess complex activities in everyday life living (18). The FAI usually takes a few minutes to complete and is very easy to administer (18). Tasks are scored on a 4-point scale, and the total scores range from 0 to 60.
Data analysis
We administered the original 49-item SS-QoL to the study participants, but focused on the 12 chosen items of the SS-QoL (termed SS-QoL-12) in the present research. The SS-QoL-12 subscale and total scores were computed for investigations of criterion validity and responsiveness.
Construct validity and reliability. The dimensionality of the SS-QoL-12 was examined first using the unidimensional Rasch model. This model assumes that the items of a scale combine to measure a unidimensional concept, which can be examined via principal component analysis (PCA) of the residuals using the following criteria: the Rasch dimension explaining at least half of the variance (20) and the eigenvalue of the first residual factor (the largest component of the unexplained variance in the data) less than 1.40 (21). In addition, the comparison between the Rasch factor (the variance explained by the items) and the first residual factor identifies possible multidimensionality (20). Winsteps 3.70 was chosen for conducting the unidimensional Rasch model.
If the unidimensionality was violated, this study would proceed to investigate the number of dimensions of the SS-QoL-12 using the multidimensional Rasch model to determine whether the proposed two-factor model fit the data better than the one-factor model. The multidimensional Rasch model is essentially confirmatory in nature, where items are pre-assigned to dimensions based on some theoretically grounded hypotheses. When a scale consists of more than one subscale, the multidimensional Rasch model, compared with the unidimensional Rasch model, provides more precise estimates of reliability for each dimension (22) by simultaneously calibrating all subscales and specifying multiple underlying traits of a scale (23). The present study used the multidimensional random coefficient multinomial logit (MRCML) model (24), a straightforward extension of the unidimensional Rasch model designed to implement the multidimensional case of a wide range of Rasch models. ConQuest version 2.0 (Australian Council for Educational Research, Camberwell, Australia) (25) was selected for the examination of the two proposed models in this study. The χ2 difference tests were used to determine which model fit the data best:
χ2difference = |d1–d2|/df difference, where d is deviance. When the χ2 difference test was significant, the model with a smaller value of deviances was considered a better model than the other.
Once the best model was determined, local item dependence was examined by inspecting the inter-item residual correlation matrix in individual factors. A residual correlation between a pair of items within a domain greater than 0.30 indicated minimal local dependence (26).
The 5-point scale was evaluated using a rating scale model (27). An ideal scoring scale should have the following characteristics: “frequency of use” of each rating category (the number of persons scored in that particular category) exceeding 10 times; “observed person measures” increasing monotonously, which means that the average participant’s quality of life should increase from a low category representing low ability to one representing high ability; “threshold measure” increasing as the scoring category increases. If a scoring category failed to meet these criteria, reorganizing the scoring category would be considered.
Fit of individual items is examined using mean square (MnSq) and the corresponding T fit statistics. MnSq and T statistics indicate that how much the residuals vary relative to the expected variance. The weighted (infit) and unweighted (outfit) are used to summarize unexpected responses. If an item fits the model, it would be expected that both infit and outfit MnSqs are approximately 1. There have been different views regarding the type of cut-off criteria that should be used and whether the criteria are related to sample size. Wright et al. (28) suggested that the reasonable MnSq fit values range between 0.7 and 1.3 for multiple-choice questionnaire, 0.6 and 1.4 for rating scale (survey), and 0.5 and 1.7 for clinical observation. The 3 criteria have been used in stroke rehabilitation research (29–31). However, Wang & Chen (32) found that, when the sample sizes were as small as 200, the maximum of MnSqs could be as large as 2.54 and the commonly used 0.7–1.3, or 0.6–1.4 critical ranges were so harsh that many good items would be identified as misfitting items. ConQuest suggested using a 95% confidence interval (CI) of the expected MnSq value (which under the null hypothesis is 1.0) for the acceptable range of fit statistics. Since ConQuest was used in the present study, we employed the suggestions from ConQuest. If the MnSq falls outside the 95% CI, the absolute value of the corresponding T statistics will exceed 2 and the null hypothesis that an item fits the Rasch model is rejected (25). An item then is considered misfit. If an item had an MnSq higher than 2.0 that would distort or degrade the whole measurement, it would be removed from the scale (28).
Item biases related to time since onset and assessment time were examined using differential item functioning (DIF) analysis. DIF is an indicator when different subgroups within the sample with equal levels of quality of life respond in a different manner to an individual item. When DIF is present, responses to the SS-QoL-12 are influenced by nuisance factors and the SS-QoL-12 might not be able accurately to assess stroke patients’ quality of life. The significant χ2 of the overall SS-QoL-12 indicates the existence of DIF. While the result has shown the existence of DIF in an item, the magnitude of a difference between item difficulty estimates for subgroups is determined by a Bonferroni-corrected significance level less than 0.05/12 = 0.004.
The item-person map was plotted to depict the relationship between item difficulty and person ability. For a well-targeted measure (neither too difficult nor too easy), the mean person ability and the mean item difficulty should be relatively close to each other (termed as targeting) (33). Also, items need to be well spread over the entire range of patients’ report in quality of life. Test reliability was estimated using person (separation) reliability of the whole test and Expected A Priori (EAP) reliability of the subscales (25). A value of 0.90 represented an excellent level, 0.80 was moderate, and 0.70 was acceptable (34).
Criterion-related validity. Spearman’s rank correlation coefficients (ρ) were calculated to investigate the concurrent validity by relating the subscale and total scores of the SS-QoL-12 with criterion measures before and after treatment, and to estimate the predictive validity between the SS-QoL-12 subscale and total scores at baseline and the criterion measures at post-treatment. Correlations below 0.25 were considered low, 0.25–0.50 fair, 0.50–0.75 moderate to good, and above 0.75 good to excellent (35).
Responsiveness. The paired t-test and the standardized response mean (SRM) were used to estimate responsiveness. The paired t-test was used to indicate whether statistically significant changes occurred from pre- to post-treatment. The SRM is defined as the ratio of the mean change score to the standard deviation (SD) of the change score. The Cohen’s d was used to classify the values of SRM as non-responsive (< 0.2), mildly responsive (0.2–0.5), moderately responsive (0.5–0.8), and markedly responsive to change (> 0.8) (36).
RESULTS
A total of 126 eligible patients, providing complete data at pre- and post-treatment, were included in the present study. Participants had a mean age of 55.26 years, and 71.4% were men. The clinical and demographic characteristics of the patients are listed in Table I. The 3 treatment groups did not show significant differences in mean ages, time since stroke onset, and the SS-QoL-12, the FIM, the MAL, and the NEADL baseline scores (F = 0.002–2.29, p > 0.05).
|
Table I. Clinical and demographic characteristics of the participants (n = 126)
|
|
Characteristics
|
Value
|
|
Gender, n (%)
|
|
|
Male
|
92 (73)
|
|
Female
|
34 (27)
|
|
Age, years, mean (SD)
|
55.26 (11.78)
|
|
Side of hemiplegia, n (%)
|
|
|
Right
|
60 (47.62)
|
|
Left
|
66 (52.38)
|
|
Stroke type, n (%)
|
|
|
Haemorrhage
|
45 (35.71)
|
|
Infarction
|
50 (39.68)
|
|
Ischaemic
|
27 (21.26)
|
|
Unknown
|
4 (3.17)
|
|
Time since stroke, months, mean (SD)
|
16.87 (16.1)
|
|
SS-QoL-12 at pretreatment, mean (SD)
|
|
|
Total
|
3.57 (0.72)
|
|
Psychosocial domain
|
4.09 (0.72)
|
|
Physical domain
|
3.04 (0.96)
|
|
SS-QoL-12 at post-treatment, mean (SD)
|
|
|
Total
|
3.68 (0.70)
|
|
Psychosocial domain
|
4.12 (0.73)
|
|
Physical domain
|
3.21 (0.91)
|
|
SD: standard deviation; SS-QoL-12: short form of the Stroke-Specific Quality of Life.
|
Construct validity and reliability
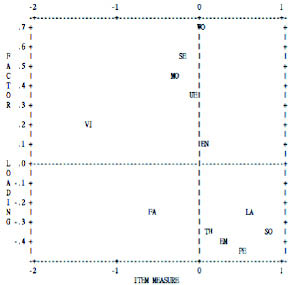
Data at baseline and after treatment were combined to investigate the construct validity and reliability of the SS-QoL-12. PCA of residuals showed that the Rasch dimension explained 42.6% of the variance in the data, and the first residual factor had an eigenvalue of 1.9, representing 9.1% of the variance. The variance explained by the items (28.6%) was only 3 times the variance explained by the first contrast (9.1%). It is evident from Fig. 1 that the majority of items within the psychosocial subscale are clearly separated from most items of the physical subscale. There was a noticeable secondary dimension in the items (20), and the unidimensionality assumption was violated. Therefore, we proceeded to test the number of dimensions of the SS-QoL-12.
Fig. 1. Principal component analysis of the standardized residuals for all 12 items. The first residual factor explains 1.9 of 12 residual variance units. Items are listed by corresponding patient and detailed item descriptions are listed in Table III.
A significant χ2 difference test indicated that the two-factor model had significantly smaller deviances than the one-factor model. The two-factor solution significantly fit the data better than the one-factor model. It was concluded that the two-factor model was a better model to depict quality of life in patients with stroke than the one-factor model (Table II). Only the two-factor model was examined in the following analyses.
|
Table II. Fit indices of 2 models
|
|
|
1-factor model
|
2-factor model
|
Revised 2-factor model
|
|
Deviances
|
7,883.56
|
7,853.93
|
4,738.41
|
|
Parameters
|
16
|
18
|
16
|
|
Degrees of freedom
|
230
|
228
|
230
|
|
Person (separation) reliability of the whole test
|
0.996
|
0.991
|
0.988
|
|
Reliability for the individual domain
Psychosocial
Physical
|
|
0.74
0.69
|
0.71
0.67
|
|
The difference between the 2-factor model and the revised 2-factor model lies in that the revised model was based on a 3-point scale instead of a 5-point scale used in the 2-factor model.
|
No residual correlations between pairs of items within a subscale exceeded 0.3. The assumption of local item independence held. Rating category diagnostics showed disorderings of the step difficulty between the ratings 3 and 4 and between 4 and 5, and the outfit MnSq of the rating 4 exceeding 2 with a ZSTD value greater than 2. The 5-point scale was recoded into a 3-point scale: (1 = 1; 2, 3 = 2; 4, 5 = 3). Re-analysis indicated the revised scale met all essential criteria and functioned properly.
All but one item demonstrated acceptable infit and outfit MnSq (0.84–1.21) at 95% CI (Table III). “Did you have trouble seeing the television well enough to enjoy a show?” had an infit MnSq outside the range of the 95% CI, but not exceeding the removal criterion of 2. No items exhibited DIF. Responses to the SS-QoL-12 items were not biased by the time since stroke onset and assessment time. The decision to combine the data collected before and after treatment was supported.
|
Table III. Item-fit statistics
|
|
Item
|
Patient
|
Estimate
|
Error
|
Infit
|
Outfit
|
|
MnSq
|
95% CI
|
T
|
MnSq
|
95% CI
|
T
|
|
Psychosocial domain
|
|
|
|
|
|
|
|
|
|
|
I was too tired to do what I wanted to do.
|
EN
|
–0.65
|
0.08
|
1.05
|
(0.83–1.17)
|
0.6
|
1.03
|
(0.83–1.17)
|
0.4
|
|
I felt I was a burden to my family.
|
FA
|
0.47
|
0.07
|
0.99
|
(0.83–1.17)
|
–0.1
|
1.00
|
(0.86–1.14)
|
0.0
|
|
I was discouraged about my future.
|
EM
|
–0.25
|
0.07
|
0.93
|
(0.82–1.18)
|
–0.7
|
0.93
|
(0.84–1.16)
|
–0.8
|
|
My personality has changed.
|
PE
|
0.26
|
0.07
|
0.97
|
(0.83–1.17)
|
–0.3
|
0.97
|
(0.86–1.14)
|
–0.4
|
|
My physical condition interfered with my social life.
|
SO
|
0.76
|
0.07
|
1.11
|
(0.83–1.17)
|
1.2
|
1.11
|
(0.86–1.14)
|
1.5
|
|
I had trouble remembering things.
|
TH
|
–0.59
|
0.16
|
0.95
|
(0.83–1.17)
|
–0.6
|
0.93
|
(0.83–1.17)
|
–0.8
|
|
Physical domain
|
|
|
|
|
|
|
|
|
|
|
Did you have to repeat yourself so others could understand you?
|
LA
|
–0.32
|
0.09
|
1.07
|
(0.83–1.17)
|
0.9
|
1.17
|
(0.74–1.26)
|
1.2
|
|
Did you have to stop and rest more than you would like when walking or using a wheelchair?
|
MO
|
0.16
|
0.09
|
0.96
|
(0.83–1.17)
|
–0.5
|
0.90
|
(0.78–1.22)
|
–0.9
|
|
Did you need help taking a bath or a shower?
|
SE
|
0.38
|
0.08
|
1.10
|
(0.83–1.17)
|
1.1
|
1.07
|
(0.80–1.20)
|
0.7
|
|
Did you have trouble buttoning buttons?
|
UE
|
0.63
|
0.08
|
0.99
|
(0.83–1.17)
|
0.0
|
1.05
|
(0.81–1.19)
|
0.5
|
|
Did you have trouble seeing the television well enough to enjoy a show?
|
VI
|
–1.64
|
0.10
|
1.23
|
(0.83–1.17)
|
2.5
|
1.21
|
(0.51–1.49)
|
0.9
|
|
Did you have trouble doing daily work around the house?
|
WO
|
0.79
|
0.20
|
0.84
|
(0.83–1.17)
|
–1.8
|
0.90
|
(0.82–1.18)
|
–1.2
|
|
MnSq: mean square; CI: confidence interval; T: T statistics.
|
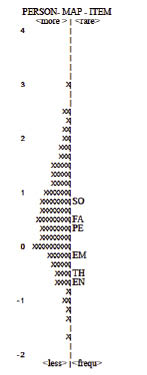
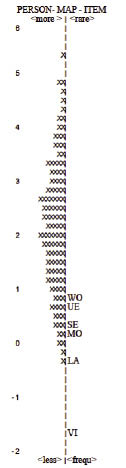
Fig. 2 suggested that the most difficult item of the psychosocial subscale was “My physical condition interfered with my social life,” and the least difficult 1 was “I was too tired to do what I wanted to do.” For the physical subscale (Fig. 3), the most difficult task was “Did you have trouble doing daily work around the house?” and the easiest was “Did you have trouble seeing the television well enough to enjoy a show.” For the psychosocial subscale, the mean person ability was 0.57 logit (standard deviation (SD) 0.059), close to the mean item difficulty (logit = 0.00), and items covered a substantial range of patients’ psychosocial functions. The mean person ability for the physical subscale was 2.15 logit (SD 0.077), significantly higher than the mean item difficulty (logit = 0.00). Most participants in the present study had physical function higher than 1.00 logit, but the most difficult item within the physical domain showed an average item difficulty of 0.79 logit. These findings indicated that items within the physical domain only covered our samples with less physical function, but were not able to detect physical function in majority of our participants who had physical function higher than 1.0 logit. The correlation between the two domains was 0.78. Reliability was 0.99 overall, 0.71 for the psychosocial and 0.67 for the physical domain.
Fig. 2. The column of numbers to the left is logit. “×” represents 2.2 participants. ×s to the left of the first line represent distributions of person ability in the psychosocial subscale. The most able people and the most difficult items are at the top, and vice versa. Items are listed by corresponding patient, and detailed item descriptions are listed in Table III.
Criterion-related validity
The concurrent validity and predictive validity of the two subscales and the whole scale of the SS-QoL-12 were examined respectively in the present study. Table IV lists the concurrent validity at pretreatment and post-treatment, and Table V summarizes the findings of predictive validity.
|
Table IV. Concurrent validity
|
|
Measures
|
FIM
Value (95% CI)
|
NEADL
Value (95% CI)
|
MAL-AOU
Value (95% CI)
|
MAL-QOM
Value (95% CI)
|
FAI
Value (95% CI)
|
|
Pretreatment
|
|
|
|
|
|
|
Total
|
0.40 (0.23–0.54)**
|
0.36 (0.19–0.50)**
|
0.28 (0.11–0.43)**
|
0.30 (0.13–0.45)**
|
0.36 (0.20–0.50)**
|
|
Psychosocial domain
|
0.24 (0.05–0.43)*
|
0.20 (0.02–0.36)*
|
0.24 (0.05–0.40)**
|
0.28 (0.10–0.44)**
|
0.22 (0.06–0.38)*
|
|
Physical domain
|
0.49 (0.34–0.61)**
|
0.42 (0.24–0.56)**
|
0.23 (0.06–0.39)**
|
0.19 (0.03–0.35)*
|
0.40 (0.22–0.54)**
|
|
Post-treatment
|
|
|
|
|
|
|
Total
|
0.46 (0.61–0.61)**
|
0.54 (0.41–0.64)**
|
0.39 (0.23–0.53)**
|
0.40 (0.24–0.54)**
|
0.52 (0.37–0.64)**
|
|
Psychosocial domain
|
0.31 (0.12–0.47)**
|
0.39 (0.24–0.53)**
|
0.35 (0.19–0.49)**
|
0.34 (0.18–0.49)**
|
0.38 (0.22–0.54)**
|
|
Physical domain
|
0.49 (0.35–0.62)**
|
0.56 (0.41–0.68)**
|
0.31 (0.15–0.47)**
|
0.34 (0.18–0.49)**
|
0.50 (0.35–0.63)**
|
|
*p < 0.05, **p <0.01.
FIM: Functional Independence Measure; MAL-AOU: Motor Activity Log Amount of Use; MAL-QOM: Motor Activity Log Quality of Movement; NEADL: Nottingham Extended Activities of Daily Living Scale; FAI: Frenchay Activities Index; CI: confidence interval.
|
|
Table V. Predictive validity
|
|
Post-treatment measures
|
FIM
Value (95% CI)
|
NEADL
Value (95% CI)
|
MAL-AOU
Value (95% CI)
|
MAL-QUM
Value (95% CI)
|
FAI
Value (95% CI)
|
|
SS-QoL-12
|
|
|
|
|
|
|
Total
|
0.46 (0.30–0.59)**
|
0.43 (0.28–0.57)**
|
0.34 (0.17–0.49)**
|
0.34 (0.17–0.50)**
|
0.38 (0.21–0.52)**
|
|
Psychosocial domain
|
0.32 (0.13–0.49)**
|
0.26 (0.08–0.41)**
|
0.32 (0.16–0.48)**
|
0.32 (0.14–0.47)**
|
0.22 (0.04–0.38)*
|
|
Physical domain
|
0.52 (0.38–0.64)**
|
0.50 (0.33–0.63)**
|
0.26 (0.08–0.41)**
|
0.26 (0.08–0.42)**
|
0.44 (0.27–0.58)**
|
|
*p < 0.05, **p < 0.01.
FIM: Functional Independence Measure; MAL-AOU: Motor Activity Log Amount of Use; MAL-QOM: Motor Activity Log Quality of Movement; NEADL: Nottingham Extended Activities of Daily Living Scale; FAI: Frenchay Activities Index; CI: confidence interval.
|
At pretreatment, the overall performance in the SS-QoL-12 depicted fair correlations with the criterion measures (ρ = 0.28–0.40, p < 0.01). The psychosocial subscale showed fair relations with MAL-QOM, and low with others (ρ = 0.20–0.24, p < 0.05). Correlations of the physical subscale were fair with FIM, NEADL and FAI (ρ = 0.40–0.49, p < 0.01) and low with MAL (ρ = 0.19–0.23, p < 0.05). At post-treatment, the whole scale of SS-QoL-12 had fair relations with FIM and MAL (ρ = 0.39–0.46, p < 0.01) and moderate to good relations with NEADL and FAI (ρ = 0.52–0.54, p < 0.01). The psychosocial subscale showed fair correlations with the criteria (ρ = 0.31–0.39, p < 0.01). The correlations of the physical subscale were fair with FIM, FAI, and MAL (ρ = 0.31–0.50, p < 0.01) and moderate to good with NEADL (ρ = 0.56, p < 0.01).
The overall score at pretreatment showed fair predictions with the 4 outcomes after treatment (ρ = 0.34–0.46, p < 0.01). The psychosocial subscale had low to fair predictions (ρ = 0.22–0.32) at post-treatment. Predictions for the physical subscale were fair with the NEADL, FAI, and MAL (ρ = 0.26–0.50, p < 0.01) and good with FIM (ρ = 0.52, p < 0.01).
Responsiveness
The whole scale and the psychosocial subscale were mildly responsive to changes after treatment (SRM = 0.22); the physical subscale was not responsive (SRM = 0.08). The pretreatment to post-treatment changes assessed by the psychosocial subscale and the whole scale were statistically significant (t = 2.53–2.54, p = 0.01), but not significant in the physical subscale (t = 0.88, p = 0.38). The 3 groups did not show significant differences in changes from pretreatment to post-treatment (F = 2.26, p > 0.05).
DISCUSSION
To our knowledge, the present study is the first to investigate the construct validity and reliability of the short SS-QoL (SS-QoL-12) using both traditional and modern psychometric approaches. It is also the first to evaluate the responsiveness of the SS-QoL-12 in a stroke population.
The results reveal that the SS-QoL-12 includes two domains (psychosocial and physical) (11). The two domains and the overall performance on the SS-QoL-12 showed different degrees of criterion-related validity and responsiveness before and after treatment. These findings confirmed using the total score to comprehensively describe patients’ perception of their quality of life as well as using the subscale scores depending on the evaluation or research purposes. Together with the acceptable to excellent reliability of the subscales and the whole scale, the SS-QoL-12 is a valid and reliable measure for assessing different aspects of functional status in patients with stroke.
This study advanced our knowledge of the dimensionality of the SS-QoL-12 using the Rasch measurement model. The SS-QoL-12 tasks work consistently to measure participants’ psychosocial and physical functions, which are related to each another (11). The original 5-point scale was recommended to be revised to 3 rating categories when the SS-QoL-12 is administered on patients with mild to moderate UE impairment after stroke. Fewer rating categories not only simplify the reporting process and reduce participant frustration (37), but also enhance the ability to distinguish patients’ perceived quality of life after stroke.
Responses to the SS-QoL-12 task reflected patients’ perceptions of their quality of life, which were not biased by assessment time-points and the time since stroke onset. Items requiring more independent functional ability or complex interaction between physical and social situations were found to be difficult to perform or to endorse, such as “Did you have trouble doing daily work around the house?” in the physical subscale, and “My physical condition interfered with my social life” in the psychosocial subscale. Only one task, “Did you have trouble seeing the television well enough to enjoy a show?” showed misfit. Patients may have different levels of difficulty in understanding the meaning expressed in TV programmes due to language or perceptual problems, which might result in the misfit. However, this item neither exceeded the removal criterion nor showed DIF, and it might not be appropriate to remove it from the SS-QoL-12 without further investigations with a larger sample size or in patients with various levels of UE motor impairment.
From the person-item map (Figs 2 and 3), it is obvious that the persons were quite evenly distributed along the linear logit psychosocial scale and had a centre around logit 0, whereas the majority of patients showed positive logit along the physical scale with a centre around logit 2. That is, the items of the psychosocial subscale targeted patients’ psychosocial function well, but the items of the physical subscale did not. The physical items seemed to be quite easy for stroke patients with mild to moderate impairment of UE motor function. Our samples started with a high level of physical condition at baseline (4.08 of 5 points in the physical subscale), and the items of the physical subscale might not be difficult enough to detect significant improvement. As a result, our findings showed the non-responsiveness to changes after treatment in the physical subscale. Future studies might add difficult items to capture moderate to high levels of physical function in stroke patients.
Fig. 3. The column of numbers to the left is logit. “×” represents 2.2 participants. ×s to the left of the second line represent distributions of person ability in the physical subscale. The most able people and the most difficult items are at the top, and vice versa. Items are listed by corresponding patient, and detailed item descriptions are listed in Table III.
The SS-QoL-12 and the psychosocial subscale were mildly responsive to changes after treatment, but the physical subscale was less responsive to changes after treatment, compared with the overall score or the psychosocial subscale. It is possible that the physical subscale contains items with low difficulty levels and our participants had high level of physical function. The psychosocial subscale or the overall performance might be a better indicator in the evaluation of treatment effects of stroke rehabilitation. In addition, compared with the SS-QoL (10), the SS-QoL-12 was more responsive to changes after treatment.
The present study extended the validation study by Post et al. (11) to support the similarities between the SS-QoL-12 and the SS-QoL in terms of criterion validity (9, 10). Also, our findings indicated that a total and subscale scores of the SS-QoL-12 might have different levels of validity. The physical subscale showed the highest correlations with ADL performance, whereas the whole scale had the highest correlations with UE motor function. The psychosocial subscale did not demonstrate the same criterion-related validity as the physical subscale or the whole scale. These findings may suggest using an overall and subscale performance of the SS-QoL-12 in accordance with the purpose of research or evaluations. If the study goal is to report the general quality of life or UE motor function in everyday activities in stroke patients, the use of an overall score is recommended. For predicting or evaluating patients’ ADL performance, the physical subscale might work better than the psychosocial subscale or the whole scale.
A few limitations of the present study warrant consideration. Data in this study were drawn from patients with mild to moderate upper extremity dysfunction and without cognitive impairment, and as a result, the psychometric properties of the SS-QoL-12 and the use of the 3-point revised scale might not be generalized to patients with severe UE dysfunction or with cognitive impairment. Future studies including patients with severe UE dysfunction or larger sample size are required to validate our findings.
Secondly, there is no stringent gold standard for selecting a criterion measure in the analysis of criterion-related validity. This study chose performance in ADLs and UE motor function to examine the validity of the SS-QoL-12, and they might be more related to physical function than psychosocial function. To provide further evidence for the validity, further research may use criterion measures, such as the Reintegration to Normal Living Index (RNLI) (38) or Leisure Satisfaction Scale (39) to reflect the psychosocial aspect.
In conclusion, evidence of validity, reliability and responsiveness is vital for the SS-QoL-12, as with any outcome measures used in rehabilitation, to ensure confidence in its scientific robustness. The two-factor model provided a better description of the SS-QoL-12 measurement structure. All but 1 SS-QoL-12 items work consistently to measure quality of life in stroke patients, and the reliability of the two subscales and the whole scale was at acceptable to excellent levels. Different degrees of the concurrent and predictive validity and responsiveness of the subscales and the whole scale suggest using the domain and total scores to indicate patients’ functional status related to health. Despite the misfit item, the overall findings provide an encouraging starting point for measuring and interpreting scores or changes in quality of life of stroke patients using the SS-QoL-12. Further investigations using a larger sample with a broad range of dysfunction are needed to validate the findings.
ACKNOWLEDGEMENTS
This project was supported in part by the National Health Research Institutes (NHRI-EX100-9920PI and NHRI-EX100-10010PI), the National Science Council (NSC 97-2314-B-002-008-MY3, NSC 99-2314-B-182-014-MY3, and NSC 100-2314-B-002-008-MY3), and the Healthy Ageing Research Center (EMRPD1A0891) at Chang Gung University. Hui-fang Chen conducted this research when being a post-doctoral fellow at Chang Gung University.
REFERENCES