BACKGROUND: The aim of this study was to assess the prevalence of undernutrition in patients in Dutch rehabilitation centres and to measure the diagnostic accuracy of available screening tools.
METHODS: This cross-sectional multicentre study was conducted in 11 rehabilitation centres in The Netherlands. Patient’s nutritional status was determined by the amount of weight loss during the last 1, 3 and 6 months and body mass index (BMI). Diagnostic accuracy was assessed for 5 screening tools: Short Nutritional Assessment Questionnaire (SNAQ), Short Nutritional Assessment Questionnaire Residential Care (SNAQRC), SNAQ65+, Malnutrition Universal Screening Tool and Mini nutrition Assessment-short form.
RESULTS: Twenty-eight percent of the patients were severely undernourished and 10% were moderately undernourished. In the undernourished group, 28% were overweight (BMI 25–30) and 19% were obese (BMI > 30). The SNAQ65+ is the recommended screening tool due to its high diagnostic accuracy (sensitivity 96%, specificity 77%, positive predictive value 62%, negative predictive value 90%) and quick and easy use. The MNA had the worst diagnostic accuracy, with a sensitivity of 44%.
CONCLUSION: The prevalence of undernutrition in patients in Dutch rehabilitation centres is high. Almost half of the undernourished patients were overweight or obese. Therefore, it is important not only to screen for undernutrition, but also carefully to assess possible overweight/obesity in every undernourished rehabilitation patient.
Key words: undernutrition; nutritional status; screening; rehabilitation.
J Rehabil Med 2012; 44: 696–701
Correspondence address: Dorijn Hertroijs, Faculty of Earth and Life Sciences, VU University, 1007 MB Amsterdam, The Netherlands. E-mail: d.hertroijs@rdgg.nl, dfh239@nyu.edu
Submitted July 1, 2011; accepted February 13, 2012
Introduction
Undernutrition prevalence rates are high in many Dutch healthcare settings (hospitals, outpatient clinics, nursing homes and residential homes) and vary between 17% and 25% (1). In the general population ≥ 65 years of age, between 15% and 24% is undernourished (2). Undernutrition can be defined as a state of nutrition in which a deficiency or imbalance of energy, protein and other nutrients causes measurable adverse effects on tissue or body form, function, and clinical outcome (3). This state of nutrition is often seen in persons who are ill, have undergone surgery, have a decreased appetite or have difficulties chewing and swallowing (1, 4). Body mass index (BMI) (weight/height2) and percentage weight loss can be used to provide a good indication of undernutrition (5).
Undernutrition can lead to slower recovery from disease and injury, more and severe complications and a decrease in muscle mass, thereby increasing morbidity and mortality (6, 7). Furthermore, undernutrition is associated with increased healthcare costs (8–11).
The prevalence of undernutrition in patients admitted to rehabilitation centres is not as well established as in the other healthcare settings. Many authors study only one patient group, only include those ≥ 60 years, or use the Mini Nutritional Assessment (MNA) when defining undernutrition. Poels et al. (12) assessed the prevalence of undernutrition in 114 Dutch stroke rehabilitation patients. Criteria for undernutrition were based on weight loss and BMI. On admittance, undernutrition was present in 35% of the patients and decreased to 3% after 4 weeks of rehabilitation. In total, 43% of all patients had one or more eating difficulty (swallowing, spreading, not sitting upright, etc.) and 16% needed help with eating (12). This study only measured the prevalence of undernutrition in a specific group of rehabilitation patients. Rehabilitation centres in the Netherlands include a broad range of patients, who vary in age, disease and treatment. Therefore, gaining insight into the prevalence of undernutrition in a more varied population is valuable. Only one study assessed this prevalence in rehabilitation centres using a large sample of patients with different diagnoses (13). Using the MNA, 33% of the 2,076 patients aged ≥ 65 years were undernourished and 52% were at risk for undernutrition (13).
Screening is important for the early detection of patients who are undernourished or at risk of developing undernutrition. Since January 2010, the Dutch Health Care Inspectorate (HCI) has defined undernutrition as a main care problem in rehabilitation centres, by establishing it as a Performance Indicator for Risk Steering Supervision. Dutch rehabilitation centres are now obligated to screen all rehabilitants for undernutrition on admission and to have a general treatment plan for undernourished patients (14). The Short Nutritional Assessment Questionnaire (SNAQ) is the recommended screening tool in this benchmark. However, various screening tools have been developed to detect a patient’s nutritional status in many healthcare settings, but not in the rehabilitation setting. In the Netherlands, the SNAQ (14) and the Malnutrition Universal Screening Tool (MUST) (6) are used for the hospital situation (5, 6). The SNAQ Residential Care (SNAQRC) (15) and the SNAQ65+ (2) are designed for older (≥ 65 years old) people living in, respectively, residential homes and at home. The MNA and its short version (MNA-sf) are also developed for older persons (16). To reduce the prevalence of undernutrition, it is important to screen for it accurately. Therefore, all of the mentioned screening tools were tested for diagnostic accuracy in the rehabilitation population.
The aim of this study was to measure the prevalence of undernutrition in various rehabilitation centres throughout the Netherlands and to assess the diagnostic accuracy of the SNAQ, MUST, SNAQRC, SNAQ65+ and the MNA-sf for the patients in these centres.
Methods
Nutritional status
This cross-sectional multicentre study was carried out between 22 September and 25 November 2010 in 11 of the 23 Dutch rehabilitation centres (17).
Patients were defined as severely undernourished when they met one or more of the following criteria: BMI < 18.5 (or BMI < 20 for patients age ≥ 65 years) and/or > 5% unintentional weight loss in the past month and/or > 10% unintentional weight loss in the past 6 months. Patients age ≥ 65 years were defined as moderately undernourished if they met the following criteria: BMI 20–22 and/or 5–10% unintentional weight loss in the past 6 months. Patients age < 65 years were defined as moderately undernourished with a BMI 18.5–20 and 5–10% unintentional weight loss in the past 6 months (4, 14, 18).
Subjects
Patients were asked if they were willing and able to participate. In 6 rehabilitation centres the reason for refusal was recorded for 56 patients. Twenty-eight (52%) did not want to participate, 11 (20%) patients had aphasia, 7 (13%) were busy with activities or had visitors, 5 (9%) were not feeling well, 3 (7%) were in the hospital and 2 (4%) were not able to speak Dutch or English.
If patients were willing and able to participate they completed a questionnaire, which included questions from the 5 screening tools. In addition, their body weight, knee height and mid-upper arm circumference (MUAC) were measured.
A total of 447 patients answered the questionnaire. Of these, 81 patients (18%) were excluded because nutritional status could not be assessed in one or more nutritional screening tools due to missing data. These patients had incomplete data on current weight (n = 11), height (n = 1) and weight loss during the last month, 3 and/or 6 months (n = 69). Reasons for not being able to measure a patient’s weight were: bed rest, decubitus ulcer and refusal to be weighed. Included were 366 patients (mean age 55 years, 40% female).
The study was approved by the ethics review board of the VU University Medical Center.
Screening tools
A self-administered questionnaire was used to register demographic data, reason for admission and nutritional items included in the SNAQ, SNAQRC, SNAQ65+, MUST and MNA-sf. They all consist of 3 nutritional status categories: well-nourished, moderately undernourished and severely undernourished (SNAQ, SNAQRC and MNA-sf) or either low risk, medium risk and high risk of undernutrition (MUST). The SNAQ65+ however, consists of “undernourished”, “at risk for undernutrition” and “well-nourished” categories. The “at risk for undernutrition” category is based on functionality and appetite, which have been identified as risk factors for the development of undernutrition (19).
Anthropometric measures
Body weight, knee height and the MUAC, were measured by a dietician, a trained nurse or nutritional assistant. Body weight (kg) was measured on calibrated standing scales, sitting balance scales or wheelchair scales of various types. Patients were weighed without their shoes and with light indoor clothing. If the patient was sitting in a wheelchair and weight could not be measured on a sitting scale, weight was measured while the patient was sitting in the wheelchair. Actual weight was calculated by subtracting the weight of the wheelchair. Weight of limbs was calculated based on the percentages of different body parts (20). Weight of one or more amputated limbs was added to the measured weight of the patients. Height was calculated based on measured knee height (cm) using Chumlea’s technique (21) and Han’s formula (22). Knee height, the distance from the sole of the foot to the anterior surface of the thigh, was measured using a flexible tape-measure. The ankle and knee of the patients were flexed to 0 and 90-degree angles, respectively. Knee height was measured in the seated position if possible, and otherwise in a recumbent position (21). In 26 (7%) of the patients it was impossible to measure knee height, because of amputations to both legs, special shoes that could not be taken off, or inability of the patient to make a straight foot. These patients were included in the analyses, using their self-reported body height.
BMI was calculated by weight divided by height squared. The MUAC was measured using a flexible, non-stretchable tape measure. The MUAC is the circumference of the non-dominant arm midway between the bony protrusion on the shoulder (acromion) and the point of the elbow (olecranon) (23).
Weight loss
The patient’s weight loss during the previous month, previous 3 months and previous 6 months was based on the recorded body weights in the patient records, obtained by the researcher. If this information was missing, the information was obtained by asking the patient (35% at 1 month, 54.4% at 3 months and 71% at 6 months), the family (0.3% at 1 month, 1% at 3 months and 2% at 6 months), or the nursing staff (0.3% at 1 month, 0.5% at 3 months and 0.3% at 6 months).
Statistical analysis
The study population was categorized into 3 groups (severely undernourished, moderately undernourished and not undernourished). For each diagnoses, prevalence of the 3 groups was calculated. Descriptive statistical methods were used to express means, standard deviations, percentages and frequencies. Patient’s characteristics were stratified by age, because patients ≥ 65 years are defined as undernourished with a BMI < 20 kg/m2, in contrast to a BMI < 18.5 kg/m2 for the < 65 years group. Analysis of variance (ANOVA) and χ2 tests were used to assess the relationship of patient’s characteristics with nutritional status. Logistic regression was used to test the relationship between departments and nutritional status. Differences were considered statistically significant at p < 0.05.
Diagnostic accuracy was determined by comparing the scores of the SNAQ, SNAQRC, SNAQ65+, MUST and MNA-sf with the objective definition of undernutrition as described in the nutritional status section. Diagnostic accuracy was expressed by comparing the severely undernourished with the moderately undernourished plus well-nourished patients and by comparing the severely undernourished plus moderately undernourished with the well-nourished patients. This diagnostic accuracy was expressed in terms of sensitivity, specificity, positive predictive value (PPV) and negative predictive value (NPV). These values were interpreted as: 0.9–1.0 excellent; 0.8–0.9 good; 0.7–0.8 fair; 0.6–0.7 poor; and 0.5–0 fail (24). The 95% confidence interval (95% CI) was used to express statistical significance.
Binary logistic regression analysis was performed in order to investigate the contribution of the questions and anthropometric measurements of each screening tool to the recognition of the undernourished patient. Both questions and measurements were considered statistically significant at p < 0.05. R-squared was calculated for each screening tool to determine to what extent the screening tools could predict a patient’s nutritional status.
All analyses were performed with the SPSS software package, version SPSS for MAC 18.0.
Results
Patients
A total of 102 (28%) patients were severely undernourished and 38 (10%) were moderately undernourished, according to the previously described definition of undernutrition. In addition, 127 (35%) were overweight (BMI > 25 kg/m2) and 84 (23%) were obese (BMI > 30 kg/m2). The characteristics of the study sample are presented in Table I. Of the severely undernourished patients, 8 (8%) were undernourished based exclusively on low BMI. Next to being severely undernourished, 28 patients (27%) were also overweight (BMI > 25). Nineteen patients (19%) were both severely undernourished and obese (BMI > 30).
|
Table I. Characteristics of rehabilitation patients divided by nutritional status and age
|
|
|
< 65 years
n = 269
|
≥ 65 years
n = 97
|
|
Severely UNa
|
Moderately UNb
|
Not UNc
|
p-value
|
Severely UNd
|
Moderately UNe
|
Not UNf
|
p-value
|
|
Total, n
|
80 (30)
|
32 (12)
|
157 (58)
|
|
22 (23)
|
6 (6)
|
69 (71)
|
|
|
Sex, female, n
|
25 (31)
|
12 (38)
|
69 (44)
|
0.16
|
11 (50)
|
1 (17)
|
30 (43)
|
0.14
|
|
Age, years, mean (SD)
|
48 (1.4)
|
50 (1.6)
|
50 (1.0)
|
Severely UN vs not UN: 0.18
Moderately UN vs not UN: 0.98
|
69 (1.1)
|
71 (1.9)
|
71 (0.6)
|
Severely UN vs not UN: 0.23
Moderately UN vs not UN: 0.8
|
|
MUAC < 25 cm, n (%)
|
4 (5)
|
2 (6)
|
5 (32)
|
0.69
|
4 (18)
|
0 (0)
|
4 (6)
|
0.14
|
|
Dietetic treatment, n, yes
|
53 (62)
|
20 (58)
|
72 (47)
|
0.006
|
10 (45)
|
6 (100)
|
28 (41)
|
0.14
|
|
Length of stay, days, mean (SD)
|
55 (6.2)
|
69 (11.3)
|
53 (4.2)
|
Severely UN vs not UN: 0.13
Moderately UN vs not UN: 0.82
|
40 (7.1)
|
98 (22)
|
53 (7.0)
|
Severely UN vs not UN: 0.28
Moderately UN vs not UN: 0.09
|
|
BMI, kg/m2, mean (SD)
|
25 (0.6)
|
25 (0.8)
|
28 (0.5)
|
Severely UN vs not UN: 0.002
Moderately UN vs not UN: 0.02
|
25 (1.0)
|
25 (1.6)
|
28 (0.5)
|
Severely UN vs not UN: 0.009
Moderately UN vs not UN: 0.18
|
|
BMI < 18.5, n (%)
|
8 (10)
|
0 (0)
|
0 (0)
|
|
1 (5)
|
0 (0)
|
0 (0)
|
|
|
BMI < 20, n (%)
|
5 (6)
|
6 (19)
|
5 (3)
|
|
3 (14)
|
0 (0)
|
0 (0)
|
|
|
BMI 20–22, n (%)
|
8 (10)
|
4 (13)
|
20 (13)
|
|
3 (14)
|
2 (33)
|
0 (0)
|
|
|
BMI 22.01–25, n (%)
|
22 (28)
|
8 (25)
|
30 (19)
|
|
5 (23)
|
1 (17)
|
24 (35)
|
|
|
BMI 25.01–30, n (%)
|
22 (28)
|
10 (31)
|
62 (40)
|
|
6 (27)
|
2 (33)
|
25 (36)
|
|
|
BMI > 30, n (%)
|
15 (19)
|
4 (13)
|
40 (25)
|
|
4 (18)
|
1 (17)
|
20 (29)
|
|
|
> 5% WL in past month, n = 26, n (%)
|
21 (26)
|
0 (0)
|
0 (0)
|
|
5 (23)
|
0 (0)
|
0 (0)
|
|
|
5–10% WL in past 6 months, n = 50, n (%)
|
15 (19)
|
29 (37)
|
0 (0)
|
|
1 (5)
|
5 (83)
|
0 (0)
|
|
|
> 10% WL in past 6 months, n = 76, n (%)
|
58 (73)
|
0 (0)
|
0 (0)
|
|
18 (82)
|
0 (0)
|
0 (0)
|
|
|
aBMI ≤ 18.5 kg/m2 and/or unintentional WL of > 5% in the last month or > 10% in the last 6 months.
bBMI > 18.5 kg/m2 and 5–10% unintentional WL in the last 6 months.
cBMI > 18.5 kg/m2 and ≤ 5% unintentional WL in the last 6 months.
dBMI ≤ 20 kg/m2 and/or unintentional WL of > 5% in the last month or >10% in the last 6 months.
eBMI > 20 kg/m2 and 5–10% unintentional WL in the last 6 months.
fBMI > 20 kg/m2 and ≤ 5% unintentional WL in the last 6 months.
SD: standard deviation; WL: weight loss; BMI: body mass index; MUAC: mid-upper arm circumference; UN: undernourished.
|
In 94 (92%) of the undernourished patients, unintentional weight loss was present.
Twenty-nine patients had one or more amputated limbs. Lower leg amputation was most common (n = 17).
Rehabilitation departments
Table II presents the number of patients in each department by nutritional status. The amount of severe undernutrition is highest in the trauma department (46%) and lowest for patients with amputations (15%). Undernutrition in general was significantly higher in the trauma department compared with all other departments.
|
Table II. Nutritional status in rehabilitation departments
|
|
|
n (%)
|
Severely undernourisheda
n = 102 (28%) |
Moderately undernourishedb
n = 38 (10%)
|
Not undernourishedc
n = 226 (62%)
|
ORd (95% CI)
|
|
CVA
|
152 (42)
|
42 (28)
|
16 (11)
|
94 (62)
|
0.98 (0.62–1.56)
|
|
Paraplegics
|
60 (16)
|
15 (25)
|
8 (13)
|
37 (62)
|
0.85 (0.45–1.58)
|
|
Amputation
|
27 (7)
|
4 (15)
|
2 (7)
|
21 (78)
|
0.43 (0.14–1.27)
|
|
Trauma
|
24 (7)
|
11 (46)
|
1 (4)
|
12 (50)
|
2.33 (1.01–5.39)
|
|
Orthopaedics
|
19 (5)
|
3 (16)
|
3 (16)
|
13 (68)
|
0.47 (0.13–1.65)
|
|
Non-congenital brain damagee
|
17 (5)
|
5 (29)
|
0 (0)
|
12 (71)
|
1.08 (0.37–3.15)
|
|
Pain
|
6 (2)
|
1 (17)
|
0 (0)
|
5 (83)
|
0.51 (0.06–4.44)
|
|
Others
|
60 (16)
|
21 (35)
|
8 (13)
|
31 (52)
|
1.49 (0.83–2.69)
|
|
aBMI ≤ 18.5 kg/m2 (or ≤ 20 kg/m2 for age 65+) and/or unintentional weight loss of > 5% in the last month or >10% in the last 6 months.
bBMI > 18.5 kg/m2 (or > 20 kg.m2 for age 65+) and 5–10% unintentional weight loss in the last 6 months.
cBMI > 18.5 kg/m2 (or > 20 kg/m2 for age 65+) and ≤ 5% unintentional weight loss in the last 6 months.
dORs present the odds of being undernourished in a certain department compared with all other departments and are based on the combination of severely undernourished and moderate undernourished patients vs not undernourished patients.
eAll non-congenital brain damage except CVA.
CVA: cardiovascular accident; BMI: body mass index; SD: standard deviation; OR: odds ratio; CI: confidence interval.
|
Diagnostic accuracy
The diagnostic accuracies of the SNAQ, SNAQRC, SNAQ65+, MUST and MNA-sf are presented in Table III. The diagnostic accuracy of the MUST was the highest compared with the SNAQ, SNAQRC, SNAQ65+ and MNA-sf. The specificity of the MUST to detect moderate and severe undernutrition was excellent (> 90%). The sensitivity showed good to excellent scores (> 80%). The MNA-sf showed very low scores, with a sensitivity of 44% to detect severe undernutrition. Diagnostic accuracy for the SNAQRC was excellent on sensitivity, but failed on specificity and positive predictive value (< 50%). The SNAQ65+ showed excellent scores on sensitivity and moderate scores on specificity. Diagnostic accuracy of the SNAQ ranged from poor to excellent, with poor scores on positive predictive value (52%) for severe undernutrition and excellent scores on sensitivity (> 90%) for severe and moderate undernutrition.
|
Table III. Diagnostic accuracy of the SNAQ, SNAQRC, SNAQ65+, MUST and MNA ≥ 65 years (n = 269)
|
|
|
SNAQ
|
SNAQRC
|
SNAQ65+
|
MUST
|
MNA-sf
|
|
UN 1 and 2a
|
UN 2b
|
UN 1 and 2a
|
UN 2b
|
UN 2b
|
UN 1 and 2a
|
UN 2b
|
UN 1 and 2a
|
UN 2b
|
|
Sensitivity, % (range)
|
96 (93–98)
|
88 (84–91)
|
99 (97–100)
|
99 (97–100)
|
96 (93–98)
|
100 (99–100)
|
84 (80–88)
|
92 (89–95)
|
44 (39–49)
|
|
Specificity, % (range)
|
71 (66–76)
|
69 (64–74)
|
48 (43–53)
|
49 (40–51)
|
77 (72–81)
|
97 (95–98)
|
97 (95–98)
|
37 (32–42)
|
92 (89–95)
|
|
Positive predictive value, % (range)
|
68 (63–73)
|
52 (47–57)
|
54 (49–59)
|
49 (40–51)
|
62 (57–67)
|
96 (93–98)
|
92 (89–95)
|
47 (42–52)
|
68 (63–73)
|
|
Negative predictive value, % (range)
|
97 (95–98)
|
94 (91–96)
|
99 (97–100)
|
99 (97–100)
|
98 (96–99)
|
100 (99–100)
|
94 (91–96)
|
88 (84–91)
|
81 (76–85)
|
|
SNAQ: Short Nutritional Assessment Questionnaire; SNAQRC: SNAQ Residential Care; SNAQ65+: SNAQ ≥ 65 years old; MUST: Malnutrition Universal Screening Tool; MNA: Mini Nutritional Assessment; MNA-sf: MNA-short version; UN: undernourished. UN 1 = moderately undernourished; UN 2 = severely undernourished. aDiagnostic accuracy with severely undernourished patients and moderately undernourished patients vs not undernourished patients; bDiagnostic accuracy with severely undernourished patients vs moderately undernourished and not undernourished patients.
|
Diagnostic accuracy was also calculated for the age group ≥ 65 years only (Table IV). The most prominent difference was reversed scores on the SNAQ65+, with moderate scores on specificity and excellent scores on sensitivity.
|
Table IV. Diagnostic accuracy of the SNAQ, SNAQRC, SNAQ65+, MUST and MNA ≥ 65 years (n = 97)
|
|
|
SNAQ
|
SNAQRC
|
SNAQ65+
|
MUST
|
MNA-sf
|
|
UN 1 and 2a
|
UN 2b
|
UN 1 and 2a
|
UN 2b
|
UN 2b
|
UN 1 and 2a
|
UN 2b
|
UN 1 and 2a
|
UN 2b
|
|
Sensitivity, % (range)
|
93 (86–97)
|
82 (73–89)
|
96 (90–99)
|
95 (88–98)
|
71 (61–80)
|
100 (96–100)
|
91 (83–96)
|
93 (86–97)
|
44 (34–55)
|
|
Specificity, % (range)
|
78 (68–86)
|
79 (70–87)
|
40 (30–51)
|
73 (63–82)
|
93 (86–97)
|
99 (94–100)
|
99 (94–100)
|
34 (25–44)
|
89 (81–94)
|
|
Positive predictive value, % (range)
|
63 (52–72)
|
50 (40–61)
|
47 (37–58)
|
51 (40–61)
|
35 (26–45)
|
97 (91–99)
|
95 (88–98)
|
50 (40–61)
|
63 (52–72)
|
|
Negative predictive value, % (range)
|
96 (90–99)
|
93 (86–97)
|
97 (91–99)
|
98 (93–100)
|
97 (91–99)
|
100 (96–100)
|
97 (91–99)
|
89 (81–94)
|
79 (70–87)
|
|
SNAQ: Short Nutritional Assessment Questionnaire; SNAQRC: SNAQ Residential Care; SNAQ65+: SNAQ ≥ 65 years old; MUST: Malnutrition Universal Screening Tool; MNA: Mini Nutritional Assessment; MNA-sf: MNA-short version; UN: undernourished. UN 1 = moderately undernourished; UN 2 = severely undernourished. aDiagnostic accuracy with severely undernourished patients and moderately undernourished patients vs not undernourished patients; bDiagnostic accuracy with severely undernourished patients vs moderately undernourished and not undernourished patients.
|
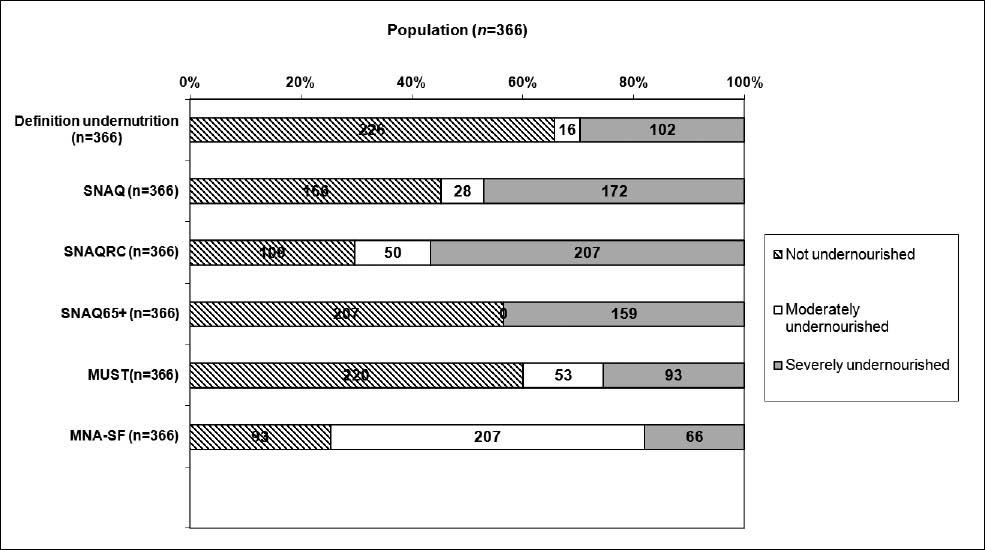
Binary logistic analysis revealed that the MUST and the SNAQ65+ had the highest R-squares, 0.86 and 0.63, respectively. The SNAQRC had an R-square of 0.51, the MNA-sf 0.48 and the SNAQ 0.43. When investigating the most discriminating questions of each screening tool, weight loss questions were statistically significant in every screening tool model (p < 0.001). Besides these questions, the MUAC measurement was also statistically significant (p = 0.027) for the SNAQ65+ and the BMI measurement in the MUST and MNA-sf (p < 0.001). Furthermore, the MNA-sf question on reduced food intake over the past 3 months was statistically significant, with a p-value of 0.008, as well as the question about help with feeding from the SNAQRC (p = 0.01). Fig. 1 shows the amount of undernutrition, moderate undernutrition and no undernutrition for the different screening tools. The MUST corresponded most to the definition of undernutrition, while the MNA-sf deviated the most.
Fig. 1. Prevalence of undernutrition of all patients according to the definition of undernutrition and 5 different screening tools. SNAQ: Short Nutritional Assessment Questionnaire; SNAQRC: SNAQ Residential Care; SNAQ65+: SNAQ ≥ 65 years old; MUST: Malnutrition Universal Screening Tool; MNA-sf: Mini Nutritional Assessment-short version.
Discussion
The prevalence of undernutrition in the rehabilitation setting is high. Severe undernutrition was observed in 28% of patients and 10% were moderately undernourished. Undernutrition is mainly caused by unintentional weight loss. The prevalence rates of undernutrition are similar to those observed in previous studies (12, 13). Many patients in rehabilitation centres were not only undernourished, but also overweight or obese. This is something that has not been seen to this scale in previous research relating to the prevalence of undernutrition (5, 12).
The HCI advises the use of the SNAQ for undernutrition screening in rehabilitation centres (14). Our results suggest the use of the SNAQ65+ as a screening tool. This tool showed the best diagnostic accuracy of the quick and easy screening tools investigated (sensitivity 96%, specificity 77%). Combination of the weight loss question and the measurement of the MUAC detected 96% of all undernourished patients. A limitation of the SNAQ65+ is the low PPV, especially in patients ≥ 65 years, meaning that more patients are detected as undernourished than there actually are. Although the MUST showed the best diagnostic accuracy of all the undernutrition screening tools, it is not quick and easy, as it involves the cumbersome assessment of body weight and height. Furthermore, the third MUST question on inability to eat and sickness did not contribute to the recognition of the undernourished patient and does not need to be posed in this patient group. If it is possible to measure the BMI, we suggest using the general definition, and not the MUST, to determine undernutrition. The nutritional status criteria are preferable, because BMI cut-off points for different age groups can be used.
In this population it is not always possible to measure a patient’s actual body height, due to the fact that patients are in a wheelchair, are unable to stand up straight, or are bedridden. We therefore choose to measure the knee height of the patients. Knee height can be entered into a formula that gives a good prediction of a patient’s actual height (22). If it was impossible to measure knee height, recalled height was used. It is possible that patients, just as for past body weight, did not report this accurately.
In 71% of the patients, information about weight 6 months previously was obtained by asking the patient to give an indication of their past weight, because no weight records were available. We did not find a significant difference between self-reported and measured weight, suggesting that patients, in general, did not under- or over-estimate their weight. However, this could still have biased the results. Therefore, it is important for rehabilitation centres to copy the weight records a patient has from the hospital with care.
Another limitation of the current study is that we are not certain about the validity of the use of the general definition of undernutrition in this population. Rehabilitation patients are complex. They have a variety of diseases and some have severe loss of muscle mass. The definition includes the measurement of BMI. The validity of the BMI in this population is unclear. Studies reported that BMI may underestimate adiposity in men with spinal cord injury (25), and that BMI is an imprecise indicator of fat-free mass depletion (6). Patients could therefore be categorized as well-nourished, while in fact they are undernourished.
Our results warrant the assessment of nutritional status in rehabilitation patients and the implementation of proper dietetic treatment. Given the high prevalence of overweight and obesity it is important not only to screen for undernutrition, but carefully to assess overweight and obesity in every undernourished rehabilitation patient during dietetic treatment.
Future research should focus on the effects and cost-effectiveness of early recognition in the treatment of undernutrition. Given the high prevalence of undernutrition in this population, the pursuit of effective recognition and treatment of undernutrition should be given high priority.
ACKNOWLEDGEMENTS
The authors are grateful to the patients who participated in this study. We thank all the dieticians, nurses, care workers and managers from the rehabilitation centres (Heliomare, Hoogstraat, Maartenskliniek, MRC Doorn, RCC Leiden, Reade, Revant Breda, Revant Goes, Rijndam, Roessingh en Vogellanden) for their kind assistance during the study.
There are no real or potential conflicts of financial or personal interest with authors of the scientific project.
References