OBJECTIVE: The aim of this study was to systematically review and compare the measurement attributes of multidimensional, patient-reported outcome measures used in hip and knee arthroplasty rehabilitation.
METHODS: A search of PubMed, CINAHL, Cochrane Central Registry, SCOPUS and PEDro databases up to December 2009 identified the validation studies. The quality of the measurement properties were assessed based on the Terwee and Bot criteria, and Scientific Advisory Committee of the Medical Outcomes Trust guidelines.
RESULTS: A total of 68 studies examining 28 instruments were identified. Three instruments had positive ratings for content validity. None of the instruments satisfied both factor analysis and Cronbach’s α criteria for internal consistency. Four measures were positively-rated for agreement. Nine tools had positive ratings for construct validity. Twenty-four of the instruments had indeterminate ratings for responsiveness to clinical change. Only certain subscales of 2 instruments were positively-rated for responsiveness to clinical change.
CONCLUSION: A wide variety of multidimensional patient-reported instruments has been used to assess rehabilitation outcomes after hip and knee arthroplasty, but information about their measurement attributes in these populations is inadequate. More data are needed to clarify their reproducibility and responsiveness to clinical change.
Key words: arthroplasty; joint replacement; patient-reported outcome measures; validation; psychometrics; clinimetrics; outcome assessment.
J Rehabil Med 2011; 43: 572–583
Correspondence address: Maria Jenelyn Alviar, The University of Melbourne (Parkville Campus), Victoria 3010, Australia. E-mail: m.alviar@pgrad.unimelb.edu.au
Submitted February 2, 2011; accepted April 14, 2011
INTRODUCTION
Ageing of the population worldwide has led to a rise in chronic degenerative diseases, including osteoarthritis (OA). Osteoarthritis may affect up to 40% of persons aged over 65 years in the community (1). Amongst developed countries, OA is 1 of the 3 most disabling conditions with a significant public health impact (2). Joint replacements are becoming more frequent for advanced osteoarthritis. In the USA, Canada, Australia, New Zealand, England, Denmark, Norway, and Sweden, the crude incidence rates (per 100,000) range from 77 to 153 and from 66 to 143 for primary hip and primary knee arthroplasty, respectively (3).
Following arthroplasty, patients are often referred for rehabilitation. A systematic review has shown that early multidisciplinary rehabilitation after hip and knee joint replacement in patients with chronic arthropathy improves outcomes in terms of activity and participation (4). “Activity” is the execution of a task, while “participation” is the involvement in a life situation (5).
With the increasing role of rehabilitation in the growing arthroplasty population, outcome assessment becomes important in determining the most effective and efficient rehabilitation strategies. In order to assess the clinical effects of arthroplasty rehabilitation treatment, measurement of activity and participation is essential. A systematic review has shown that outcome measures used to assess the same outcomes vary from one study to another, and that this variation is related to the number and types of tools used (6). The heterogeneity and lack of uniformity in outcome measures applied in arthroplasty rehabilitation suggest little consensus in this field, and make it difficult to generalize findings and draw conclusions.
In recent years, there has been increasing recognition and appreciation of patient perspective on functioning and health that have led to the use of a variety of patient-reported instruments in outcome assessment in arthroplasty studies. A review of multidimensional patient-reported outcome measures in hip and knee arthroplasty showed that the content of these instruments, in relation to the International Classification of Functioning, Disability and Health (ICF) and to the OA Core Set, have not fully addressed specific areas of activity, participation and environment relevant to patients with arthritis undergoing arthroplasty (7). The current review addresses the validity, reliability, responsiveness and practicability of these instruments. The results of this review will facilitate the selection of robust measurement tools to demonstrate the effectiveness and efficiency of emerging arthroplasty rehabilitation interventions. To the best of our knowledge, no study has yet done this. Systematic reviews have been carried out examining the clinimetric properties of patient-reported instruments in conditions specific to the knee (8); in chronic ankle stability (9); in hip and groin problems in the young to middle-aged group (10); and in performance-based tests used for hip and knee osteoarthritis (11). This review differs from the other reviews in two aspects. First, it focuses specifically on multidimensional instruments in arthroplasty rehabilitation, where either activity or participation is a domain. Secondly, it is comprehensive in terms of populations included (hip and knee); the tools examined (generic and specific); and the attributes assessed.
This systematic review appraises and compares the quality of measurement properties of evaluative, multidimensional patient-reported outcome measures used to assess outcomes in rehabilitation following hip and knee arthroplasty.
METHODS
Identifying the clinimetric studies
Literature search. We searched PubMed, CINAHL, Cochrane Central Registry, SCOPUS and PEDro in two stages using MeSH and free text for literature published up to December 2009. The first stage of the literature search identified the multidimensional, patient-reported outcome tools used in hip and knee arthroplasty rehabilitation. The search terms were “arthroplasty,” “replacement,” “hip,” “knee,” “rehabilitation,” “physiotherapy,” “physical therapy,” “exercise,” “occupational therapy,” “hydrotherapy,” “gait training,” “activity of daily living”. The second stage of the literature search looked for related studies on the measurement properties. The search terms were “arthroplasty,” “replacement,” “hip,” “knee,” valid*, reliab*, sensitiv*, responsive*, “ceiling effect”, “floor effect”, psychometric*, clinimetric, attribute*, “measurement properties”, “instrument validation”, “validation studies” and the name of the instrument (e.g. Oxford Knee Scale (OKS)).
Inclusion and exclusion criteria. We included evaluative patient-reported, multidimensional outcome measures in prospective studies and reviews involving hip and knee arthroplasty patients undergoing any rehabilitation intervention. “Multidimensional” is defined in this review as ≥ 2 domains, with at least 1 domain on activity or participation. A patient-reported instrument is 1 that is exclusively patient-assessed and is either self or interviewer-administered. Studies with the aim of examining any of the measurement properties of instruments (or any of their subscales) were included. Non-English studies, theses, conference proceedings, and studies with sample size of less than 10 were excluded. Three reviewers (JT, MJA, TH) independently assessed the eligibility of the studies. The kappa statistic for agreement in study selection was calculated.
Extracting the data
For studies that met the eligibility criteria, we collected the data about the study (design, objectives, population characteristics, setting, sample size); about the outcome instruments (name/version, type, domains, number of items); and about the reported measurement properties (evaluation methods used per attribute, results).
Assessing the quality of measurement properties of outcome instruments
We assessed the quality of the measurement properties of the patient-reported outcome measures using a checklist based mostly on quality criteria outlined by Terwee et al. (12) and on guidelines by the Scientific Advisory Committee of the Medical Outcomes Trust (13). These criteria were used as references for assessment because of their detailed and organized information needed to adequately evaluate the measure and facilitate comparison across the measures. These were deemed suitable for the purpose of this study and they have been used in other similar reviews (9–11). Some modifications and additions, however, were made for the purpose of the study. The psychometric properties of the outcomes were rated as positive (+), indeterminate ($), negative (–), or blank for no information available or for not assessed according to a criteria list (Table I). Four investigators (MJA, JT, MP, TH) extracted the data and assessed the quality of the measurement attributes.
| Table I. Checklist for rating the measurement attributes of patient-reported instruments (12, 13) |
| Attribute | Definition | Criteria to rate the attribute |
| Content validity | Refers to the relevance and adequacy of the items in the instrument | +: clear description of evaluative aim, target population, concepts/domains, item selection AND target population involvement in item selection $: lack of clear description of methods OR doubtful method –: no target population involvement Blank: no information found on content validity |
| Internal consistency | Refers to the homogeneity of the items in the tool | +: factor analyses AND Cronbach α(s) per subscale ≥ 0.7 $: no factor analysis OR only Cronbach α analysis done with Cronbach α(s) per subscale ≥ 0.7 OR doubtful method –: Cronbach’s α(s) < 0.70 Blank: no information found on internal consistency. |
| Criterion validity | Refers to the extent to which scores on the tool relate to a gold standard | +: justification of use of the gold standard AND correlation ≥ 0.70 $: no justification of gold standard OR doubtful method –: correlation with gold standard < 0.70 Blank: no information found on criterion validity |
| Construct validity | Degree to which scores on the tool relate to other measures in a manner consistent with theoretically derived hypotheses concerning the domains being studied | +: a priori hypotheses generated AND at least 75% of hypotheses confirmed $: no a priori hypotheses OR doubtful method –: less than 75% of hypotheses confirmed Blank: no information found on construct validity |
| Agreement | Refers to how close scores are for repeated measurements | +: SDC < MIC OR LOA < MIC $: MIC not defined OR doubtful method –: MIC ≥ SDC OR MIC outside LOA Blank: no information found on agreement |
| Reliability | Refers to how well the measurement can distinguish persons from each other despite measurement errors | +: ICC or weighted Kappa ≥ 0.70; $: doubtful method (e.g. Pearson’s; rho; t-tests) –: ICC or weighted Kappa < 0.70 Blank: no information found on reliability |
| Responsiveness | Refers to how well an instrument can detect clinically important changes over time | +: SDC or SDC < MIC OR MIC outside the LOA OR RR > 1.96 OR AUC ≥ 0.70; use of anchor-baseda approaches or combination of anchor-based and distribution-basedb approaches to show responsiveness to clinical change $: Doubtful method; no MIC defined; used only distribution-basedb approaches –: SDC or SDC ≥ MIC OR MIC equals or inside LOA OR RR ≤ 1.96 OR AUC < 0.70 Blank: no information found on responsiveness |
| Floor and Ceiling effects | Number of respondents with the lowest or highest possible score | +: ≤ 15% of the respondents achieved the highest or lowest possible scores in global scores and/or all subscale scores (when presented) $: not all subscales (when presented) satisfy cut-off of 15% –: > 15% of the respondents achieved the highest or lowest possible scores Blank: no information found on floor/ceiling effects |
| Interpretability | The degree to which qualitative meaning can be assigned to quantitative scores | +: 2 or more types of information presented on interpretation of scores (e.g. presentation of mean and SD of scores; comparative data in relevant subgroups or distribution of scores in defined population groups; relationships of scores or score changes to clinically recognized conditions or to subjective ratings of important changes) OR MIC defined; $: < 2 types of information presented OR doubtful method Blank: No information found on interpretation |
| Practical burden (Respondent) | Time needed to complete tool | +: completed within 10 min –: completed in more than 10 min Blank: no information on time to complete tool |
| Cultural adaptation | Equivalence (conceptual, semantic, idiomatic, experiential, operational) of the adaptation with the original version | +: followed guidelines of cultural adaptation process e.g. forward/back translations, review, item selection, pre-testing (target population), validation $: only language translations, unclear methods, doubtful design Blank: no information on adaptation process |
| aComparisons of measures by tool to other measures/phenomena with clinical relevance; changes in scores linked to a meaningful external anchor. bDetermination of meaningful change based on statistical characteristics of sample (t statistic, effect size, standardized response means) +: positive rating; $: indeterminate rating; –: negative rating; Blank: no information available. SDC: smallest detectable change; MIC: minimal important change; LOA: limits of agreement; ICC: intraclass correlation; RR: Guyatt’s responsiveness ratio; AUC: area under the curve; SD: standard deviation. |
RESULTS
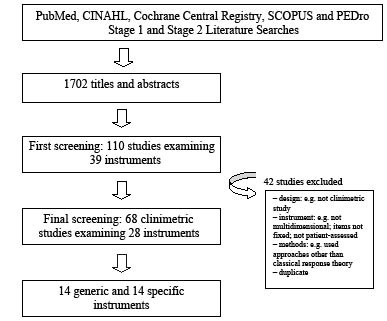
Electronic database searches identified 1,702 titles and abstracts that were relevant to the research problem (Fig. 1). After initial screening, we selected 110 studies investigating 39 instruments for closer scrutiny. The full text articles were retrieved and 3 reviewers performed the final selection and included 68 studies examining 28 instruments (Appendices S1–S2 (available from http://jrm.medicaljournals.se/article/abstract/10.2340/16501977-0828)). Reviewer 1 (JT) reviewed the first half of the articles, reviewer 2 (TH) reviewed the last half of the articles and reviewer 3 (MJA) reviewed all the articles. The kappa statistic between reviewer 1 and 3 was 0.83, and that between reviewer 2 and 3 was 0.77. Both values indicate good agreement.
Fig. 1. Literature search yield.
Description of the multidimensional, patient-reported instruments
Of the 28 instruments reviewed, 14 were generic/utility measures and the rest were specific measures. The number of dimensions in the tools ranged from 2 to 8, with pain and physical function as the most frequent dimensions (Table II).
| Table II. Multidimensional patient-reported outcome measures used in hip and knee arthroplasty rehabilitation |
| Name of instrument | Type | Dimensions/domains | Studies n |
| Western Ontario McMaster University Osteoarthritis Index (WOMAC) | Specific | Pain, physical function, stiffness | 25 |
| Short-Form 36 (SF-36) | Generic/Quality of Life | Physical functioning, role/physical functioning, bodily pain, general health, vitality, social functioning, role/emotional functioning, mental health | 23 |
| Short-Form 12 (SF-12) | Generic/Quality of Life | Physical functioning, role/physical functioning, bodily pain, general health, vitality, social functioning, role/emotional functioning, mental health | 2 |
| Short-Form 6D (SF-6D) | Generic/utility measure | Physical functioning, role/physical functioning, bodily pain, general health, vitality, social functioning, role/emotional functioning, mental health | 1 |
| Oxford Knee Score (OKS) | Specific | Pain, physical function | 10 |
| Oxford Hip Score (OHS) | Specific | Pain, physical function | 8 |
| Sickness Impact Profile (SIP) | Generic/health profile | Physical, psychosocial | 5 |
| Nottingham Health Profile (NHP) | Generic/perceived health status | Energy, pain, emotional reaction, sleep, physical mobility, social isolation; overall impact | 4 |
| Knee Injury and Osteoarthritis Outcome Score (KOOS) | Specific | Pain, other disease-specific symptoms, activities of daily living function, sport and recreation Function, knee-related Quality of Life | 4 |
| Health Assessment Questionnaire (HAQ) | Specific | Disability, pain scale | 3 |
| Modified Health Assessment Questionnaire (MHAQ) | Specific | Mobility, dexterity | 1 |
| Hip Dysfunction Osteoarthritis Outcome Score (HOOS) | Specific | Pain, symptoms, activity limitations–daily living, sport and recreation function, hip-related Quality of Life | 3 |
| Lequesne Algofunctional Index (LAI) | Specific | Pain or discomfort, maximum walking distance, physical function disability | 3 |
| Quality of Well-Being (QWB) | Generic/Quality of Life/utility measure | Physical activity scale, mobility scale, social activity scale, symptom list | 3 |
| Health Utilities Index (HUI) | Generic/utility measure | Sensation [vision, hearing, speech], mobility, emotion, cognition, self-care, pain, fertility | 3 |
| Euroqol (EQ-5D) | Generic/utility measure | Mobility, self-care, usual activity, pain/distress, depression/anxiety | 2 |
| Functional Status Index (FSI) | Generic | Mobility, personal care, home chores, hand activities, social activities | 2 |
| Arthritis Impact Measurement Scales (AIMS) | Specific | Mobility, physical activity, dexterity, household activity, social activity, activities of daily living, pain, depression, anxiety | 2 |
| Shortened Arthritis Impact Measurement Scales (sAIMS) | Specific | Mobility, physical activity, dexterity, household activity, social activity, activities of daily living, pain, depression, anxiety | 1 |
| World Health Organization Quality of Life short version instrument (WHO-QOL BREF) | Generic/Quality of Life | Physical, psychological, relationship, environmental | 1 |
| Pain and Function of the Hip (PFH) | Specific | Pain, function, mobility/strength | 1 |
| Lower Extremity Activity Profile (LEAP) | Specific | Self care, mobility, household activities, work, leisure activities, social activities | 1 |
| London Handicap Scale (LHS) | Generic/utility | Mobility, independence, occupation, orientation, social integration and economic self-sufficiency | 1 |
| Hip Rating Questionnaire (HRQ) | Specific | Global or over-all impact of the arthritis, pain, ability to walk, and ability to perform daily functions | 1 |
| Functional Status Questionnaire (FSQ) | Generic | Physical, psychological, social and role function | 1 |
| Short Musculoskeletal Function Assessment Questionnaire (SFMA-D) | Specific | Daily activities, emotional status, function of the arm and hand, mobility | 1 |
| Musculoskeletal Outcomes Data Evaluation and Management Systems Hip/Knee Core Scale (MODEMS Hip/Knee Core Scale) | Generic/Quality of Life | Pain, function | 1 |
| McKnee | Generic/utility | Vision, hearing, speech, mobility (or ambulation), dexterity, emotion, cognition, pain | 1 |
Measurement attributes of the instruments
Of the 68 studies assessing 28 instruments, the Western Ontario McMaster University Osteoarthritis Index (WOMAC), Short-Form 36 (SF-36) and OKS ( ≥ 10 psychometric evaluations) were the most extensively studied instruments in these populations. The WOMAC and the OKS had been tested for most measurement attributes, including dimensionality and agreement. Dimensionality and agreement were the least frequently investigated properties, while responsiveness to change was the most studied.
Content validity
Content validity was assessed in 11 (39%) of the 28 tools. The Hip Dysfunction Osteoarthritis Outcome Score (HOOS) (56), Knee Injury and Osteoarthritis Outcome Score (KOOS) (59), and OKS (65, 71) had positive (+) ratings based on several studies. The WOMAC (21, 29, 33), SF-36 (21, 29, 51) Euroqol (EQ5D) (29), Sickness Impact Profile (SIP) (21), Oxord Hip Score (OHS) (63), Nottingham Health Profile (NHP) (21), Short-Form 12 (SF-12) (21, 29), and Lequesne Algofunctional Index (LAI) (21) had indeterminate ($) ratings. All lacked clear documentation of the item selection process and, in addition, the last 4 lacked clear description of the evaluative aim and content of the tool. The psychometric properties of the instruments are summarized in Tables III and IV.
| Table III. Summary of results of evaluation of psychometric properties |
| Instrument | Content validity | Internal consistency | Construct validity | Reproducibility |
| Factor analysis | Cronbach’s α | Reliability | Agreement |
| WHOQOL BREF (14) | | | + | + | | |
| PFH (15) | | | $ | | | |
| WOMAC (16–41) | $ (21, 29, 33) | $ (32) – (25, 37) | + (19, 21–23, 25, 31–33, 37, 41) $ (38, 41) | + (18, 32, 40, 41) $ (19, 22, 24, 29, 34, 38) | + (21, 34, 41) $ (22, 24, 32, 33, 37, 38, 40) | + (25, 37) |
| SF-36 (16–19, 21, 23, 26–31,40, 42–51) | $ (21, 29, 51) | | + (21, 23, 48) $ (19, 43) | + (18, 40, 48) $ (19, 29, 43) | $ (21, 40) | |
| HAQ (19, 52, 53) | | | $ (19) | $ (19) | | |
| MHAQ (46) | | | | | | |
| HOOS (54–56) | + (56) | $ (56) | + (54, 55) | + (54–56) | | + (55) |
| KOOS (54, 57–59) | + (59) | $ (57) | + (54, 57, 58) | + (54, 57–59) | + (57) $ (58, 59) | $ (57–59) |
| OHS (24, 29, 60–64) | $ (29) | | + (60, 62–64) | $ (24, 29, 61, 63, 64) + (60) | $ (24, 63) | + (60) $ (63) |
| OKS (43, 65–71) | + (65, 71) $ (21, 66, 67) | – (71) | + (21, 43, 65, 66, 69–71) | + (65–67, 69–71) $ (43) | + (21, 66) $ (65, 67–70) | + (65, 66) $ (67, 69) |
| LEAP (72) | | | $ | $ | | |
| LHS (45) | | | | | | |
| HRQ (73) | | | | $ | + | |
| AIMS (52, 53) | | | | | | |
| sAIMS (46) | | | | | | |
| SIP (21, 46, 51–53) | $ (21) | | $ (21) | | $ (21) | |
| FSQ (46) | | | | | | |
| FSI (52, 53) | | | | | | |
| QWB (50, 52, 53) | | | | | | |
| NHP (21, 74–77) | $ (21) | | $ (21) | $ (75–77) | + (21) $ (74, 76) | |
| SF-12 (21, 29) | $ (21, 29) | | – (21) | $ (29) | + (21) | |
| LAI (21, 38, 39) | $ (21) | | + (21) $ (38) | $ (38) | + (21) $ (38) | |
| SFMA–D (26) | | | | | | |
| HUI (17, 78, 79) | | | | + (78) | | |
| EQ5D (19, 29) | $ (29) | | | $ (19, 29) | | |
| SF6D (79) | | | | | | |
| MODEMS (80) | | | | + | | |
| McKnee (81) | $ | | | $ | $ | |
| +: positive rating; $: indeterminate rating; –: negative rating; blank: no information available. For abbreviations see Table II. |
| Table IV. Summary of results of evaluation of psychometric properties (continued) |
| Instrument | Responsiveness to clinical change | Floor effects | Ceiling effects | Interpretability | Practical burden | Cultural adaptation |
| WHOQOL BREF (14) | $ | + | + | + | | |
| PFH (15) | $ | | | + | | |
| WOMAC (16–41) | + (20, 23a,31a) $ (16, 17, 19, 22, 24–30, 34, 37, 39, 40) | + (18, 19, 23, 24, 29, 33, 41) $ (21, 31) | + (19, 21, 23, 31, 41) $ (18, 24, 29, 33) | + (16, 18, 19, 23, 29, 31) $ (17, 25–27, 30, 32, 33, 34, 36, 39, 40) | – (21) | + (41) $ (32, 34) |
| SF-36 (16–19, 21, 23, 26–31, 40, 42–51) | + (31, 42b) – (42c, 23) $ (16, 17, 19, 26–30, 35, 44–51) | + (18) $ (19, 21, 23, 29, 31, 48, 50, 51) | + (18) $ (19, 21, 23, 29, 31, 48, 50, 51) | + (16, 18, 19, 23, 29, 31, 42, 44, 45, 47, 48) $ (17, 26, 30, 35, 40, 46, 49, 50) | – (21, 43) | + (21, 29, 51) |
| HAQ (19, 52, 53) | $ (19, 52, 53) | | | + (19) $ (52, 53) | | |
| MHAQ (46) | $ | | | $ | | |
| HOOS (54–56 ) | $ (54, 56) | + (55, 56) | + (55) $ (56) | $ (54, 56) | | + (55) |
| KOOS (54, 57–59) | $ (54, 58, 59) | + (57, 58) $ (59) | $ (57–59) | $ (54, 58, 59) | | + (57, 58) |
| OHS (24, 29, 60–64) | $ (24, 29, 60–64) | + (24, 29) $ (64) | + (29, 64) $ (24 | + (29, 61–63) $ (60, 64) | | + (63) $ (64) |
| OKS (43, 65–71) | $ (65–67) | + (21, 66, 67, 69, 70) $ (71) | + (21, 66, 67, 69, 70) $ (71) | + (65) $ (67) | + (21, 66, 70) – (43) | + (66, 43, 69–71) $ (67) |
| LEAP (72) | $ | | | $ | – | |
| LHS (45) | $ | | | | | |
| HRQ (73) | $ | | | + | | |
| AIMS (52, 53) | $ (52, 53) | | | $ (52, 53) | | |
| sAIMS (46) | $ | | | $ | | |
| SIP (21, 46, 51–53) | $ (46, 51–53) | $ (21) | + (21) | $ (46, 52, 53) | – (21) | |
| FSQ (46) | $ | | | $ | | |
| FSI (52, 53) | $ (52, 53) | | | $ (52, 53) | | |
| QWB (50, 52, 53) | $ (50, 52, 53) | + (50) | + (50) | $ (50, 52, 53) | | |
| NHP (21, 74–77) | $ (77) | $ (21) | $ (21) | $ (75) | + (21) | $ (74) |
| SF-12 (21, 29) | $ (29) | + (21, 29) | + (21, 29) | $ (29) | + (21) | |
| LAI (21, 38, 39) | | + (21) | + (21) | $ (39) | + (21) | |
| SFMA-D (26) | $ | | | $ | | |
| HUI (17, 78, 79) | $ (17, 79) | | | $ (17) | | |
| EQ-5D (19, 29) | $ (19, 29) | | | $ (19, 29) | | |
| SF-6D (79) | $ | | | | | |
| MODEMS (80) | $ | | +d –e | | | |
| McKnee (81) | | | | | | |
| +: positive rating; $: indeterminate rating; –: negative rating; blank: no information available. apain, physical function scales; bat group level; cat individual level; dat 6 months; eat 12 months. For abbreviations see Table II. |
Internal consistency
Both factor analysis (or a similar method, e.g. principal component analysis) and Cronbach’s α were performed in only 6 studies that examined 4 tools (or particular subscales only, e.g. pain), namely, WOMAC (25, 32, 37), HOOS (56), KOOS (57), and OKS (72). Factor analyses did not support the factor structure of these tools. Cronbach’s α ranged from 0.7 to 0.9. For most of the remaining studies, Cronbach’s α was determined and studies on the SF-36 (21, 23, 48), OHS (60, 62–64), and World Health Organization Quality of Life short version instrument (WHO-QOL BREF) (14) also showed values of ≥ 0.7 for all subscales (Table III).
Criterion validity
Only the Swedish WOMAC study examined criterion validity using SF-36 as gold standard (33). The total scores for SF-36 and WOMAC were correlated (ρ = 0.73), as were those for domains that were similar (ρ pain = 0.59, ρ physical function = 0.67) (33).
Construct validity
Construct validity was assessed in 17 tools. The WHO-QOL BREF (14), HOOS (54–56), KOOS (54, 57–59), WOMAC (18, 32, 40, 41), SF-36 (18, 40, 48), OHS (60), OKS (65–67, 69–71), Health Utilities Index (HUI) (78) and Musculoskeletal Outcomes Data Evaluation and Management Systems Hip/Knee Core Scale (MODEMS) (80) had positive ratings based on some studies. The WOMAC (19, 22, 24, 29, 34, 38), SF-36 (19, 29, 33), OHS (24, 29, 61, 63, 64) and OKS (43) also received indeterminate ratings based on others. Most indeterminate ratings were due to the lack of pre-defined hypotheses and confirmation of less than 75% of the hypotheses (Table III).
Reliability
Reliability parameters were reported in 10 instruments. The WOMAC (21, 34, 41), KOOS (57), OKS (21, 66), Hip Rating Questionnaire (HRQ) (73), NHP (21), SF-12 (21) and LAI (21) had positive ratings in terms of the intra-class correlation coefficients (ICC), generally ranging from 0.7 to 0.9, based on some studies. However, the WOMAC (22, 24, 32, 33, 37, 38, 40), KOOS (58, 59), OKS (65, 67–70), NHP (74, 76) and LAI (38) also had indeterminate ratings based on several other studies, as did the SF-36 (21, 40), OHS (24, 63), and SIP (21). Indeterminate ratings were attributed to sample sizes of less than 50; coefficients of < 0.7 for a number of subscales; and uncertainty of methods used, such as Pearson’s correlation (Table III).
Agreement
Agreement was evaluated in 5 tools; namely, WOMAC (pain scale) (37), HOOS (55), KOOS (57–59), OHS (60, 63), and OKS (65–67, 69). The WOMAC (37), HOOS (55), OHS (60) and OKS (65, 66) had positive ratings. However, the OHS (63) and OKS (67, 69) also had indeterminate ratings based on several other studies, primarily because of small sample sizes; as did the KOOS (57–59). For HOOS, KOOS (57) and WOMAC, the calculated standard errors of the mean (SEM)s and smallest detectable change (SDC) were compared with 0.5 standard deviation (SD), as the minimal important change (MIC) was not defined and these were less than the estimated MIC. The rest of the tools had acceptable agreement based on the 95% limits of agreement by Bland and Altman (Table III).
Responsiveness
Responsiveness was examined in almost all tools through various methods. Based on the definition of responsiveness in this study, the WOMAC pain and function scales (20, 23, 31); and the SF-36 physical function (PF) (31), general health (GH), vitality (VT) and mental health (MH) subscales (42) had positive ratings for responsiveness to change. In knee patients, at 6 months, the MICs for improvement in pain and physical function for the WOMAC were approximately 23 and 19 points, respectively, which were greater than the SDCs (23). For the SF-36, the MICs for all subscales were less than the SDCs (23). In hip patients, at 6 months, MICs for WOMAC and for SF-36 PF were larger than the SDCs (31). In hip and knee populations, responsiveness to change was estimated at a group (grp) level and at an individual (ind) level (42). At a group level, the MIC was based on Cohen’s d defined by a moderate effect size equivalent to at least 5-point change on the 0–100 scale. The SDCgrps of SF-36 PF, GH, VT and MH subscales were less than 5 in the hip group. At an individual level, the normative values at 95% confidence intervals (CI) of SF-36 scores were used to gauge the amount of measurement error in orthopaedic setting, as well as to represent the limit for true score: PF, 12 points; role-physical (RP), 23 points; bodily pain (BP), 15 points; GH, 18 points; VT, 16 points; social function (SF), 26 points; role-emotional (RE), 28 points; and MH, 24 points). The SDCinds of SF-36 scores were greater than the normative values of 95% CI (42). The rest of the instruments had indeterminate ratings for responsiveness to clinical change as only distribution-based methods were used, MIC was not defined, and external clinical criteria or a “stable” control population to determine if change has indeed occurred were lacking (Table IV).
Floor/ceiling effects
Floor and ceiling effects were evaluated in 12 instruments. The WOMAC (18, 19, 21, 23, 24, 29, 31, 33, 41), OHS (24, 29, 64), OKS (21, 66, 67, 69, 70), and SF-12 (21, 29) had positive ratings for floor and ceiling effects based on more than one study. The SF-36 (19, 21, 23, 29, 31, 48, 49, 51) had indeterminate ratings in nearly all studies for floor and ceiling effects, as some subscales did not meet the 15% cut-off point (Table IV).
Interpretability
For 7 instruments, at least two types of information were presented to aid interpretability. Interpretability was rated positive for the WHO-QOL BREF (14), Pain and Function of the Hip (PFH) (15), WOMAC (16, 18, 19, 23, 29, 31), SF-36 (16, 18, 19, 23, 29, 31, 42, 44, 45, 47, 48), Health Assessment Questionnaire (HAQ) (19), OKS (65), and HRQ (73). The remaining tools had indeterminate ratings mostly due to presentation of less than two types of information in the study (Table IV).
Practical burden
Practical burden on the patient (time to complete tool) was assessed in 8 instruments. The OKS (21, 66, 70), NHP (21), SF-12 (21) and LAI (21) were completed within 10 min and were positively-rated. The WOMAC (21), SF-36 (21, 43), Lower Extremety Activity Function (LEAP) (72) and SIP (21) had negative ratings (Table IV).
Cultural adaptation
Cultural adaptation was carried out in 15 studies that examined 7 tools. The KOOS (Dutch (57), French (58)); HOOS (Dutch) (55); WOMAC (Chinese) (41); SF-36 (Thai) (43); OHS (Dutch) (63); and OKS (Swedish (66), Thai (43), German (69), Italian (70), Chinese (71), Singapore-English (71)) had positive ratings. The WOMAC (Dutch (32), Finnish (34)); OHS (Japanese) (64), OKS (Dutch) (67); and NHP (Danish) (74) had indeterminate ratings because of the lack of clarity in the cross-cultural adaptation process (Table IV).
DISCUSSION
This is the first paper to examine and compare the quality of the measurement properties of multidimensional, patient-reported instruments assessing rehabilitation outcomes after hip and knee arthroplasty. There are two main findings in this review, and the discussion focuses on these. First, there is a wide variety of patient-reported instruments that are applied to measure outcomes in rehabilitation following hip and knee arthroplasty, but only 3 have undergone comprehensive and extensive validation in these populations. Secondly, data clarifying the important measurement attributes for evaluative instruments, which include reproducibility, responsiveness to clinical change and definition of the minimal clinically important change are mostly lacking.
Of the 28 instruments applied in hip and knee arthroplasty rehabilitation, the WOMAC, OKS and SF-36 have been studied at length for their measurement properties, which include content validity, reliability, construct validity, responsiveness, floor effects, and ceiling effects.
In studies that examined content validity, the OKS, HOOS and KOOS had positive ratings compared with the WOMAC, SF-36, SIP, NHP, SF-12 and LAI, which had indeterminate ratings. Content validity depends on the relevance of items in the domains being measured on the target population to whom it is applied and the adequacy of sampling of questions in reflecting the objectives of the tool (82). Thus, the item selection process and target population involvement are crucial. The majority of the tools in this review were not originally and specifically developed for the hip and knee arthroplasty populations. To assume that the content validity of a tool for a particular clinical condition is carried over to another condition would not be appropriate. Some of the studies examined floor/ceiling effects and skewness of distribution to assess content validity. This method may be insufficient because it imposes a limit to the constructs being assessed, such as only those that are in the tool.
Internal consistency was not adequately assessed in most studies as per criteria. This refers to the degree of correlation or homogeneity of the items in the tool. While the studies of most of the tools lacked factor analysis in their methods to assess internal consistency, some studies on the WOMAC and OKS included this. However, the results did not support the factor structure of either tool. In factor analysis, data are explored for patterns or dimensionality and similar items measuring the same construct are expected to represent the same dimension (83). The Chinese and English WOMAC versions yielded 5 and 7 factors, respectively, in a Singaporean knee arthroplasty population (41). Another study showed that pain subscale and function subscale of the WOMAC were not distinct from each other (25). A study that only considered the pain subscale also did not show unidimensionality of the subscale (37). Some other studies performed factor analyses analysing one subscale at a time rather than entering all the items of the tool in a single analysis (32, 56). A review showed that, among studies that use factor analysis, there is an extensive variation of methods, presentation and interpretation of its results (84). On the other hand, based on Cronbach’s α analyses alone, the WOMAC, OKS and SF-36, as well as the WHOQOL BREF, HOOS, KOOS, and OHS, were shown to have internal consistency. Cronbach’s α estimates the degree of equivalence between responses to sets of items tapping the same underlying concept. The higher the α, the higher is the average correlation between responses to all possible combinations of items in the scale (82). On the whole, it was not possible to make generalizations about internal consistency of the instruments, as data on dimensionality and factor structure for most tools were lacking.
As with the WOMAC, SF-36 and OKS, the WHO-QOL BREF, HOOS, KOOS, OHS, HUI and MODEMS had positive ratings for construct validity. Construct validity is concerned with the extent of relationship of the studied tools to other measures purporting to assess the same underlying variables (constructs). Theoretically-derived hypotheses are made prior to the correlation analyses to determine whether the measures are related (12). There were some studies where WOMAC, SF-36, OHS and OKS had indeterminate ratings because of the lack of specific a priori hypotheses in the methodology. The generation of pre-defined hypotheses reduces bias. Without a priori hypotheses, the tendency is to look for explanations for the low correlations rather than conclude that the tool has inadequate construct validity (12).
Another important attribute is reproducibility, which is the extent to which repeated measurements in subjects yield similar results when no real change has occurred. Variations in the subject or rater could lead to fluctuations in the measurements in the absence of real change over time contributing to the background noise, thus affecting the reproducibility of a tool (85). The studies determined reproducibility by inspecting agreement and/or reliability parameters. Agreement refers to how close scores are on repeated measurements and estimates the absolute measurement error (86). Reliability refers to how well subjects can be distinguished from one another despite measurement errors (86). Reliability parameters relate the measurement error to the variability between subjects and thus rely on the heterogeneity of the sample, while agreement parameters, being concerned with the measurement errors, reflect the characteristics of the instrument itself (86). The WOMAC, KOOS, OKS, HRQ, NHP, SF-12 and LAI had positive ratings for reliability, but had indeterminate ratings as well because some studies used methods that are considered inappropriate, e.g. Pearson’s correlation coefficients, rho and paired t-tests. The limitations and inappropriate use of correlation coefficients in assessing reproducibility can lead to misleading interpretations as shown by Bland and Altman (87). In terms of agreement, the WOMAC (pain scale) and OKS, as well as the HOOS and OHS, were positively-rated based on at least one study per tool. The methods used were Bland and Altman levels of agreement (87), calculation of the SEM, and examination of the relationship of the SDC and MIC. The SEM represents the measurement error and from it, the SDC can be derived. The SDC therefore reflects the smallest change in score that can be interpreted as “real change” beyond the measurement error (12). The MIC, on the other hand, is the change considered clinically important so it is not equated with the SDC (12). For a tool to have adequate agreement, the SDC must be less than the MIC (12). Relating the SDC to the MIC to evaluate agreement is a relatively new approach and is usually not presented in most studies (12). The SEM and SDC were compared with 0.5 SD, such as in HOOS, where the MIC was not defined. In many measures used in a diversity of disease conditions, the threshold for detecting the just noticeable differences consistently approaches half an SD (88).
As for responsiveness to clinical change, most of the tools had indeterminate ratings. Various definitions of the concept were utilized to investigate responsiveness to change. A study confirmed that this field is less understood compared with reliability and validity. Twenty-five definitions and 31 methods of assessing responsiveness were found demonstrating the lack of consensus for standardized terminology and approach (89). This current review makes a distinction between the ability to detect change in general and “clinically important change”. Statistical significance of a treatment effect does not always mean clinical relevance of the effect. With the use of large sample sizes, small numerical differences in scores from a tool might give statistically significant results (90). To gauge this clinical relevant change, the minimal clinically important change (MCIC) or MIC is the smallest difference between the scores in the instrument that patients perceive as beneficial (91). The approaches in defining clinically meaningful change could be broadly classified into distribution-based and anchor-based approaches. The 2 are conceptually different, in that the former are based on statistical criteria, while the latter are based on comparisons of measures with other measures or phenomena of clinical relevance. In distribution-based approaches, change is based on the characteristics of the study sample and entails the use of t statistics, effect sizes, and standardized response means, among others, whereas in anchor-based approaches, change is linked to a relevant external clinical anchor (92). External clinical longitudinal anchors, such as global ratings or disease-related outcomes, are used to assess clinical significance of individual change (92). It is unclear whether distribution-based and anchor-based methods lead to radically different outcomes (88, 92).
Most of the clinimetric studies in this review relied mostly on distribution-based approaches and lacked definition of the MIC; hence the indeterminate ratings. However, in two instruments, external clinical indicators particularly patient-perceived global ratings have been used to anchor clinical change to define the MICs, and these were compared with the SDCs. For a tool to have adequate responsiveness, the MIC should be greater than the SDC, as change could be considered “real” if the change score is above the measurement error, which is reflected in the SDC (12). The WOMAC pain and physical function subscales were responsive to clinical change in both hip and knee patients (23, 31), whereas the SF-36 physical function subscale was responsive in the hip population (31). Another looked at the responsiveness to change of SF-36 at a group level and at an individual level among hip and knee arthroplasty patients, and found that the SF-36 could better detect changes at a group level rather than at an individual level, and therefore might not be helpful in the monitoring of individual patients (42).
In terms of floor and ceiling effects, the WOMAC and OKS had favourable ratings compared with the SF-36. The floor and ceiling effects of an instrument can affect the content validity, reliability and ability to detect clinical change. The presence of floor or ceiling effects might mean that extreme items are missing on either end of the scales, suggesting limited content validity. This leads to the decreased ability of the tool to then distinguish persons who have the highest or lowest scores from one another, as well as to detect further improvement or deterioration in status (12).
Practical burden is another consideration. The positively-rated OKS, SF-12 and LAI are relatively short instruments, with number of items ranging from 10–12, and are thus quick to complete. The criteria used in this review for practical burden was arbitrary and might be simplistic and limited. It focused only on respondent burden and time to completion of the tool and did not include the administrative burden, which considers the time, effort, and needed resources on the part of the person administering the test. Preferred instruments are those that do not place undue physical and emotional strain to both respondents and the persons administering them. Tools with lesser burden also tend to have less missing data (13).
When a tool that is in a different language or originally used in another setting is utilized in another context, a simple translation is unlikely to be adequate. Even if it is adequate, cultural differences can adversely affect its measurement properties. Instruments assessing psychological states of subject perception are bounded by culture. There are perceptions, behaviours, preferences, values and specific reactions to symptoms and health conditions that are not transferred readily between cultures. The process of developing a cross-cultural adaptation is important as well as complex and several authors have proposed guidelines in producing cross-cultural versions. The steps common to all these guidelines are examination of content of the instrument and conceptual basis, translation, quality control measures and psychometric testing (93). Some of the adapted versions of the WOMAC, OHS, OKS and NHP were indeterminately-rated because it was not clear from the methods if the cultural adaptation process went further than simple language translations.
The other key finding of this review relates to the essential requisites for evaluative instruments. As evaluative outcome measures are used to assess change in patients over time, these measures are required to have high reproducibility and high responsiveness (86, 94, 95). These instruments need to be able to assess change, if it occurred, and to be able to establish that this change is beyond the range of the measurement error. It is for this reason that the agreement parameter is vital (and preferred over the reliability parameter) as this concerns the absolute measurement error. The measurement error helps to distinguish whether the change that occurred is relevant. As mentioned earlier, the SDC can be estimated from the measurement error, and this can be compared with the MIC. Knowing the amount of measurement error and the SDC, as well as how these relate to the MIC, provides insight into the meaning of values on the instrument (12). In this review, estimates of agreement were reported less frequently compared with estimates of reliability. Of the 28 instruments, 11 reported a reliability parameter and only 5 presented an agreement parameter. It has been observed that researchers tend to use more of the reliability parameters than the agreement parameters (86). Agreement parameters tend to be neglected in clinimetric studies in the medical sciences (86). The other issue of concern was the lack of definition of minimal important change in determining the responsiveness of the instruments. In this review, most studies examined responsiveness to clinical change by estimating effect sizes, standardized response means, and t statistic, which could be affected by sample size and sample variation. Only a few studies defined the MIC to allow meaningful interpretation of the obtained scores. In two studies involving the WOMAC and SF-36, the MIC was anchored to transition questions about patients’ perception of improvement or deterioration and then compared with the SDC (23, 31). In another study on SF-36, the MICs at group level were based on the moderate effect size (Cohen’s d) and these were then compared with the SDC (42). The views as to what defines clinically important change are not always in agreement, as the meaning of a change in score may differ across patient groups and conditions (92). Defining what constitutes a clinically meaningful change is a challenge for future clinimetric studies.
The study has several limitations. Only instruments with fixed items were included, and others where patients supplied a relevant problem/domain in a questionnaire (e.g. McMaster-Toronto Arthritis Questionnaire, Patient-Specific Index) were not included and assessed. Also, as only clinimetric studies published in English were included, foreign articles investigating psychometric properties of foreign versions of tools might have been missed, and the evaluation of cultural adaptation might be limited. The definitions, methods and approaches in assessing the attributes varied from one study to another. There is no gold standard to assess the measurement properties of multidimensional, patient-reported instruments. The review included only those studies where measurement properties were assessed using classical response theory, and therefore recent studies utilizing relatively newer approaches (e.g. item response theory (IRT)) might have been missed, and thus limited the evaluation of the quality of measurement attributes of some instruments. The IRT method is becoming a prominent tool in rehabilitation research. At present, however, explicit criteria for quality evaluation for the methods and results of studies using IRT models are still lacking. Some approaches in determining agreement and responsiveness to clinical change are also relatively new and may have disadvantaged some tools in the ratings, particularly those with studies that have been published earlier. The ratings given to the instruments relied largely on the study methodology and conduct, availability of information, documentation and reporting. The unfavourable or indeterminate ratings a tool received could be because of flaws in study methods, and not necessarily because of deficiency of the tool per se. In addition, there were some tools that had varied ratings per measurement attribute, because these have been extensively studied, e.g. WOMAC, SF-36, compared with some others that had only one or a few clinimetric studies but had positive ratings for the attributes. Where negative results in clinimetric studies were obtained and then not published (publication bias) is another limitation, as this might have precluded the inclusion of these studies.
In summary, the measurement attributes of the various multidimensional patient-reported instruments applied in rehabilitation following hip and knee arthroplasty have been reviewed and compared. However, recommendations about which measure to use must be made with caution, as data on most important pre-requisites for an evaluative tool are mostly lacking. Overall, the WOMAC, OKS, and SF-36 are worth considering, as these have been the most comprehensively tested in these populations. More rigorous evaluations in key areas, such as reproducibility, responsiveness to clinical change, and minimal important change, are needed to make stronger recommendations.
REFERENCES